
American Funds
2035 Target Date
Retirement Fund
Set your sights on retirement and beyond.
American Funds 2035 glide path
A glide path is a visual representation of how the investments in each of our funds change over time based on the target retirement date. Depending on the proximity to its target date, the fund will seek to achieve the following objectives to varying degrees: growth, income and conservation of capital. Learn more about the benefits of our glide path.
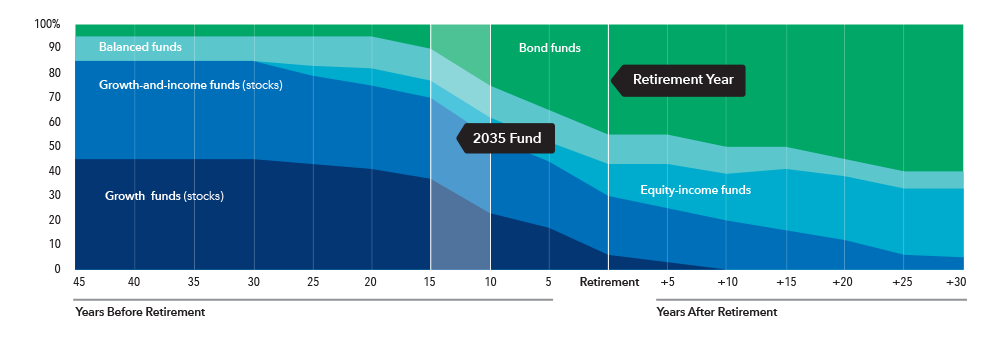
Source: Capital Group. Target allocations as of December 31, 2024, and are subject to the oversight committee's discretion. The investment adviser anticipates assets will be invested within a range that deviates no more than 10% above or below the allocations shown in the prospectus. Underlying funds may be added or removed during the year. For current allocations to the underlying funds, visit capitalgroup.com.
Asset mix¹
The asset mix seeks to balance risk and return over time by diversifying investments across asset types such as stocks and bonds. Stocks have the highest long-term return potential while bonds can help manage the risk of market declines.
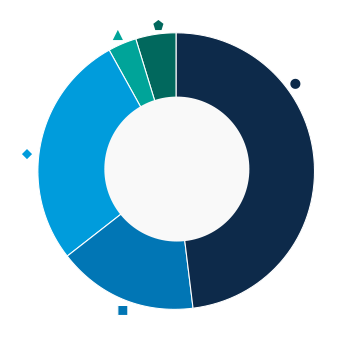
 U.S. stocks
48.1%
 Non-U.S. stocks
16.5%
 U.S. bonds
27.5%
 Non-U.S. bonds
3.3%
 Cash & equivalents
4.6%
As of 3/31/2025
Cash and equivalents includes short-term securities, accrued income and other assets less liabilities. It may also include investments in money market or similar funds managed by the investment adviser or its affiliates that are not offered to the public.
For most recent fund statistics, visit capitalgroup.com.

One fund. Many benefits. (Brochure)
Although the target date portfolios are managed for investors on a projected retirement date time frame, the allocation strategy does not guarantee that investors' retirement goals will be met. Investment professionals manage the portfolio, moving it from a more growth-oriented strategy to a more income-oriented focus as the target date gets closer. The target date is the year that corresponds roughly to the year in which an investor is assumed to retire and begin taking withdrawals. Investment professionals continue to manage each portfolio for approximately 30 years after it reaches its target date.
Target allocation
The following identifies allocation by investment objective and the underlying funds for each.

Growth
22.2%
AMCAP Fund®
5.8%
American Funds Global Insight Fund
3.8%
The Growth Fund of America®
5.7%
The New Economy Fund®
0.1%
New Perspective Fund®
3.0%
New World Fund®
0.1%
SMALLCAP World Fund®
3.7%
Growth-and-income
30.6%
American Mutual Fund®
7.1%
Capital World Growth and Income Fund®
6.9%
Fundamental Investors®
5.7%
International Growth and Income Fund
2.0%
The Investment Company of America®
3.9%
Washington Mutual Investors Fund
5.0%
Equity-income
8.1%
Capital Income Builder®
4.0%
The Income Fund of America®
4.1%
Balanced
12.8%
American Balanced Fund®
7.9%
American Funds Global Balanced Fund
4.9%
Bond
26.3%
American Funds Inflation Linked Bond Fund®
5.2%
American Funds Mortgage Fund®
5.2%
Capital World Bond Fund®
2.0%
Intermediate Bond Fund of America®
3.2%
U.S. Government Securities Fund®
5.2%
American Funds Multi-Sector Income Fund
3.1%
American Funds Strategic Bond Fund
2.1%
The Bond Fund of America®
0.3%
As of 3/31/2025
For most recent fund statistics, visit capitalgroup.com.
- Figures are based on holdings of the underlying funds, if applicable, as of date shown.