Sample asset allocation details
Take a closer look at our sample asset allocations, including best, worst and median results over different periods.
Sample asset allocations
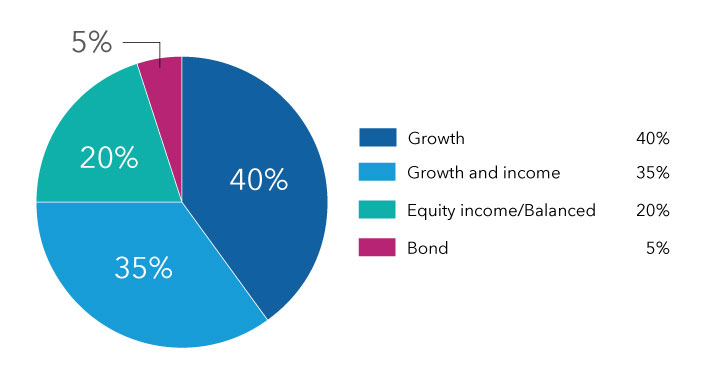
- Has historically provided the highest long-term returns and the most risk of the four samples.
- Growth and growth-and-income assets, those with the highest typical returns and volatility, make up 75% of the portfolio.
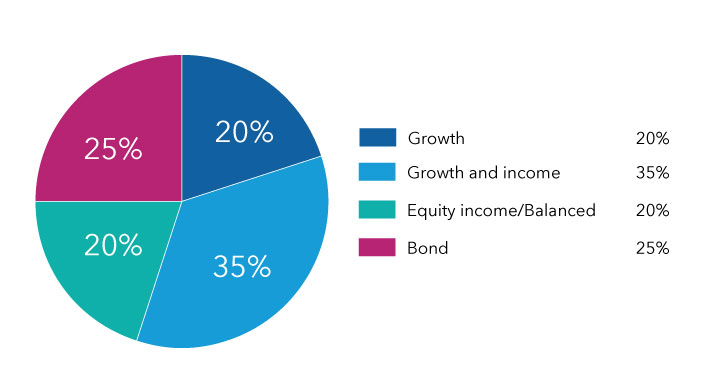
- Designed to provide growth potential along with some stability.
- Equity-income/balanced and bond asset segments can help temper the volatility of growth and growth-and-income assets, which still account for 55% of the portfolio.
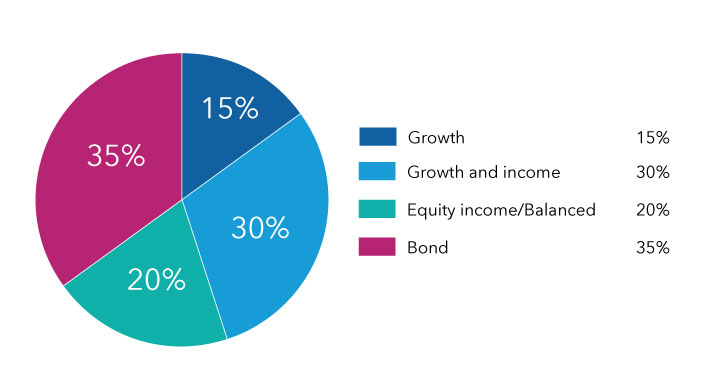
- Aims to reduce risk while also providing some growth.
- Largest category is made up of bond assets (35%), usually the least volatile of the four investment types found in the samples.
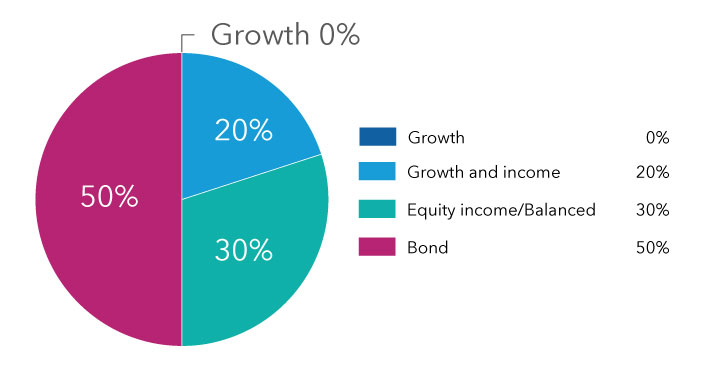
- Has provided the most stability of the four samples.
- Most income-oriented option, with 50% in bond assets and no growth assets.
- A 20% growth-and-income asset allocation provides a measure of growth potential in retirement.
These tables are for illustrative purposes only and are not intended to provide investment advice or portray actual investment results. Individual results will vary. Hypothetical average annual returns are calculated from 1976 (the beginning of the Bloomberg U.S. Aggregate Index) to 2024 and reflect weighted averages of the results of unmanaged indexes used to represent each style category. The style categories are represented by the following indexes: Lipper Growth Funds Index (growth), Lipper Growth and Income Funds Index (growth and income); a blend of the S&P 500 with the Bloomberg U.S. Aggregate Index weighted by their cumulative total returns at 60% and 40% respectively; this assumes the blend is rebalanced monthly (equity income/balanced); and Bloomberg U.S. Aggregate Index (bond).
These samples emphasize an investor’s time horizon and take into account the historic returns of different asset classes (growth, growth-and-income, equity-income/balanced and bond assets). Specifically, the samples seek to balance total return and stability over time. They are designed to take on more risk (in hopes of higher returns) the further an investor is from retirement and less risk (to help preserve capital) as an investor approaches retirement. The samples seek to give investors ample equity exposure as they get closer to retirement in an effort to help them outpace inflation over an expected distribution period of 20 years or more.
When evaluating particular asset allocation samples for your individual situation, you should consider your risk tolerance, as well as other assets, income and investments (e.g., home equity, Social Security benefits, savings accounts, and interests in other qualified and nonqualified plans) in addition to any investments in your plan(s) or individual retirement account(s) (IRA).
Lipper Growth Funds Index is an equally weighted index of growth funds, as defined by each fund's related prospectus. Lipper Growth and Income Funds Index is an equally weighted index of funds that combines a growth-of-earnings orientation and an income requirement for level and/or rising dividends. The results of the underlying funds in the indexes include the reinvestment of dividends and capital gain distributions, as well as brokerage commissions paid by the funds for portfolio transactions and other fund expenses, but do not reflect the effect of sales charges, account fees or U.S. federal income taxes.
The S&P 500 Index is a market capitalization-weighted index based on the results of approximately 500 widely held common stocks. This index is unmanaged, and its results include reinvested dividends and/or distributions but do not reflect the effect of sales charges, commissions, account fees, expenses or U.S. federal income taxes.
Bloomberg U.S. Aggregate Index represents the U.S. investment-grade fixed-rate bond market. This index is unmanaged, and its results include reinvested dividends and/or distributions but do not reflect the effect of sales charges, commissions, account fees, expenses or U.S. federal income taxes.
Past results are not predictive of results in future periods.