Time, not timing, is what matters

Investors learning how to invest in the stock market might ask when to invest. Knowing when to invest, however, isn’t as important as how long you stay invested.

Trying to navigate the peaks and valleys of market returns, investors seem to naturally want to jump in at the lows and cash out at the highs. But no one can predict when those will occur. Of course we’d all like to avoid declines. The anxiety that keeps investors on the sidelines may save them that pain, but it may ensure they’ll miss the gain. Historically, each downturn has been followed by an eventual upswing, although there is no guarantee that will always happen. 

The chart below shows two hypothetical investments in the S&P 500 over the 20-year period ending December 31, 2022. Each investor contributed $10,000 every year. One investor somehow managed to pick the very best day (the market low) of each year to invest. The average annual return on that investment would have been 11.43%. The other investor was not so lucky and actually picked the worst day (market high) each year. Even with the worst investment timing, the average annual return would have been 9.48%. At the end of 20 years, the cumulative investment of $200,000 had a value of  $549,645.

So even selecting the worst day each year to invest, someone who continued investing in the market over the past 20 years would have come out ahead. It’s important to note that regular investing neither ensures a profit or protects against a loss. However, the tables below illustrate how regular investing can be beneficial.

Timing isn’t critical to long-term success

Best-day investments
(Market lows)

Date of market low

Cumulative investment

Total
  value

3/11/2003

$10,000

$14,086

8/12/2004

20,000

27,096

4/20/2005

30,000

39,547

6/13/2006

40,000

57,503

3/5/2007

50,000

71,514

11/20/2008

60,000

57,103

3/9/2009

70,000

88,995

7/2/2010

80,000

114,824

10/3/2011

90,000

128,757

1/3/2012

100,000

160,786

1/8/2013

110,000

225,813

2/3/2014

120,000

268,774

8/25/2015

130,000

283,522

2/11/2016

140,000

329,909

1/3/2017

150,000

414,014

12/24/2018

160,000

406,529

1/3/2019

170,000

547,992

3/23/2020

180,000

665,833

1/4/2021

190,000

870,026

10/12/2022

200,000

723,233

Average annual total return?

(3/11/2003–12/31/2022): 11.43%

Worst-day investments
(Market highs)

Date of

market high

Cumulative investment

Total
  value

12/31/2003

$10,000

$10,000

12/30/2004

20,000

21,075

12/14/2005

30,000

31,925

12/15/2006

40,000

46,913

10/9/2007

50,000

58,915

1/2/2008

60,000

43,509

12/28/2009

70,000

64,914

12/29/2010

80,000

84,675

4/29/2011

90,000

95,827

9/14/2012

100,000

120,960

12/31/2013

110,000

170,137

12/29/2014

120,000

203,276

5/21/2015

130,000

215,806

12/13/2016

140,000

251,480

12/18/2017

150,000

316,325

9/20/2018

160,000

311,058

12/27/2019

170,000

418,972

12/31/2020

180,000

506,058

12/29/2021

190,000

661,269

1/3/2022

200,000

549,645

Average annual total return
(12/31/2003–12/31/2022): 9.48%

Source: S&P 500 Index

Riding it out

Note that the hypothetical investors above didn’t pull out of the market but stayed the course for 20 years. That perseverance helped improve the chances that they would come out ahead. In fact, history has shown that positive outcomes occur much more often over longer periods than shorter ones.
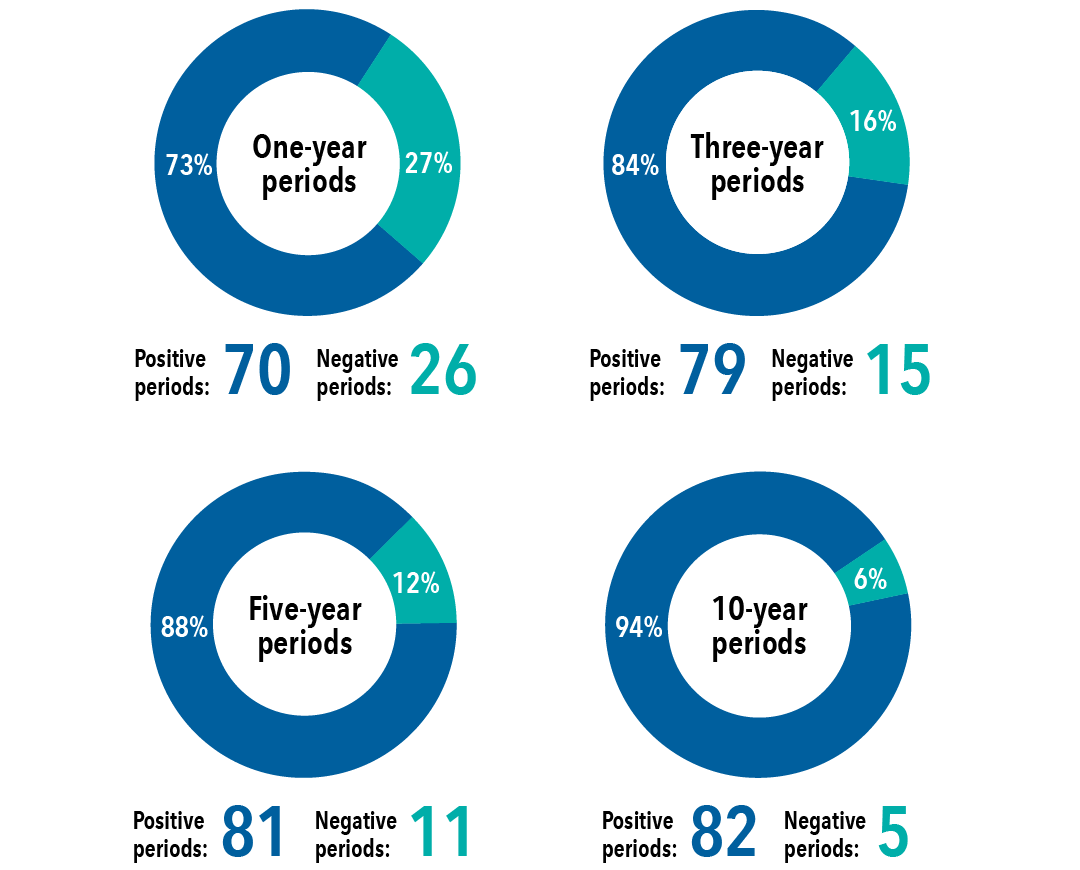
Over the past 94 years, the S&P 500 has gone up and down each year. In fact 27% of those years had negative results. As you can see in the chart below, one-year investments produced negative results more often than investments held for longer periods. If those short-term one-year investors had held on for just two more years, they would have experienced nearly half as many negative periods.

And the longer the time frame — through highs and lows — the greater the chances of a positive outcome. Indeed, over the past 94 years, through December 31, 2022, 94% of 10-year periods have been positive ones. Investors who have stayed in the market through occasional (and inevitable) periods of declining stock prices historically have been rewarded for their long-term outlook.

  History has shown the longer the period, the greater the chances of a positive outcome

Charts illustrate positive versus negative periods in the S&P 500 Index over the past 94 years, ending December 31, 2022. Over one-year periods, the index had 69 (73%) positive periods and 25 (27%) negative periods. Over three-year periods, the index had 77 (84%) positive periods and 15 (16%) negative periods. Over five-year periods, the index had 79 (88%) positive periods and 11 (12%) negative periods. And over 10-year periods, the index had 80 (94%) positive periods and 5 (6%) negative periods.

Source: S&P 500 Index

Rather than trying to predict highs and lows, it’s important to stay invested through a full market cycle. Focus on the time you stay invested, not the timing of your investments.

S&P 500 Index is a market capitalization-weighted index based on the results of approximately 500 widely held common stocks. This index is unmanaged, and its results include reinvested dividends and/or distributions but do not reflect the effect of sales charges, commissions, account fees, expenses or U.S. federal income taxes.

Investments are not FDIC-insured, nor are they deposits of or guaranteed by a bank or any other entity, so they may lose value.

Investors should carefully consider investment objectives, risks, charges and expenses. This and other important information is contained in the fund prospectuses and summary prospectuses, which can be obtained from a financial professional and should be read carefully before investing.

There may have been periods when the results lagged the index(es) and/or average(s). The indexes are unmanaged and, therefore, have no expenses. Investors cannot invest directly in an index.

Each S&P Index ("Index") shown is a product of S&P Dow Jones Indices LLC and/or its affiliates and has been licensed for use by Capital Group. Copyright © 2024 S&P Dow Jones Indices LLC, a division of S&P Global, and/or its affiliates. All rights reserved. Redistribution or reproduction in whole or in part is prohibited without written permission of S&P Dow Jones Indices LLC.

All Capital Group trademarks mentioned are owned by The Capital Group Companies, Inc., an affiliated company or fund. All other company and product names mentioned are the property of their respective companies.

Use of this website is intended for U.S. residents only.

American Funds Distributors, Inc.

This content, developed by Capital Group, home of American Funds, should not be used as a primary basis for investment decisions and is not intended to serve as impartial investment or fiduciary advice.