Select your location

  • Japan
  • International - other
  • Asia - other

Who are you ?

Select another location

Wer bist du ?

Wählen Sie einen anderen Ort

Qui êtes vous ?

Sélectionnez un autre emplacement

Qui êtes vous ?

Sélectionnez un autre emplacement

Who are you ?

Select another location

Qui êtes vous ?

Sélectionnez un autre emplacement

Wer bist du ?

Wählen Sie einen anderen Ort

Who are you ?

Select another location

Who are you ?

中國香港特別行政區

Who are you ?

Select another location

Wer bist du ?

Wählen Sie einen anderen Ort

Wer bist du ?

Wählen Sie einen anderen Ort

Qui êtes vous ?

Sélectionnez un autre emplacement

Who are you ?

Select another location

Wer bist du ?

Wählen Sie einen anderen Ort

Qui êtes vous ?

Sélectionnez un autre emplacement

Who are you ?

Select another location

Who are you ?

RETIREMENT PLAN INVESTOR

Use your plan ID (available on your account statement) to determine which employer-sponsored retirement plan website to use:

IF YOUR PLAN ID BEGINS WITH IRK, BRK, 754, 1 OR 2

Visit americanfunds.com/retire

IF YOUR PLAN ID BEGINS WITH 34 OR 135

Visit myretirement.americanfunds.com

Who are you ?

Select another location

Who are you ?

Select another location

Bull vs. bear markets: Knowing the difference can make you a better investor

Are we in a bull market, or has it become a bear? And why do we use those terms to describe the stock markets anyway?

One popular belief is that the terms are based on the animals’ styles of attack. While a bull attacks by thrusting its horns up, a bear attacks by swiping its paws down. These can be likened to market direction, since markets move up, down and sideways.

In bull markets, prices trend up as financial markets show optimism. In bear markets, prices trend down as financial markets show pessimism. Stagnant markets are a result of continual ups and downs, where market gains cancel losses. On average during the past seven decades, bull markets, as represented by the S&P 500 Index, have lasted for less than six years, with average cumulative returns of 265%, and bear markets have lasted for one year, with average cumulative returns of –33%.*
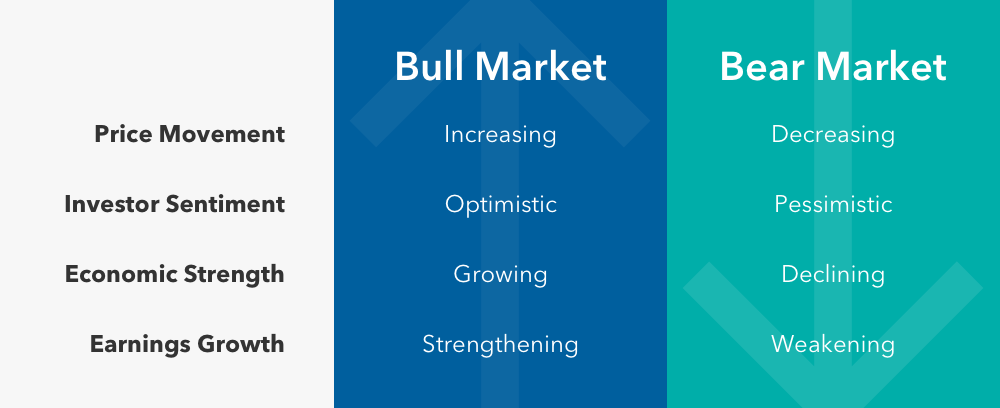
An infographic that explains direction of price movement, investor sentiment, economic strength, and earnings growth in a bull market as compared to a bear market. In a bull market, price movement is increasing, investor sentiment is optimistic, economic strength is growing, and earnings growth is strengthening. In a bear market, price movement is decreasing, investor sentiment is pessimistic, economic strength is declining, and earnings growth is weakening.

Market cycles inevitably include both bull and bear markets. In fact, the exact length and scope of these markets are never clear until after the fact. In hindsight, trying to time these cycles consistently is impossible. As a mutual fund company, Capital Group has navigated various markets cycles for 91 years. Based on our experiences, here are a few tips to help you develop a plan of attack to boost your confidence in all types of markets:

  • Create an investment plan and stick to it — through market ups and downs.
  • Diversify your assets in a variety of investments to help provide resilience during downturns.
  • Invest for the long term, rather than chasing short-term trends.

*Source: Capital Group, RIMES, Standard & Poor's. As of 6/30/23. The bull market that began on 10/12/22 is considered current and is not included in the "average bull market" calculations. Bear markets are peak-to-trough price declines of 20% or more in the S&P 500. Bull markets are all other periods.

S&P 500 Index is a market capitalization-weighted index based on the results of approximately 500 widely held common stocks. This index is unmanaged, and its results include reinvested dividends and/or distributions but do not reflect the effect of sales charges, commissions, account fees, expenses or U.S. federal income taxes.

Past results are not predictive of results in future periods.

Investments are not FDIC-insured, nor are they deposits of or guaranteed by a bank or any other entity, so they may lose value.

Investors should carefully consider investment objectives, risks, charges and expenses. This and other important information is contained in the fund prospectuses and summary prospectuses, which can be obtained from a financial professional and should be read carefully before investing.

There may have been periods when the results lagged the index(es) and/or average(s). The indexes are unmanaged and, therefore, have no expenses. Investors cannot invest directly in an index.

Each S&P Index ("Index") shown is a product of S&P Dow Jones Indices LLC and/or its affiliates and has been licensed for use by Capital Group. Copyright © 2024 S&P Dow Jones Indices LLC, a division of S&P Global, and/or its affiliates. All rights reserved. Redistribution or reproduction in whole or in part is prohibited without written permission of S&P Dow Jones Indices LLC.

All Capital Group trademarks mentioned are owned by The Capital Group Companies, Inc., an affiliated company or fund. All other company and product names mentioned are the property of their respective companies.

Use of this website is intended for U.S. residents only.

American Funds Distributors, Inc.

This content, developed by Capital Group, home of American Funds, should not be used as a primary basis for investment decisions and is not intended to serve as impartial investment or fiduciary advice.