Economic Indicators
 Jared Franz
Don't miss our latest insights.
If you had told me a year ago that the United States would be waging an intractable war in the Middle East, oil prices would rise to more than $100 a barrel, interest rates would be moving sharply higher, and inflation would be running well above 3%, my forecast for the U.S. economy would have been gloomy to say the least.
Yet here we are with consensus GDP growth estimates above 2%, significantly higher than our developed-market peers around the world. And, in my estimation, the consensus data is too low. Based on my research, I see the U.S. economy growing at a rate of 2.5% to 3% this year and next year, thanks to a stronger-than-expected labor market, healthy consumer balance sheets and massive corporate spending on artificial intelligence.
U.S. economic growth is outpacing other developed nations
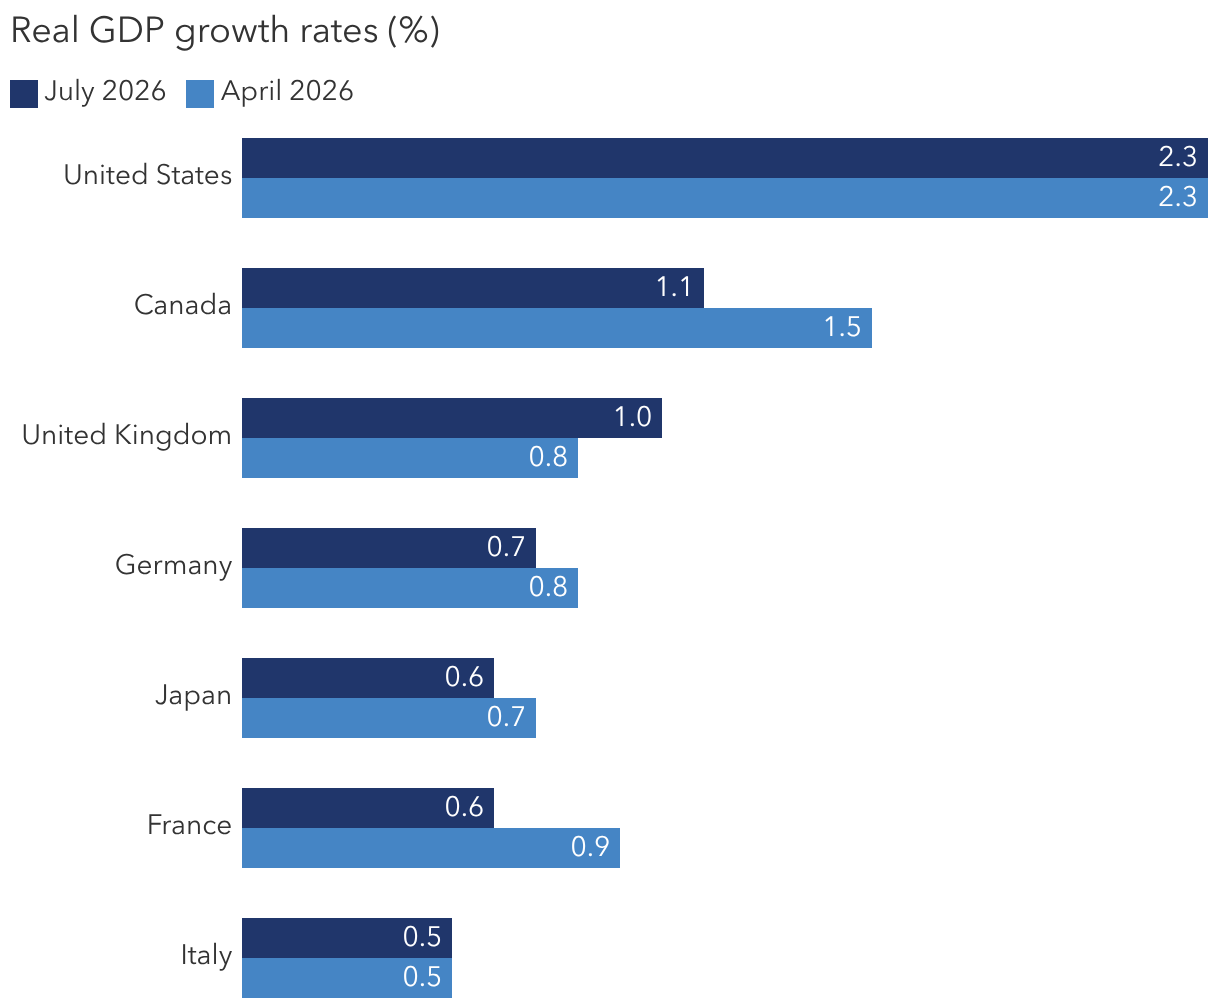
Sources: Capital Group, International Monetary Fund. Real GDP growth estimates for G7 countries from the IMF’s July 2026 World Economic Outlook released on July 8, 2026. The Group of Seven (G7) — made up of the U.S., Canada, the United Kingdom, Germany, Japan, France and Italy — is a group of advanced democracies that meet annually to coordinate global economic policy.
What explains the remarkable resilience of the U.S. economy? There are many reasons but, in my view, these are the three primary drivers:
1. The U.S. labor market is defying expectations
The latest U.S. jobs report, released September 4, was nothing short of a blockbuster. The U.S. economy added 162,000 jobs in August, three times higher than consensus estimates, with the largest gains coming in leisure and hospitality, government, education and healthcare. The jobs report was so unexpectedly strong that it helped change expectations for U.S. monetary policy. Accelerating job growth and higher inflation were two of the key factors that convinced the U.S. Federal Reserve to raise interest rates on September 16 — the first hike in more than three years.
A healthy labor market is important because, even at a more modest average of 75,000 new jobs a month, the additional income that brings to the U.S. economy is substantial. If you do the math, it translates into consumer spending growth of roughly 2% on an annualized basis, which is pretty good relative to history, particularly at a time when elevated inflation is straining household budgets.
U.S. job creation is bouncing back after a period of weakness
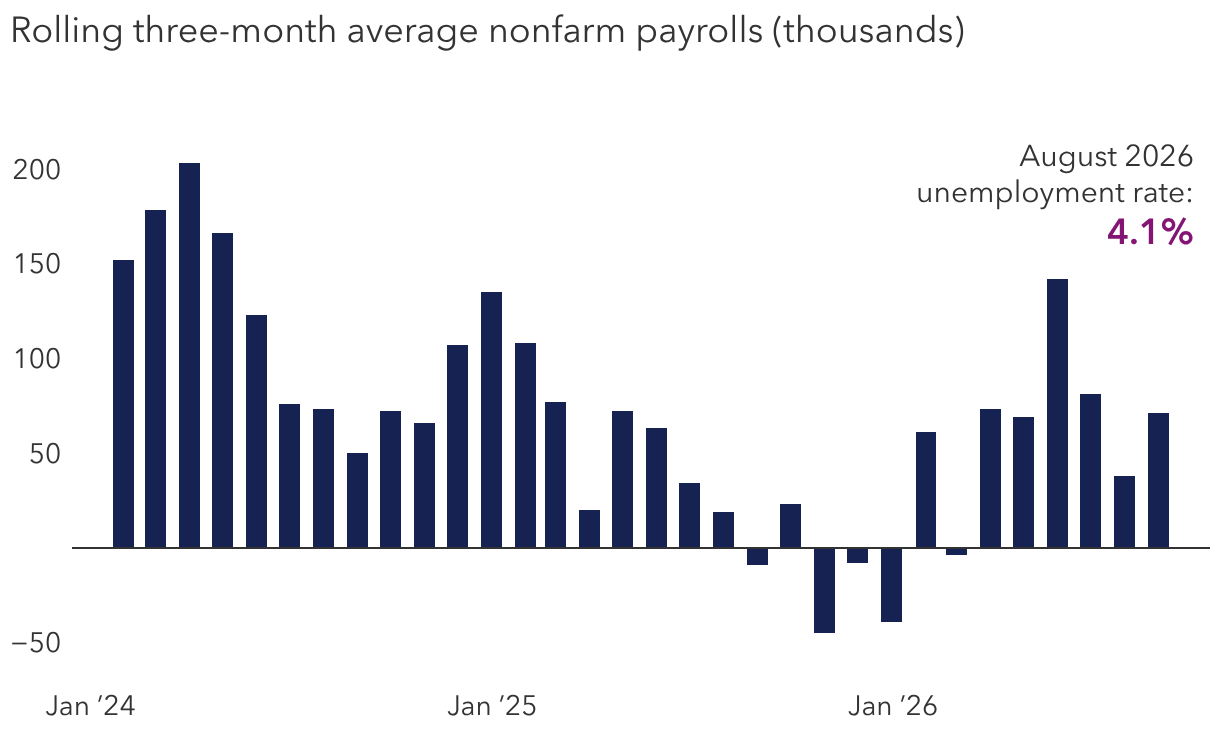
Sources: Capital Group, Bureau of U.S. Labor Statistics. July and August 2026 are preliminary figures and subject to change. Latest data available is through August 2026, as of September 25, 2026.
A growing labor market also reinforces the view that the Fed probably can afford to raise interest rates without hurting employment. It means Fed officials can refocus their attention on fighting inflation, which is now running hot at 3.4%, well above the Fed’s 2% target. The U.S. unemployment rate, meanwhile, remains at 4.1%, which is widely considered full employment. If these trends continue, we should expect a few more Fed rate hikes in the months ahead. The U.S. economy is most likely strong enough to handle it.
2. Consumer balance sheets are healthy despite higher inflation
U.S. consumer balance sheets are holding up well in the face of mounting inflationary pressures. Wage growth has remained steady at an annualized rate of 3.7% to 4.1% as of August 2026, generally outpacing inflation. So, even with higher-than-usual inflation, American consumers have managed to stay in relatively good shape, and their spending activity shows it. We’ve seen weakness among low-income households hard hit by rising energy prices, but middle- and high-income groups appear to have adjusted to the shock and made up the difference.
This trend is attributable to several factors, including rising stock market wealth — particularly in 401(k) accounts — appreciating home values, the recovering job market, higher tax refunds and various other government stimulus measures. For most American consumers, they simply don’t see a reason to pull back. U.S. consumer spending rose by 0.2% last month to a record high of $16.8 trillion, exceeding consensus forecasts, according to the Commerce Department.
Consumers are continuing to spend in the face of higher prices
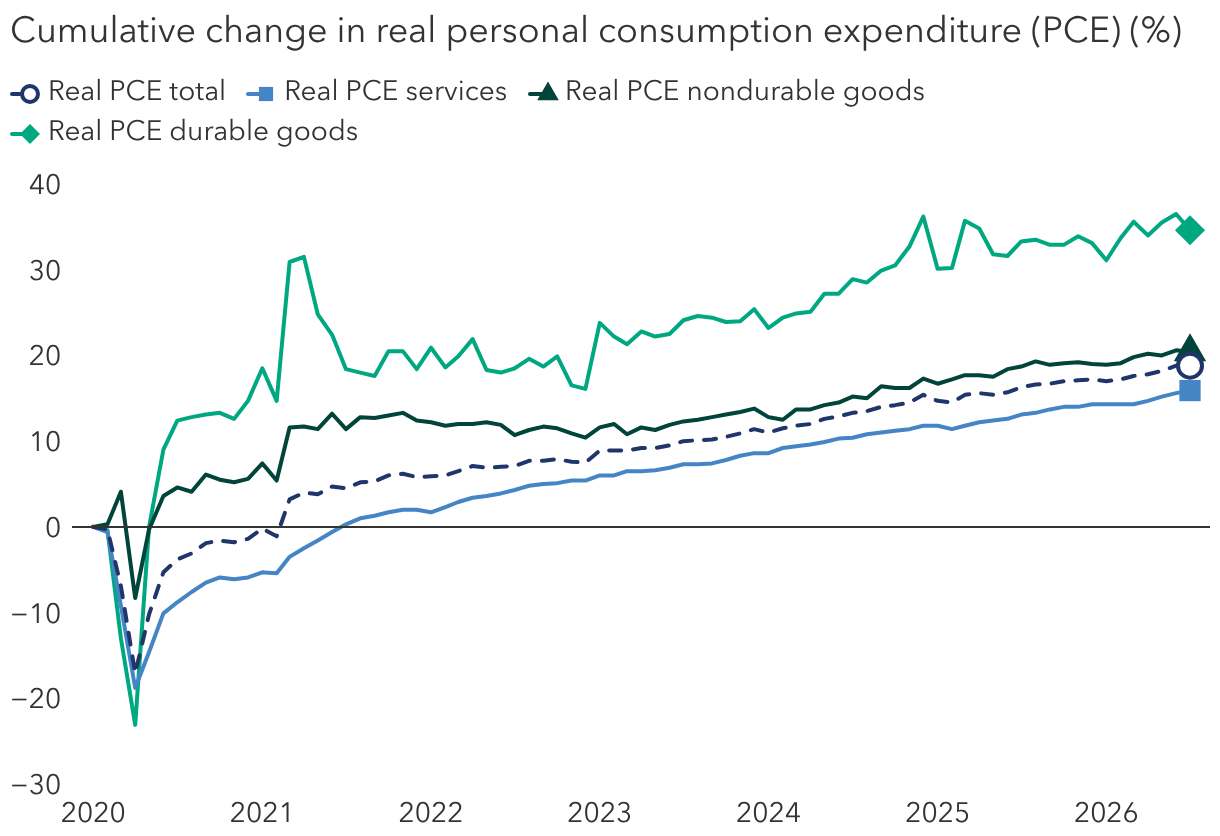
Sources: Capital Group, Bureau of Economic Analysis, Federal Reserve Bank of St. Louis. Figures shown are monthly from January 2020, through July 2026, reflecting latest available data as of September 11, 2026.
Consumer sentiment, in contrast, remains negative. That’s to be expected when you consider the cumulative price increases that U.S. consumers have absorbed since the COVID-19 pandemic. Prices have soared roughly 30% over the past six years, as measured by the U.S. Consumer Price Index. By comparison, from 2012 to 2019, prices rose about 14%. There is probably no scenario where consumers are going to be happy about such a rapid rise. Beyond that, I tend to give less weight to consumer sentiment surveys than hard economic data.
3. The AI-related spending surge is unprecedented
The sheer scale of AI-related spending is like nothing we’ve seen before. Most of the capital expenditures — an estimated $800 billion this year — are going toward the construction of massive AI data centers and related projects across the United States. Despite a mounting political backlash, there appears to be no slowdown. On the contrary, AI-related spending estimates have been revised upward on numerous occasions. I expect upward revisions in 2027 and 2028, as well.
That adds a great deal of fuel to the U.S. economy. Moreover, I don’t think we are measuring the impact of the AI boom properly. It could take years for economists to devise an accurate way to measure this rapidly growing segment. It’s just an educated guess, but I think we may be underestimating GDP growth by 0.5 to 1 full percentage point. How do you measure every instance someone uses an AI token to build a more efficient financial model in a fraction of the time it takes a human to do it? A decade from now, we may find that 4% to 5% growth is a more accurate measurement of what we are experiencing today. Going back to the dot-com era, we have often struggled to measure the economic benefit of bits of data zipping around the world.
In addition, it’s clear that the giant technology companies spending most of this money view it as existential. The so-called hyperscalers — Amazon, Alphabet, Meta, Microsoft and Oracle — are among the most profitable companies in the world, and they are engaged in an epic race for AI supremacy. Given how high the stakes are, I don’t see any of them slowing down anytime soon.
AI spending spree dwarfs some of the largest endeavors in history
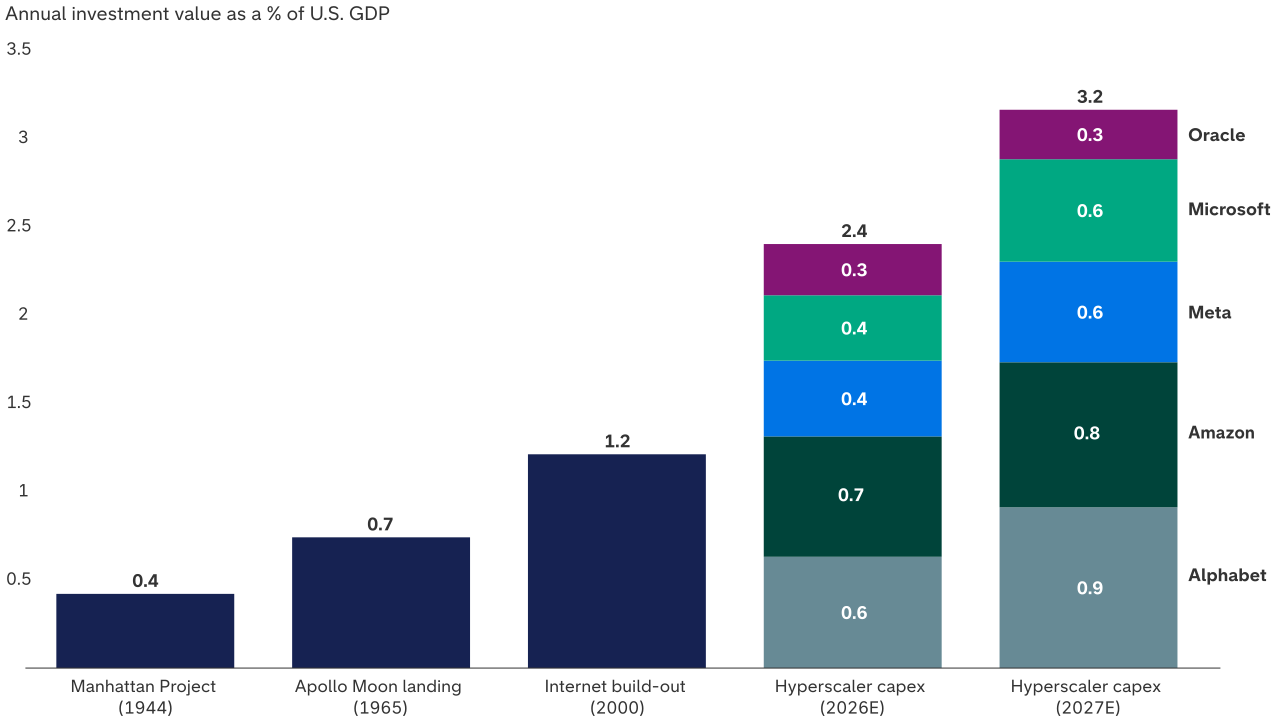
Sources: Capital Group, Brookings, Congressional Budget Office (CBO), FactSet, Federal Reserve Bank of St. Louis, The Planetary Society, U.S. Census Bureau. Project costs for the Manhattan Project, Apollo Moon landing and internet build-out reflect peak annual spending during each project’s lifetime. Hyperscalers are large technology firms that operate global data-center networks to provide scalable cloud computing and AI services, represented by Alphabet, Amazon, Meta, Microsoft and Oracle. Estimated 2026 and 2027 hyperscaler capital expenditures (capex) are based on sell-side consensus estimates as of September 25, 2026, expressed as a percentage of GDP using the latest CBO long-term budget projections released on February 11, 2026.
What does this mean for U.S. stock prices?
Over long periods of time, U.S. stocks tend to rise along with a solid, growing economy. There are four economic cycles: early, mid-, late and recession. I believe the U.S. economy is currently at mid-cycle, which generally bodes well for stock prices. Double-digit returns are common in a mid-cycle environment, and that’s about where we are right now — with the S&P 500 Index up 14.1% on a year-to-date basis, and up 18.6% over the past 12-month period, as of September 25. My outlook becomes more cautious as we approach a late cycle economy, which I believe may surface sometime in 2028.
There are certainly risks to this optimistic outlook, including further escalation of the Iran war, additional increases in oil prices, sharply higher interest rates, and the possibility that AI will not produce the return on invested capital companies expect. Any of these could reverse the favorable investment environment of the past few years.
That said, the economy and the markets are not the same thing. Today’s high levels of market concentration have embedded risks, which is why it’s important to consider a broadly diversified investment approach that goes beyond top-heavy indexes.
A handful of stocks are driving a highly concentrated market
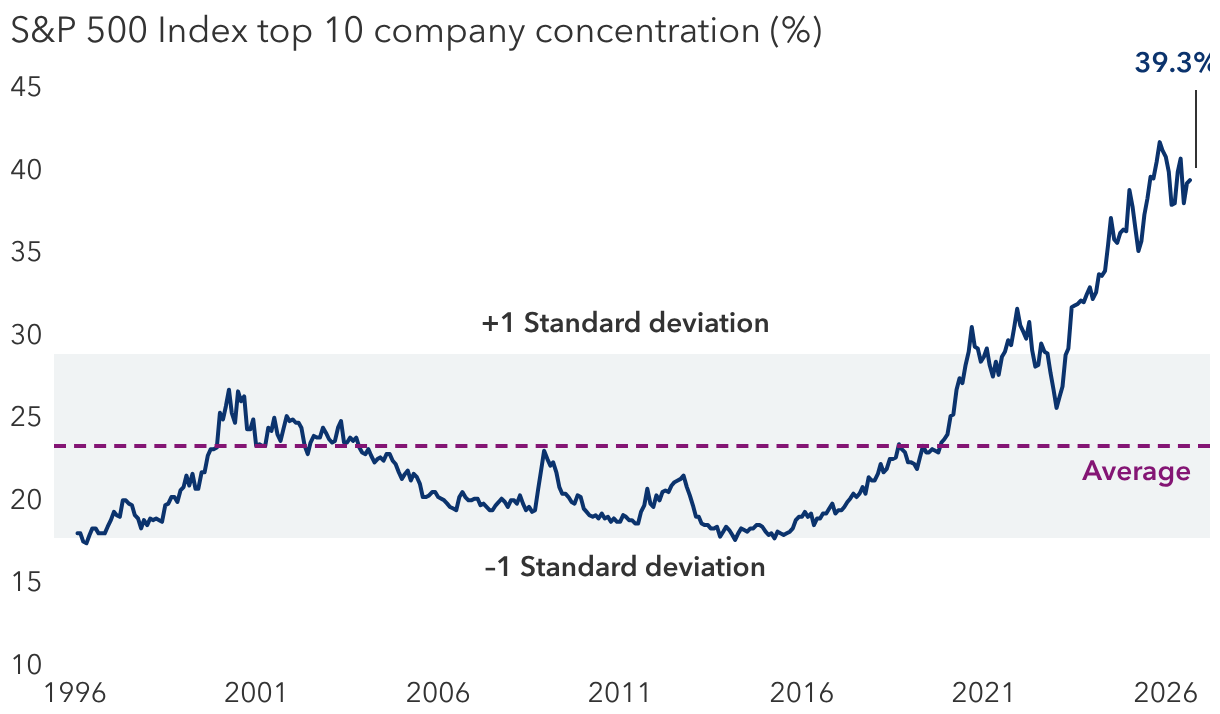
Sources: Capital Group, FactSet, S&P Global. Figures represent the index concentration of the top 10 companies by market capitalization. Standard deviation is a statistical measure of how much values vary from their average. A higher number indicates greater variation. Data shown is monthly, from January 31, 1996, through August 31, 2026.
For now, I feel comfortable with the view that the U.S. economy will continue to surprise on the upside, thanks to a strong labor market, healthy consumer spending and an AI revolution that could produce significantly higher growth rates in the years ahead.
Past results are not predictive of results in future periods.
GDP refers to gross domestic product.
The U.S. Consumer Price Index is a measure of the average change over time in the prices paid by urban consumers for a market basket of consumer goods and services.
The S&P 500 is a market capitalization-weighted index based on the results of approximately 500 widely held common stocks.
Indexes are unmanaged and, therefore, have no expenses. Investors cannot invest directly in an index.
Our latest insights
-
-
Artificial Intelligence
-
Artificial Intelligence
-
Interest Rates
-
World Markets Review
RELATED INSIGHTS
-
Artificial Intelligence
-
Technology & Innovation
-
Artificial Intelligence
Don’t miss out
Get the Capital Ideas newsletter in your inbox every other week