Active Management
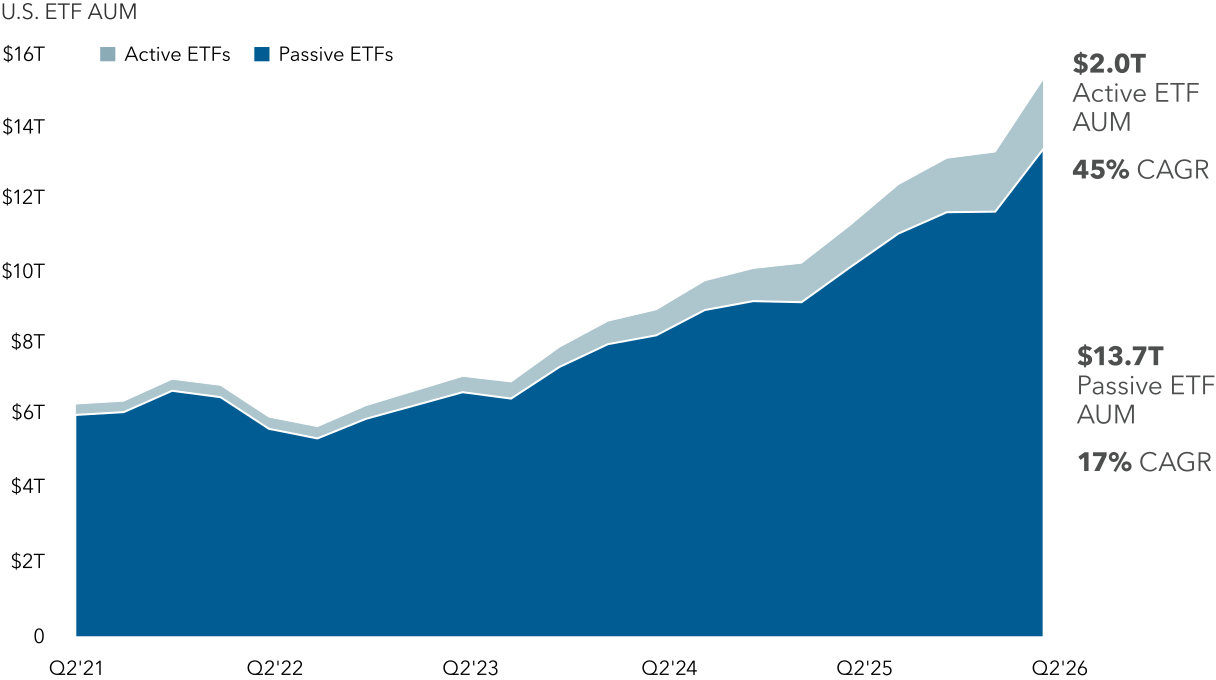
Active ETFs continued their ascension through the second quarter of 2026, strengthening their position as one of the fastest growing segments of the ETF market. The broader ETF landscape approached $16 trillion in assets under management (AUM) as of June 30, 2026, with active strategies taking more share and making notable contributions to growth. Active ETF AUM grew 21% from the previous quarter, outpacing the 15% gain for passive ETFs. The compound annual growth rate (CAGR) for the trailing five years is more striking, at 45% growth for active ETFs versus just 17% for passive.
That growth has changed the shape of the market. Active ETFs now represent 12.5% of total ETF AUM, up from 4.7% five years ago. Since the Securities and Exchange Commission’s (SEC) Rule 6c-11 became effective in December 2019, active ETFs have multiplied by almost 14 times, while passive ETFs posted roughly a quarter of that growth over the same period. The figures suggest that active ETFs have moved from a niche offering to become a more mainstream vehicle for investors seeking active management in an ETF format.
Active ETFs have become a much greater contributor to overall ETF AUM
Source: Morningstar Direct, U.S. ETFs only as of June 30, 2026.
Flows broaden beyond niche strategies
The ETF industry ended Q2 2026 with $542 billion in net flows, led by U.S. equity and taxable bond categories. Active ETFs captured $185 billion, or 34% of total ETF flows. Within that total, taxable bond drew $49 billion and U.S. equity drew $40 billion – a flow mix underscoring that investor demand is not confined to narrow or opportunistic strategies.
Product development has also favored active ETFs. Since Rule 6c-11 was passed, active ETF listings have outpaced passive ETF listings, and the gap widened substantially over the past five years. In Q2 2026, “Other” products — including alternatives, commodities and miscellaneous categories — were the largest contributors to active ETF launches, followed by nontraditional equity, taxable bonds and U.S. equity. Still, product launches and investor flows do not tell identical stories. While issuers continued to add niche and targeted exposures, flows were strongest in broad, familiar categories, with core asset class exposures dominating active ETF flows.
Fixed income is another important area for active ETFs. Active management has long dominated fixed income mutual funds, representing 77% of AUM and more than half of flows in Q2 2026. The ETF market appears to be reflecting a similar appetite: active fixed income ETFs’ share of flows, at 38%, outpaced their 23% share of AUM. That imbalance may suggest that investors are allocating new money to active fixed income ETFs at a faster rate than their existing asset share would imply.
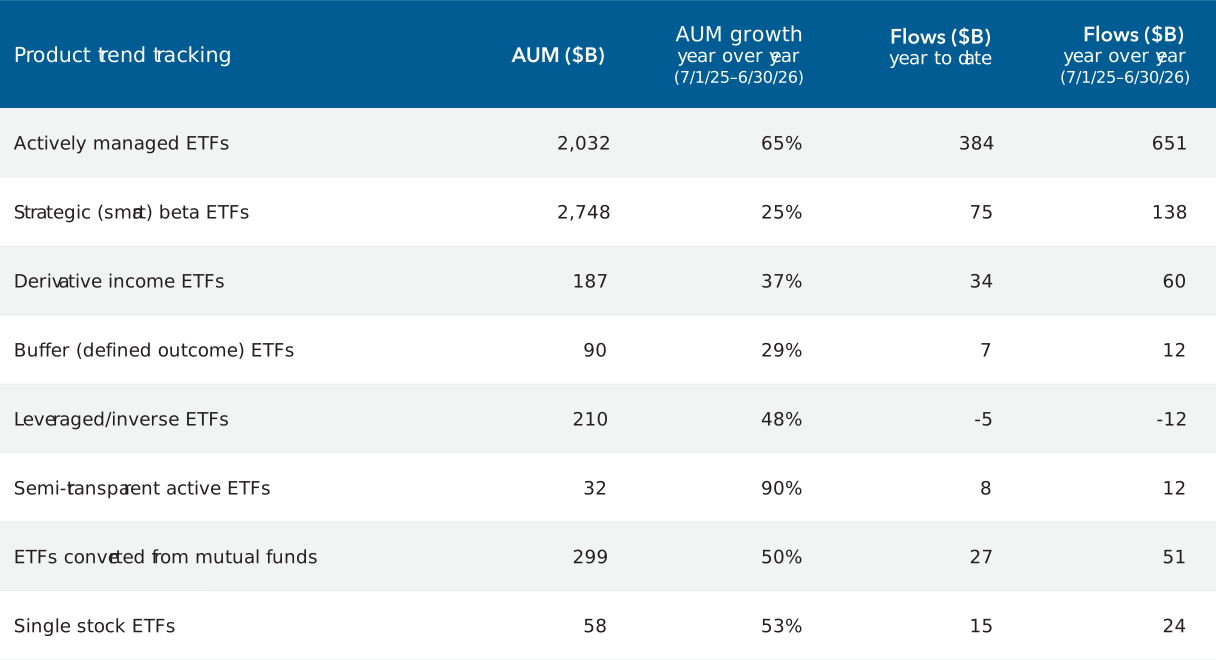
Turning to product-specific trends, strategic (or smart beta) ETFs remain larger by assets, but active ETFs are capturing a disproportionate share of new flows: $384 billion year-to-date, compared with $75 billion for smart beta. Active ETF AUM also grew by more than 65% year-over-year, versus 25% for smart beta. That suggests demand is shifting toward strategies where portfolio managers can make security selection, sector allocation or risk-management decisions within the ETF wrapper.
Product-specific trends underscore the rise in active ETFs
Source: Morningstar Direct, U.S. ETFs only as of June 30, 2026.
New structures may extend active ETF growth
Several active ETF subcategories remain small but notable. Semi-transparent active ETFs (which do not disclose fund holdings daily) and ETFs converted from mutual funds grew quickly from modest bases, rising 90% and 50% year-over-year, respectively, though flows remained more limited. Issuers have generally favored launching new active ETFs over repurposing legacy mutual fund strategies. At the same time, the approval of an ETF share class structure for existing mutual funds may create another path for active managers to offer established strategies in ETF form.
Overall, the data show an ETF market where active strategies are growing faster than passive ones, taking share in assets and flows, and expanding across both core and specialized exposures. The rise of active ETFs is being driven by a combination of investor demand, issuer innovation and the appeal of active management inside the ETF structure. If recent trends persist, active ETFs appear positioned to remain a central growth engine for the industry.
For more of our quarterly ETF insights, read the full report.
© 2026 Morningstar, Inc. All Rights Reserved. Some of the information contained herein: (1) is proprietary to Morningstar and/or its content providers; (2) may not be copied or distributed; and (3) is not warranted to be accurate, complete or timely. Neither Morningstar, its content providers nor Capital Group are responsible for any damages or losses arising from any use of this information. Past performance is no guarantee of future results. Information is calculated by Morningstar. Due to differing calculation methods, the figures shown here may differ from those calculated by Capital Group.
Our latest insights
-
-
Artificial Intelligence
-
Artificial Intelligence
-
Interest Rates
-
World Markets Review
RELATED INSIGHTS
-
Artificial Intelligence
-
Artificial Intelligence
-
Interest Rates
Don’t miss out
Get the Capital Ideas newsletter in your inbox every other week