Economic Indicators
 Jared Franz
 Talha Khan
 Jayme Colosimo
Don't miss our latest insights.
War in Iran has injected new uncertainty into the global economy, reviving concerns that high oil prices could drive inflation up, strain consumer spending and weigh on economic growth.
Prices for Brent crude and West Texas Intermediate zigzagged in recent days, hitting a high of nearly $120 a barrel as war escalated in the Middle East before quickly dropping below $100. As of March 11, the global Brent price settled at $91.98 per barrel, roughly 26% higher than before the U.S. strike on Iran.
About a fifth of the world’s oil supply moves through the Strait of Hormuz near Iran, so any disruption there will rapidly be reflected in fuel prices. Even in the United States, the world’s largest oil producer, the price of gasoline at the pump has jumped 20% since the U.S. and Israel attacked Iran on February 28.
“Consumers are quick to react to higher energy prices, often by dipping into savings and cutting back on gasoline use,” says U.S. economist Jared Franz. If oil hovers around $85 a barrel through 2026, he estimates American purchasing power could fall by roughly 0.6%.
“The impact may be painful for consumers, but U.S. GDP could remain on track to grow 2.8% this year, with unemployment stable in the range of 4% to 4.5%,” Franz adds. “The global economy too, could show similar resilience with growth near 2.8%. But that baseline is fragile if the war drags on.”
Oil shocks have been common since the 1990s
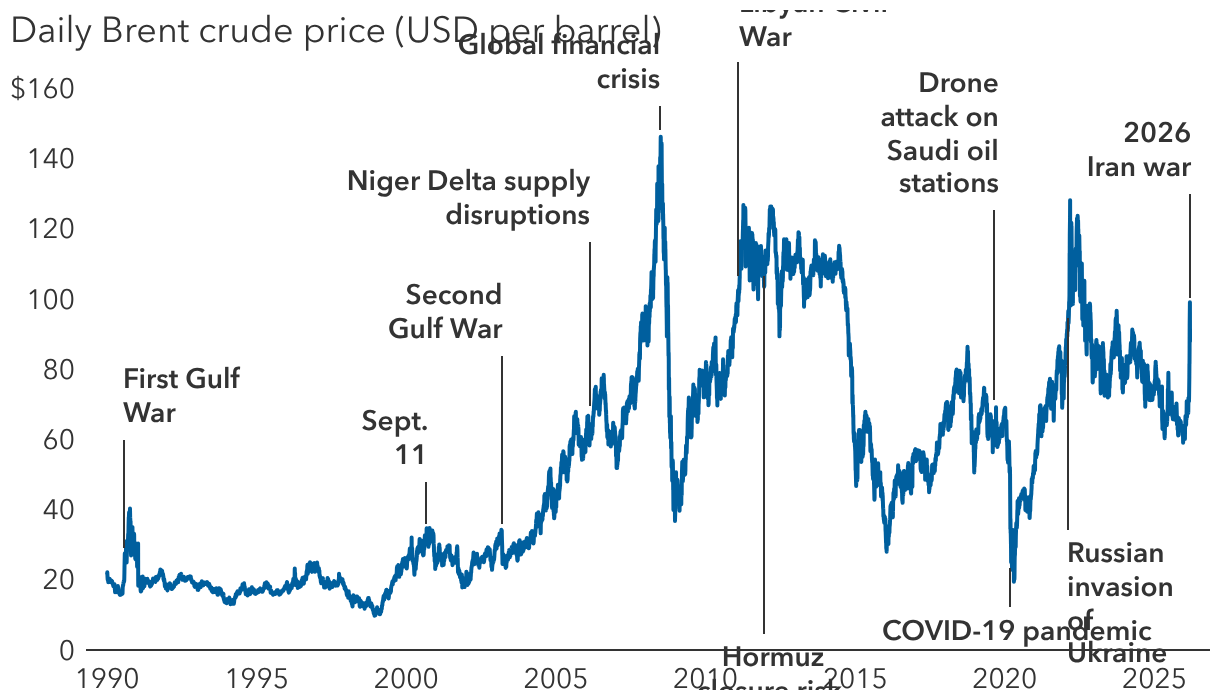
Sources: Capital Group, Bloomberg. Figures reflect daily settlement prices between January 1, 1990, and March 10, 2026. Event dates are aligned to the nearest observable market price. If an event occurs on a non‑trading day, the prior trading day is used as the start date.
How long will the war last?
According to political economist Talha Khan, the duration of the war depends on how two competing timelines evolve. Khan explains the conflict as unfolding along “two clocks.” The first is operational, which governs how long military action can be sustained, and the second is political, which reflects how long governments are willing — or able — to tolerate escalation.
Clock one: Military operations could drag on
The operational clock is defined by military sustainability, including missile inventories and logistics resilience. By that measure, “current patterns suggest both sides have prepared for duration,” Khan says.
Iran’s layered missile strategy is built around attrition and exhaustion rather than immediate shock. Israel and U.S. targeting reflects a multi-stage effort to degrade capabilities, rather than a short punitive strike.
“U.S. and Israeli strikes on Iran have entered an attritional phase marked by sustained combat rather than rapid resolution,” Khan adds. “They have achieved many operational successes, but that is not the same as strategic success.”
Clock two: The U.S. has a short political window
The political clock diverges sharply depending on the country. Iran’s tolerance for pain appears the highest, even though it is operationally weaker, according to Khan. “The regime views the conflict through an existential lens, meaning capitulation on terms dictated by its enemies would undermine its ideological foundation and long-term strategic aims.”
The United States' political clock likely is much shorter as President Trump has historically shown limited tolerance for protracted wars. “Domestic politics, market sensitivity, fiscal considerations, and competing global commitments are constraining open-ended escalation.
“The Gulf states, meanwhile, have the lowest tolerance threshold. This is not their war, yet they face immediate exposure through energy infrastructure, shipping lanes and capital markets.
“Thus, while the military campaign may have room to continue, political patience may wear thin more quickly. When political timelines and military timelines diverge, the risk of miscalculation or sudden escalation tends to rise, deepening economic uncertainty,” adds Khan.
U.S. stock markets often recovered from geopolitical oil disruptions
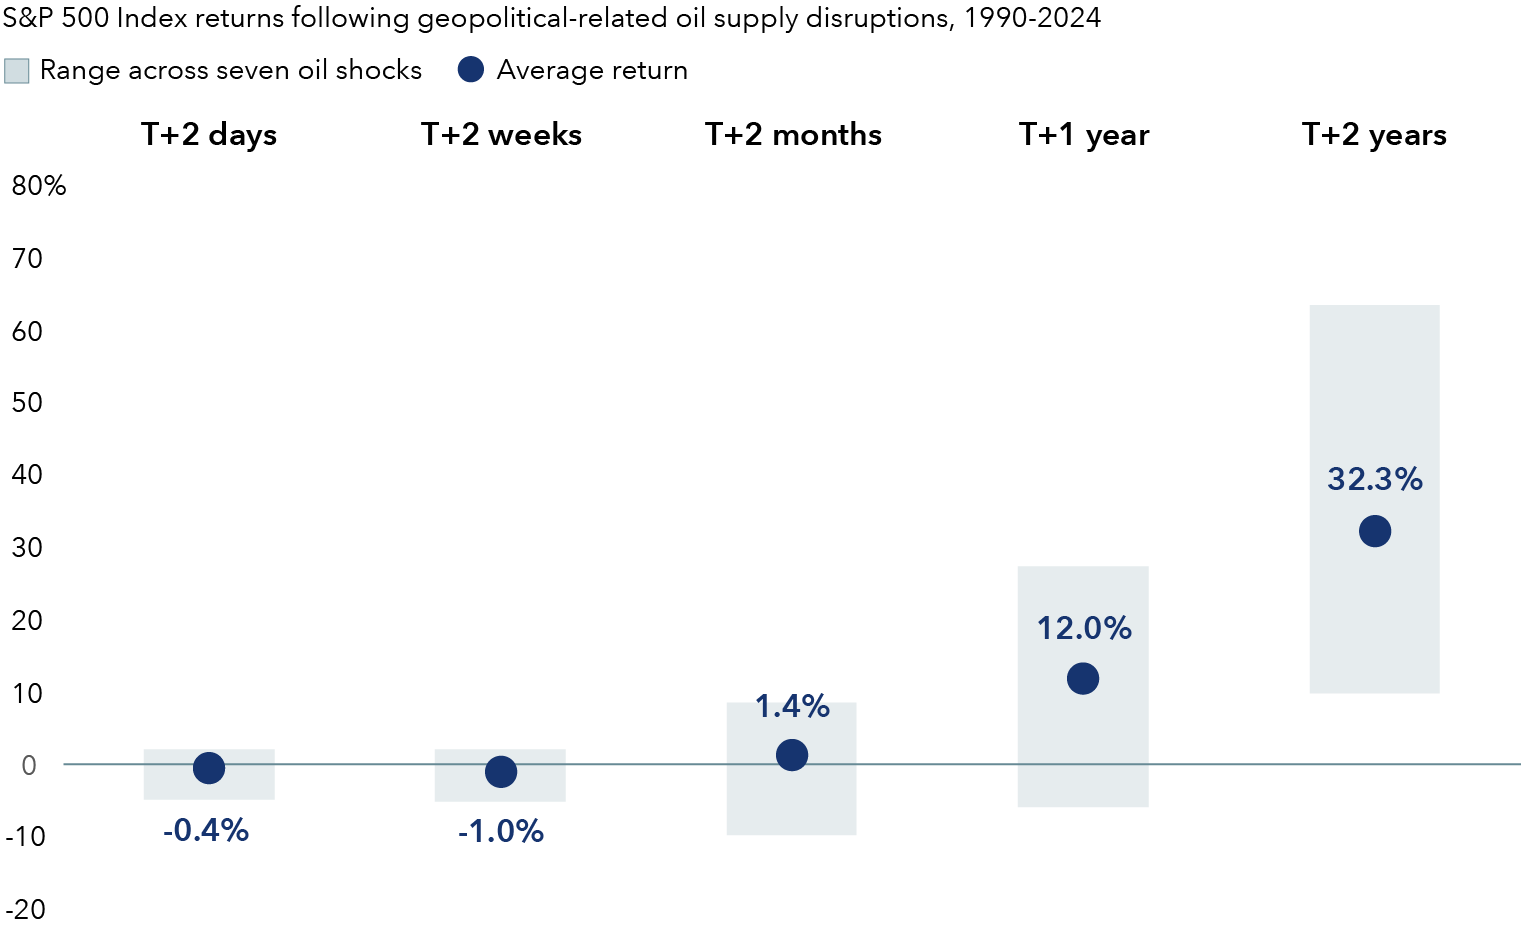
Sources: Capital Group, Bloomberg, Standard & Poor's. Specific geopolitical events that are reflected in average returns figures include: First Gulf War (August 1990), Second Gulf War (March 2003), Niger Delta supply disruptions (February 2006), Arab Spring and Libyan civil war (February 2011), Hormuz closure risk and Iran sanctions (December 2011), drone attack on Saudi oil stations (September 2019), Russian invasion of Ukraine (February 2022). Event dates are aligned to the nearest observable market price ("T"). If a shock occurs on a non‑trading day, the prior trading day is used as the start date. Horizon returns are measured using the first available trading day on or after the stated calendar horizon (e.g., "T+2 days"). Past results are not predictive of results in future periods. Figures reflect total returns. As of March 10, 2026.
Risks of a long war
The costs would only compound the longer the war drags on. “The Strait of Hormuz is a major choke point for not just oil and liquefied natural gas, but also for petrochemicals that feed into fertilizer supply chains, shipping, chemicals, mining and manufacturing. Beyond energy, cities in the region like Dubai and Doha serve as global nodes for capital flows, air travel and commercial freight.”
A widening conflict would trigger a classic risk-off response: higher oil prices, weaker equities, a stronger U.S. dollar, widening credit spreads, and a rally in sovereign bonds as investors seek safety. “In more extreme cases, if oil prices rise enough to materially slow demand, the dynamic can shift toward stagflation, characterized by higher near-term inflation followed by weaker growth,” Khan continues.
Europe is among the most vulnerable advanced economies because it remains structurally dependent on imported energy. A sustained rise in oil prices would lift headline inflation relatively quickly and complicate the European Central Bank’s policy path, particularly if growth remains subdued. Japan is also highly sensitive due to its reliance on imported energy and the importance of exchange rates.
“In the U.S., oil at $120 a barrel would be enough to cut GDP growth by 1.5 percentage points to around 1% or less,” Franz adds. “This would also likely lead to a global energy-induced recession.”
A manageable shock, for now
The Iran conflict presents a major but still manageable risk to the global economy — if it does not extend significantly in duration or scope, Franz notes. “The upcoming midterm elections and downside risks to the economy could limit President Trump’s tolerance for a prolonged war.”
There is no single global outcome, Khan believes. Some economies, such as the United States and parts of Latin America, are relatively insulated due to domestic energy production. Others — including Europe, Japan and much of Asia — are more exposed to sustained price increases and supply chain interruptions.
“Ultimately, the key question is how long the two clocks run. If the political timeline forces an earlier resolution, economic damage may remain limited,” Khan says. “If not, investors should prepare for a period of higher energy prices, slower growth and persistent volatility.”
S&P 500 Index is a market capitalization-weighted index based on the results of approximately 500 widely held common stocks. The index is unmanaged and, therefore, has no expenses. Investors cannot invest directly in an index.
The S&P 500 Index is a product of S&P Dow Jones Indices LLC and/or its affiliates and has been licensed for use by Capital Group. Copyright © 2026 S&P Dow Jones Indices LLC, a division of S&P Global, and/or its affiliates. All rights reserved. Redistribution or reproduction in whole or in part is prohibited without written permission of S&P Dow Jones Indices LLC.
Our latest insights
-
-
Global Equities
-
Target Date
-
Demographics & Culture
-
Economic Indicators
RELATED INSIGHTS
-
Economic Indicators
-
Artificial Intelligence
-
Economic Indicators
Don’t miss out
Get the Capital Ideas newsletter in your inbox every other week