Emerging Markets
 Arthur Caye
 Brad Freer
 Kent Chan
Get the latest report on emerging markets
Don't miss our latest insights.
Our latest insights
-
-
Artificial Intelligence
-
Artificial Intelligence
-
Interest Rates
-
World Markets Review
- Emerging markets stocks may be entering a longer term rebound, supported by stronger fundamentals and attractive valuations.
- EM tech leaders are becoming key players in the global AI value chain.
- Korea and China offer opportunities, though selectivity remains important.
- Resource-driven markets may benefit from AI-related infrastructure demand and stronger commodity cycles.
Often taking a backseat to U.S. equities, emerging markets have begun outpacing the S&P 500 Index in recent years, marking a notable shift for an asset class long overlooked by a broader investor base.
Once largely commodity- and export-driven, today’s EM universe has evolved into more technologically advanced, globally competitive and financially stronger companies. Many regions now have greater exposure to healthcare, domestic manufacturing and other innovation-driven industries, supporting a more durable earnings and growth trajectory over the long term.
Markets tend to move in long cycles, and we may be in the early innings of a longer term rebound for emerging markets, particularly amid heavy concentration in U.S. tech giants. Over a three-year horizon, the MSCI Emerging Markets Index has advanced 90% on a cumulative return basis, compared with 76% for the S&P 500, and has continued to surpass U.S. equities in 2026.

Source: FactSet. As of June 24, 2026.
Even modest reallocations from U.S.-dominated portfolios could have a meaningful impact on EM equities, given their relatively smaller weight in globally diversified portfolios and their high sensitivity to capital flows due to lower liquidity in emerging markets. Below, we highlight some earnings and regional dynamics at hand.
Meet the Emergent Seven
Akin to the Magnificent Seven stocks in the U.S., the seven largest companies by adjusted market capitalization in the MSCI EM Index are all technology-oriented and collectively account for approximately 33% of the index. Some Capital Group investment professionals have started referring to these firms as the “Emergent” Seven.
While they generally have smaller market capitalizations and lower valuations than their U.S. counterparts, they are nonetheless critical participants in the global tech value chain. Well-known names include Taiwan Semiconductor Manufacturing Co., Samsung Electronics, SK Hynix, Alibaba, and Tencent, alongside somewhat less prominent firms such as MediaTek and Delta Electronics.
With valuations still compressed and earnings revisions turning decisively positive, particularly in technology, emerging markets appear increasingly positioned for a re-rating. However, building a resilient portfolio requires diversification to withstand volatility and any potential slowdown in semiconductors strength.
Earnings growth is expected to increase across EM sectors
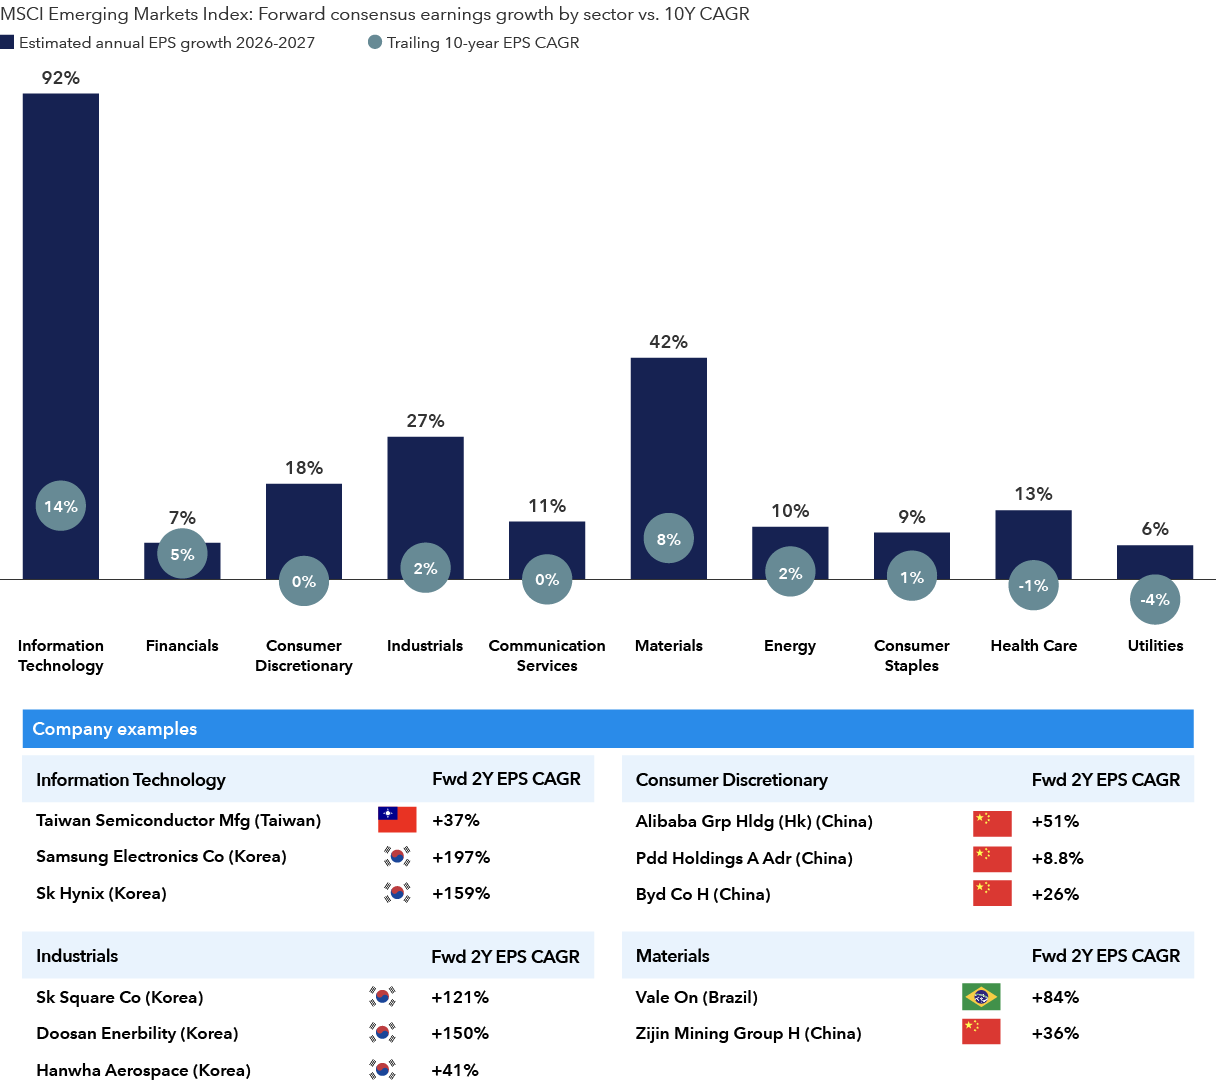
Sources: Capital Group, FactSet, RIMES. Forward earnings growth is based on average consensus estimates aggregated by FactSet. EPS = earnings per share. CAGR = compound annualized growth rate. Company examples all fall within the top five largest companies across their respective sectors within the MSCI Emerging Markets Index and are for illustrative purposes only. As of June 12, 2026.
For context, the U.S. market is beginning to show improved breadth and greater dispersion. A similar dynamic could develop among the Emergent Seven.
Magnificent Seven members Meta and Microsoft have lagged this year, underscoring that market leadership can shift even as AI remains the dominant growth theme. Investments in emerging market AI leaders should therefore be balanced with other opportunities across other sectors to build a well-diversified portfolio that can endure volatility and varying stock performance.
Korea’s allure extends beyond corporate reforms
Members of our investment team recently traveled to South Korea to see firsthand how structural changes continue to gain traction.
Improved corporate governance and capital allocation practices stemming from the Korean government’s ongoing Value-Up Program are helping to narrow valuation discounts and attract incremental foreign investment. We’re also seeing a stronger commitment to meeting return on equity targets and enhancing dividend frameworks.
However, Korea’s value proposition has evolved beyond Value-Up and a narrow semiconductor story. Korea is home to a range of companies benefiting from trends in defense, liquefied natural gas, shipbuilding, power infrastructure and AI-related capital expenditures. Many of these firms operate with cost advantages relative to peers in Europe and North America.

Sources: Capital Group, FactSet. Forward price‑to‑earnings is calculated as the harmonic mean of constituent P/E ratios, derived from adjusted market‑cap‑weighted earnings yields based on consensus next twelve‑month estimates. As of May 29, 2026.
Korea could benefit from global supply chain and trade realignments, given its role as a key provider of advanced technologies across multiple industries. As production networks shift, Korean firms are increasingly embedded in U.S.-aligned supply chains and benefiting from associated investment and policy support.
At the same time, Korean companies retain competitive positioning in value-added segments, where strong manufacturing capabilities and technological depth can offset narrowing cost advantages versus Chinese peers.
China’s competitive moats are intact, but caution is warranted
While the MSCI China Index has lagged the broader EM universe in 2026, particularly Korea and Taiwan, greater emphasis on shareholder returns and capital discipline has supported a recovery in profitability among several Chinese companies, especially within the technology sector and export-oriented industries.
Developments in AI are helping China narrow the gap with U.S. firms, while pharmaceuticals and robotics remains key areas of innovation. Beyond tech, companies in sectors such as construction and machinery are shifting their revenue mix to stabilize margins and reduce risk.
Moreover, Chinese firms are finding ways to expand globally despite trade realignments. For example, electric vehicle maker BYD steadily increased its overseas vehicle sales in recent years. Meanwhile, battery manufacturer CATL holds the top spot in global market share at around 40%, despite significant capacity additions from competitors, demonstrating this theme.
Still, China’s transition toward a more innovative, value-added and consumption-driven domestic economy remains a complex and gradual process. The housing recovery is uneven, while wage growth and consumer sentiment remain soft. A cautiously optimistic stance is warranted.
Stronger commodity cycle bolsters resource-driven economies
Commodity exposure offers more than cyclical upside. It can provide differentiated access to the infrastructure layer of AI, or the so-called second-order effects of the global AI build-out. Sustained capital expenditure for AI may drive incremental demand for power generation, transmission and resource-intensive inputs such as copper, iron ore and liquefied natural gas. One example is the strong growth in copper foil exports from Malaysia to markets including China, Taiwan and Japan.
Years of underinvestment in energy, materials and capital equipment could further amplify this effect, tightening supply and reinforcing pricing power for resource-oriented companies. Exporters of crude oil and iron ore, such as Brazil, offer companies with attractive valuations. Brazil may see renewed capital inflows, especially as election uncertainty settles, while borrowing costs, after adjusting for inflation, should gradually decline from elevated levels over time.
Selectivity remains critical across Latin America due to ongoing political risks, varying economic conditions and currency volatility.
Bottom line
Taken together, these dynamics point to a structural shift across EMs. Stronger corporate fundamentals, varying AI exposure, supply-chain realignment and a weaker U.S. dollar relative to recent years are all helping reshape the opportunity set beyond traditional cyclical drivers.
While volatility and risks remain, including uneven growth trajectories and geopolitical uncertainty, the combination of attractive valuations, and accelerating and broadening earnings profiles suggests a potentially more durable foundation for returns. For investors, this reinforces the case for a more deliberate and selective approach.
Past results are not predictive of results in future periods.
Investing outside the United States involves risks, such as currency fluctuations, periods of illiquidity and price volatility, as more fully described in the prospectus. These risks may be heightened in connection with investments in developing countries.
S&P 500 Index is a market capitalization-weighted index based on the results of approximately 500 widely held common stocks.
MSCI China Index captures large- and mid-cap representation across China A shares, H shares, B shares, Red chips, P chips and foreign listings (e.g. ADRs).
MSCI Emerging Markets Index captures large- and mid-cap representation across emerging markets (EM) countries.
The Magnificent Seven stocks consist of Alphabet, Amazon, Apple, Meta, Microsoft, NVIDIA and Tesla.
South Korea’s Corporate Value-Up Program was launched by Korea’s Financial Services Commission to improve capital efficiency and corporate governance among listed companies, while also seeking to narrow the valuation discount of Korean equities relative to global peers.
RELATED INSIGHTS
-
World Markets Review
-
Emerging Markets
-
Never miss an insight
The Capital Ideas newsletter delivers weekly insights straight to your inbox.