Target Date


- Concentration risk has increased as market leadership narrows.
- Active stock selection can provide a more differentiated approach to diversification.
- Target date funds can tailor equity exposures to specific investor objectives.
Many target date fund investors could be less diversified than they expect, as market capitalization-weighted index funds have become increasingly concentrated in the largest companies. The 10 largest companies now make up around 40% of the S&P 500 Index, a level not seen since the mid-1960s. In addition, many of those names are tied to the same investment theme – artificial intelligence – leaving portfolios vulnerable to stacked risks.
Market concentration risks have special relevance for target date funds, which should vary the equity risk profile based on investors’ objectives. Put simply, investors near and in retirement may need a different equity portfolio than younger investors with longer time horizons. Our target date funds’ “glide path within a glide path” approach is designed to do just that – in addition to adjusting the amount of equity, managers gradually shift the equity exposure over time from underlying funds with more volatile growth-oriented stocks to those with historically less-volatile dividend-paying stocks as investors age.
We also include fixed income, equity-income and balanced funds to help the target date funds pursue their objectives. Rather than simply changing the amount of equity in our funds, we seek to evolve the character of equity exposure as investors move from wealth accumulation toward retirement. This contrasts with many passive and active target date providers that reduce the amount of equity but leave the composition unchanged.

Martin Romo
Chair & Chief Investment Officer, Capital Group
“Although indexes are highly concentrated, this is not an argument against owning companies driving the artificial intelligence era. Many are extraordinary businesses with durable prospects. The point is that at today’s weights and valuations, benchmarks — and the passive strategies following them — increasingly assume one set of outcomes will dominate.
Historically, there have been moments when market leadership narrows around a compelling view of the future. Sometimes that view is right. Sometimes it is partly right but valued to perfection. And sometimes the greatest beneficiaries are not the ones investors expect.”
Portfolio managers should “pick their spots”
Importantly, the answer isn’t to simply avoid AI-related stocks. Many of the companies driving today's market leadership are exceptional businesses with durable growth prospects. As such, target date funds should not overlook underlying funds that invest in these companies, but rather size exposures appropriately for investors’ objectives at each stage of the glide path. Active management in our underlying funds allows portfolio managers to participate in areas of innovation while avoiding the assumption that today's largest companies will necessarily be tomorrow's biggest winners.
The underlying funds in our target date series reflect Capital Group investment professionals’ highest convictions – holding greater-than-index exposure in some companies and less in others. In this manner, the vintages seek to participate in areas of innovation and growth while managing unintended concentration risks that may be present in indexes.
Although vintages for investors moving into and already in retirement may maintain exposure to many of the market’s largest AI-related companies, position sizes are generally a smaller component of the equity allocation than in our vintages further from retirement to help manage that risk. In addition, index construction does not account for investor risk tolerance, actively managed funds can appropriately adjust holdings to pursue their objectives, which are often consistent with investor goals. Our target date funds seek to achieve the following objectives to varying degrees: growth, income and conservation of capital. Portfolio exposures vary depending on the proximity to their target dates. They are designed to align with the goals and risk profiles of investors as they approach and move through retirement. As such, some of the in-retirement vintages’ largest positions may be in higher dividend-paying areas outside tech – such as consumer staples and health care.
A target date series with active underlying funds can pick its spots
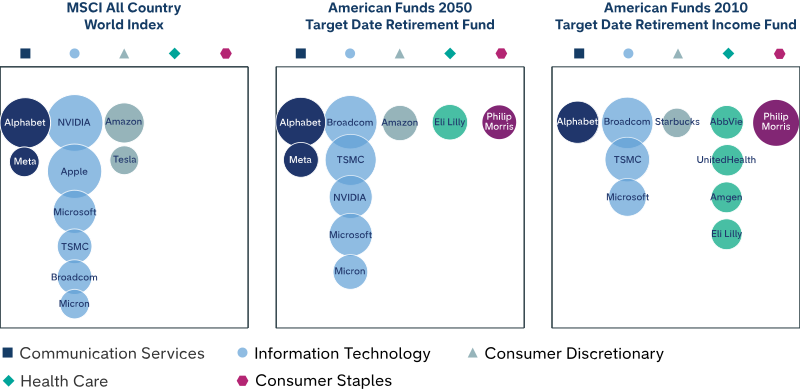
Source: Capital Group, MSCI. Data as of June 30, 2026. Chart shows top-10 holdings by portfolio. Bubble size corresponds to % of total equity in each portfolio.
Align sector exposures to the portfolio’s intended risk profile
Market concentration is not limited to individual companies. It can also create unintended sector, industry or thematic exposures that may not be appropriate for every investor cohort. For portfolios prioritizing capital appreciation, greater exposure to growth-oriented companies, many of which are currently found within the information technology sector, can be appropriate. In portfolios designed for investors approaching and entering retirement, greater emphasis on established dividend-paying companies can result in increased exposure to historically more defensive, less volatile areas such as consumer staples and utilities. Our target date series reflects this approach.
Diversify by aligning sector exposures to the portfolio’s intended risk profile
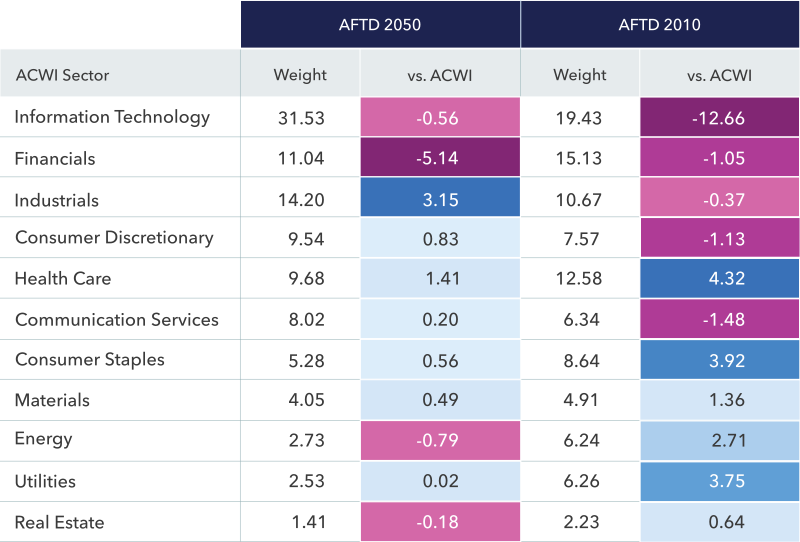
Source: Capital Group, MSCI. Data as of June 30, 2026. ACWI = MSCI All Country World Index. AFTD = American Funds Target Date Retirement Series
Putting it all together
Rising equity market concentration reinforces the need to calibrate equity exposure to investors’ changing risk and return needs throughout the glide path, particularly for those transitioning from saving for retirement to living in retirement. In our target date series, the makeup of the equity exposure shifts across vintages. In portfolios designed for investors moving closer to and through retirement, dividend yield increases and equity beta decreases.
Equity portfolio characteristics

Source: FactSet. Data as of June 30, 2026. The portfolio characteristics are based only on the equity investments and exclude all investments in cash, forward contracts and fixed income securities and may not reconcile due to rounding. The dividend yield is based only on the equity investments in the portfolio as calculated by FactSet. It does not reflect distributions paid by the fund. Security level fundamental data are sourced from various databases in the following order: MSCI, Worldscope and Reuters. The index characteristics are calculated by FactSet based on the underlying securities of the index. The characteristics are generally aggregated based on the weighted average methodology. The inverse interquartile methodology is applied to the characteristics (where applicable) to exclude extreme outliers at the aggregated statistic level. Index figures may differ from the officially published data for index providers who do not apply this methodology. Capital Group (“CG”) believes the software and information from FactSet to be reliable. However, CG cannot be responsible for inaccuracies, incomplete information or updating of the information furnished by FactSet. This information provided in this report is meant to give you an approximate account of the funds’ equity characteristics for the specified date. This information is not indicative of future CG investment decisions and is not used as part of our investment decision-making process. Equity beta measures how sensitive a stock or stock portfolio has historically been to movements in a market index. Custom indexes for the American Funds Target Date Retirement Series were established by Capital Group. They are based on a combination of the S&P 500 Index (representing U.S. equity), MSCI ACWI ex USA (representing non-U.S. equity) and Bloomberg U.S. Aggregate Index (representing bonds). The custom index weights were calculated based on an analysis of the 10-year monthly average asset class exposure (as of December 31, 2014) of the underlying American Funds that comprise the target date series. (For underlying funds with less than 10 years of history, lifetime asset-allocation averages were used.) Custom index returns were based on the weighted returns of the three indexes.
This material must be preceded or accompanied by a prospectus or summary prospectus for the American Funds Target Date Retirement Series.
Capital Group’s glide path within a glide path approach is designed to tailor equity exposure to investors’ evolving objectives over time. For plan sponsors and financial professionals, today’s market also provides a timely reason to look beyond headline stock-and-bond allocations and consider evaluating the underlying company, industry and geographic exposures across the glide path as part of the selection and monitoring process.
When evaluating a target date series, consider how it handles concentration risk and whether the approach aligns with the investors’ investment objectives. Our series’ thoughtful top-down “glide path within a glide path,” which considers both the amount and type of equity in a portfolio, and our flexible bottom-up tactical approach continue to differentiate it within the industry.
Active security selection has also historically been a key source of that differentiation, helping shape both portfolio exposures while serving as important contributor to excess return over the life of the series. The quality of a target date series’ building blocks, or underlying funds, is incredibly important. Allocating to funds that can generate even modest amounts of consistent excess return through active management over long periods can contribute meaningfully to investor outcomes and retirement wealth.
Our latest insights
-
Defined Contribution
-
-
-
Regulation & Legislation
-
Asset Allocation
Index definitions:
S&P 500 Index is a market-capitalization weighted index based on the results of approximately 500 widely held common stocks.
MSCI All Country World Index (ACWI) is a free-float-adjusted market-capitalization-weighted index that is designed to measure equity market results in the global developed and emerging markets. The index consists of more than 40 developed and emerging-market country indexes.