Defined Benefit
Categories
Japan
Japanification: A not-so-remote — or bleak — possibility
 Anne Vandenabeele
June 9, 2020
KEY TAKEAWAYS
- A prolonged period of low rates and low growth raises the prospect of the U.S. and European economies looking like Japan’s in some ways.
- Crisis-era policies aimed at avoiding “Japanification” may actually bring it about if maintained for too long.
- Despite its challenges, some of Japan’s economic attributes can make it an attractive example for policymakers.
- If the U.S. and other developed economies follow Japan, investors could see persistently low yields and a compression of multiples.
- Even across decades of stagnation, Japan has produced long-term investment opportunities and will likely continue to do so. Fundamental, bottom-up stock selection will continue to be critical.
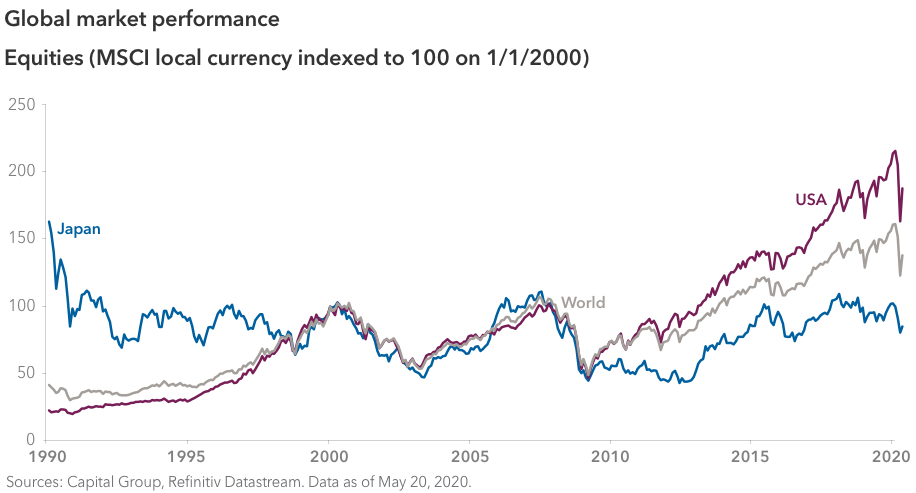
Is the U.S., and much of the developed world, headed the way of Japan — a world of low growth, low rates and deflation? It’s a question that has been raised with some regularity since interest rates began their relentless descent a decade or so ago.
Now, in the face of the global economic crisis brought on by COVID-19, central bank intervention in the U.S. and Japan is at unprecedented levels. Fiscal stimulus is at a scale not seen since World War II. And the possibility of the “Japanification” of the U.S. and other developed economies is as real as ever before.
In the past, the argument against the U.S. following Japan’s precedent has been that the U.S. benefits from a much younger population, a more flexible labor market and a dynamic economy that provides much easier access to credit for small enterprises to flourish. But now, the similarities between the economies are starting to outweigh the differences.
An unintended consequence of crisis policies
In response to the current crisis, massive stimulus is exactly what economies need. But if maintained for too long, private sector attitudes could change in ways that promote low growth and deflation. Banks, firms and households could retrench. In short, crisis policies aimed at avoiding Japanification could end up steering us in that direction.
- Central banks are already asymmetrical in their monetary policy. They tend to ease aggressively during crises while failing to lean against financial and re-leveraging cycles. These easing measures are difficult to unwind, so this trend is likely to continue and the “debt trap” will likely grow.
- Zero rates enable the public sector to grow its balance sheet to absorb the demand shock and related losses. In the extreme, fiscal and monetary policy could become unified, and rates markets would disappear, as advocated in Modern Monetary Theory, or MMT. Japan is arguably well on its way down this path, with the Bank of Japan holding 44% of Japanese government bonds.
- The duration of the accommodation and its role in creating zombie companies are also important. While it’s critical for businesses, especially small- and medium-sized enterprises (SMEs), to receive lifelines in the short term, low rates and various forms of extended accommodation may potentially keep alive businesses that should otherwise fold.
- Private sector behavior can change permanently with protracted easing. For example, extended periods of low rates can allow companies on the borderline of failure to survive on cheap market financing. Meanwhile, bank profitability would weaken, resulting in less credit creation (especially for SMEs) and lower productivity. Households earning zero or negative rates would also be incentivized to save more. And all of this would contribute to a deflationary mindset.
Despite higher starting growth rates, this crisis and the prolonged easing that will likely follow could result in the U.S. and other developed markets looking progressively more like Japan.
Could Japanification bring benefits?
In some ways, resembling Japan may not be such a bad thing. To be sure, Japan could adopt more market-based policies in many areas and work toward more flexible labor markets. But it has many positive attributes. Japan is wealthy, its unemployment rate is among the lowest in the world and it enjoys relatively low income inequality.
There is much to admire in Japan’s corporate sector as well. As compared with its Western counterparts, it may be perceived as more resilient and benevolent. And many of its practices may be appealing to policymakers, such as:
- Higher cash levels, which serve to improve resilience
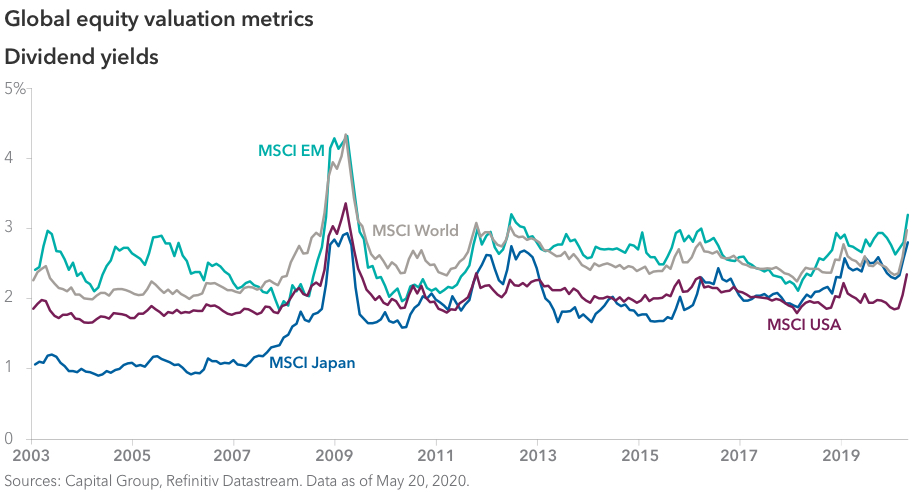
- More sustainable dividend and buyback policies
- Its embrace of stakeholder capitalism, with a focus on the principle Sanpō yoshi, or three-way satisfaction between seller, buyer and society — especially employees
- More evenly distributed compensation schemes, with a significantly smaller pay gap between CEOs and average workers as compared with the U.S. and many other developed countries
While U.S. corporations would likely be resistant to these practices, adopting them could be popular politically. Governments could implement them directly, by rescuing industries, as we have seen to some extent in the U.S., or nationalizing them, as we have seen in some cases in France. Or the practices could be adopted indirectly, through regulation.
The amount of additional government intervention a country experiences — in the form of government spending, redistribution and regulation — should become clearer with each election. However, the pendulum appears to be swinging toward some implementation of MMT principles. Japan’s version is based on the “three arrows” of monetary easing, fiscal stimulus and more orthodox structural reform. This approach has led to the stabilization of a debt burden that Japan largely owes itself, as the central bank is the biggest single owner of Japanese government bonds. Over time, it could lead to improved growth expectations, confidence and gentle reflation.
If, unlike in Japan, a government’s spending and monetization are excessive (i.e., beyond a country’s productive capacity), it could lead to high nominal growth and rapid inflation in the long run. This could cause domestic problems, as well as external ones for countries without reserve currency status or the ability to offset foreign exchange movements. The U.K., Australia and Canada are perhaps most at risk among developed markets.
Implications for inflation and corporate earnings
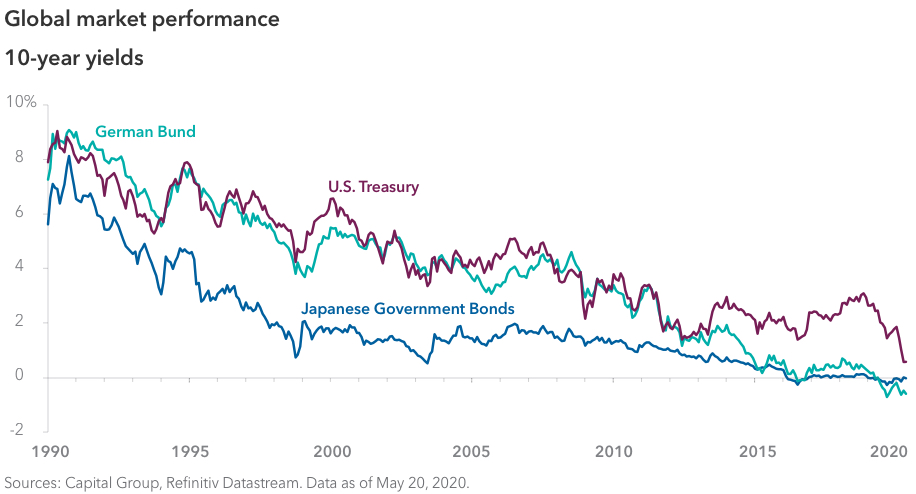
If the U.S. and other developed markets move in the direction of Japanification, investors should expect prolonged low rates, with U.S. 10-year Treasury yields of 0% to 1% for several years. The inflation outlook would be more uncertain, and it would be increasingly driven by the size of government spending and intervention:
- Near term – Mismatched demand and production policies in the wake of COVID-19 could accelerate goods inflation.
- Medium term – A slow recovery and persistently low interest rates could create Japan-like deflationary pressures.
- Long term – Meaningful and sustained government spending (unless it increases productivity) could raise the risk of rapid inflation, along with foreign exchange depreciation for some countries.
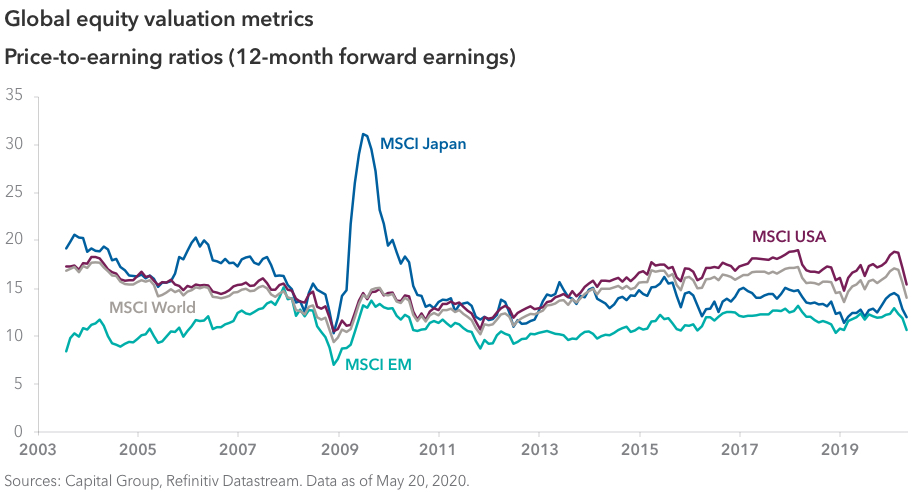
Equity multiple compression is also likely:
- If Japan-like deflationary conditions are allowed to persist, price-earnings multiples could resemble Japanese equity valuations, which range from 13 to 15.
- Policies are more likely to suppress values of risk assets such as equities rather than erode their value through inflation.
- Expect to see greater dispersion of multiples — Japan’s is twice as high as the U.S. — as high-growth companies in less regulated industries command a premium, as will companies with oligopolistic pricing power.
What about investing in Japan?
Even across decades of stagnation, Japan has produced many strong investment opportunities, and it should continue to deliver value.
- The long-term winners have been companies with comparative advantage, such as high-end manufacturing processes, or companies with unique technology franchises in areas such as precision machinery, autos, pharmaceuticals and chemicals. Some examples are electronics manufacturers Keyence, Nidec and Tokyo Electron; machinery manufacturers SMC and Murata; and chemical company Shin-Etsu.
- In the middle are exporters and global companies, as Japan’s growth has lagged global growth. Examples are automakers Toyota, Honda and Suzuki; heavy equipment manufacturer Komatsu; and electrical equipment manufacturer Daikin.
- There have been exceptions to the global phenomenon, and there are some domestic companies that have done better than the market by virtue of disrupting existing business models, gaining a large market share or being able to compound earnings at a faster rate than the market average. These have included consumer staples companies Kao, Unicharm and Asahi Group and retailers Nitori, Fast Retailing and Seven & i.
- The long-term laggards are in areas that are tied either to past crises or to asset price and yield compression. Construction, iron and steel, and real estate have been in a long-term decline. Meanwhile, financials — and especially the banking industry — accounted for most of the long-term fall.
That is not to say that other countries’ economies will follow this pattern. Each nation’s economy and market has its own dynamics. The U.S. has a much more entrepreneurial culture — one that has seen the rise of technology giants that make up almost a quarter of the market capitalization as represented by the S&P 500 Composite Index. But there are also areas such as the financials sector that are becoming so highly regulated that prospects for corporate profitability have been significantly dampened.
Investors should expect to see a greater dispersion of company valuation and be wary of value traps. Fundamental, bottom-up stock selection will continue to be critical in this environment.
Learn more about
Standard & Poor’s 500 Composite Index is a market capitalization-weighted index based on the results of approximately 500 widely held common stocks. Standard & Poor’s 500 Composite Index (“Index”) is a product of S&P Dow Jones Indices LLC and/or its affiliates and has been licensed for use by Capital Group. Copyright © 2020 S&P Dow Jones Indices LLC, a division of S&P Global, and/or its affiliates. All rights reserved. Redistribution or reproduction in whole or in part is prohibited without written permission of S&P Dow Jones Indices LLC.
Investing outside the United States involves risks, such as currency fluctuations, periods of illiquidity and price volatility, as more fully described in the prospectus. These risks may be heightened in connection with investments in developing countries.
MSCI USA Index is a free float-adjusted, market capitalization-weighted index that is designed to measure the U.S. portion of the world market.
MSCI Emerging Markets Index is a free float-adjusted market capitalization weighted index that is designed to measure equity market results in the global emerging markets, consisting of more than 20 emerging market country indexes.
MSCI World Index is a free float-adjusted market capitalization weighted index that is designed to measure equity market results of developed markets. The index consists of more than 20 developed market country indexes, including the United States.
MSCI Japan Index is a free float-adjusted market capitalization-weighted index that is designed to measure the equity market results of Japan.
MSCI has not approved, reviewed or produced this report, makes no express or implied warranties or representations and is not liable whatsoever for any data in the report. You may not redistribute the MSCI data or use it as a basis for other indices or investment products.
Our latest insights
-
-
U.S. Equities
-
Economic Indicators
-
Market Volatility
-
Asset Allocation
RELATED INSIGHTS
-
Interest Rates
-
-
Economic Indicators
Investments are not FDIC-insured, nor are they deposits of or guaranteed by a bank or any other entity, so they may lose value.
Investors should carefully consider investment objectives, risks, charges and expenses.
This and other important information is contained in the prospectuses and summary prospectuses, which can be obtained from a financial professional and should be read carefully before investing.
Statements attributed to an individual represent the opinions of that individual as of the date published and do not necessarily reflect the opinions of Capital Group or its affiliates. This information is intended to highlight issues and should not be considered advice, an endorsement or a recommendation.
All Capital Group trademarks mentioned are owned by The Capital Group Companies, Inc., an affiliated company or fund. All other company and product names mentioned are the property of their respective companies.
Use of this website is intended for U.S. residents only.
Capital Client Group, Inc.
This content, developed by Capital Group, home of American Funds, should not be used as a primary basis for investment decisions and is not intended to serve as impartial investment or fiduciary advice.
Statements attributed to an individual represent the opinions of that individual as of the date published and do not necessarily reflect the opinions of Capital Group or its affiliates. This information is intended to highlight issues and should not be considered advice, an endorsement or a recommendation.