Emerging Markets
 Saurav Jain
 Lisa Thompson
 Kent Chan
Emerging markets (EM) are on track for their strongest annual return since 2017, driven by a weaker U.S. dollar and a global rotation into non-U.S. stocks. As we look ahead to 2026, can the rebound continue? Several catalysts — from accelerating earnings growth to AI-driven demand — suggest the outlook is promising.
For an asset class that has long been out of favor, it would be a welcome sign. For 15 years, emerging markets, as measured by the MSCI Emerging Markets Index, have trailed global benchmarks like the S&P 500 Index and MSCI World Index by a wide margin. Among the reasons: slowing growth in China, a strong U.S. dollar and the dominance of U.S. tech companies.
Today, the picture is shifting in a more positive direction for emerging markets. After strong gains this year, here are key factors that could drive further interest.
Emerging markets have outpaced U.S.
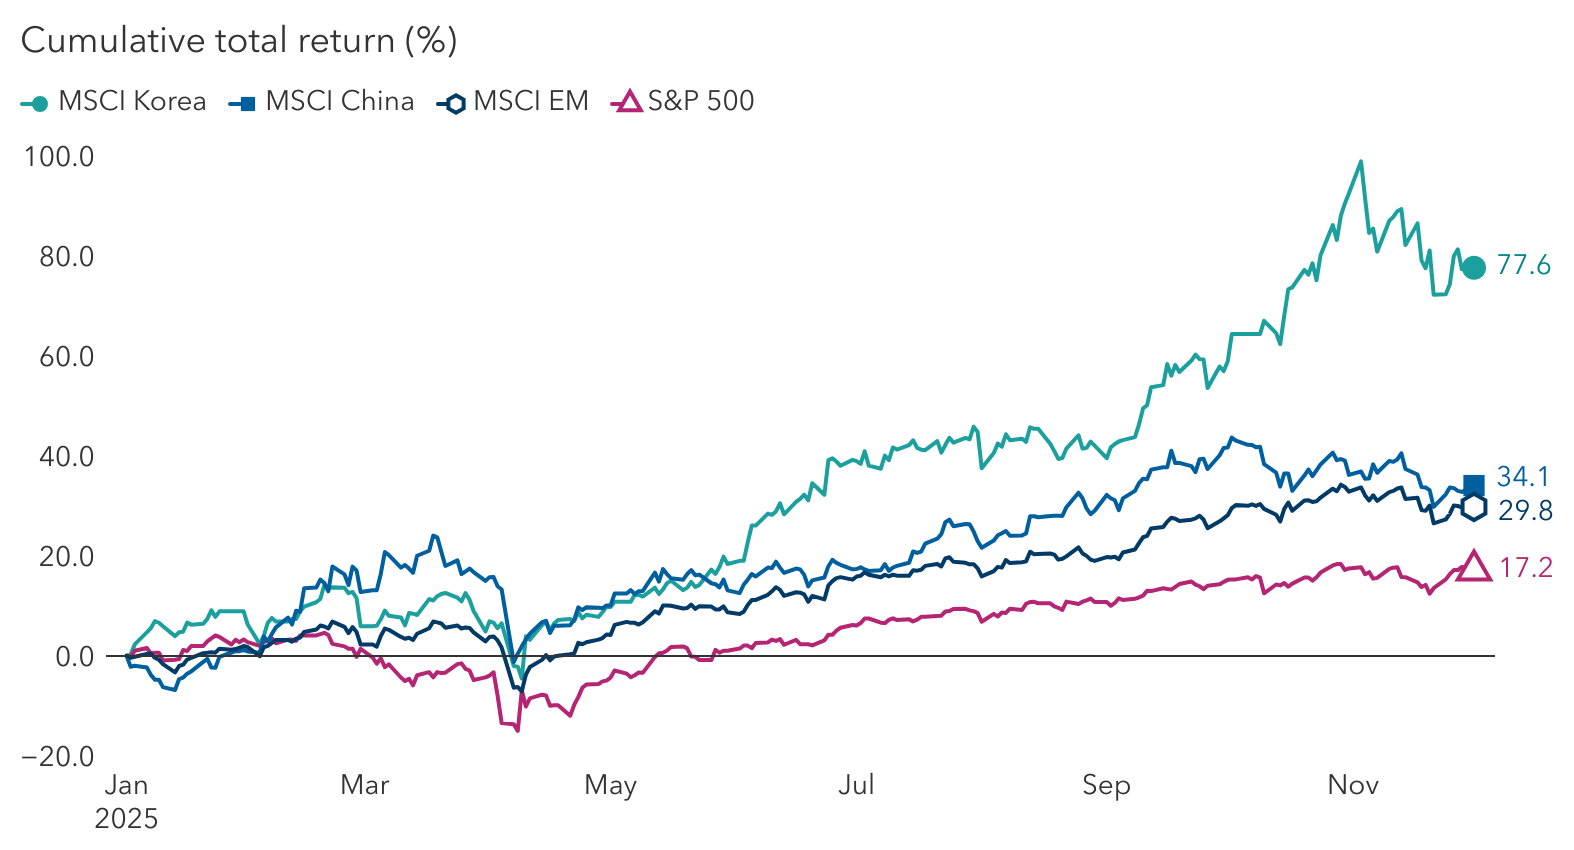
Sources: MSCI, RIMES, S&P Dow Jones Indices LLC. Data as of December 1, 2025.
1. Earnings growth and rate cuts appear promising
For starters, earnings growth across most emerging markets appears promising, with four of the five countries that make up 80% of the MSCI Emerging Markets Index projected to increase profits at a double-digit rate year over year.
Central banks in many EM countries are poised to cut interest rates, which may benefit returns in those local equity markets. Inflation is under control, and in some countries, inflation is much lower than in developed markets.
Additionally, many EM economies maintain current account surpluses, whereas some developed markets, notably the U.S., run deficits. This dynamic could strengthen EM currencies over the medium term.
EM earnings growth set to accelerate
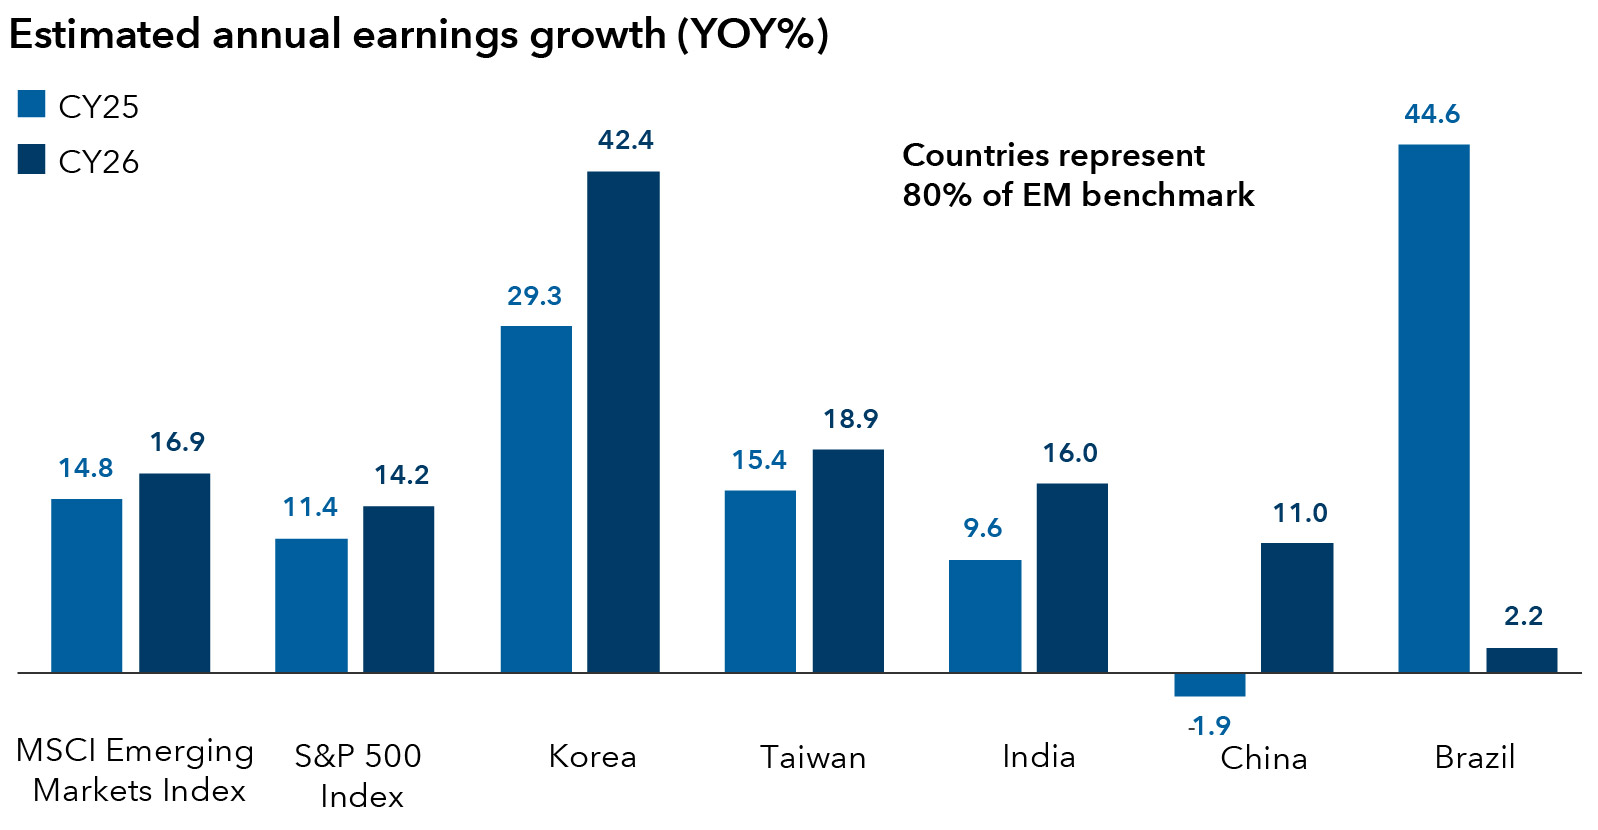
Sources: FactSet, MSCI. Countries are represented by their respective MSCI index. EM benchmark = MSCI Emerging Markets Index. Data as of November 28, 2025.
2. EM companies are key suppliers in global AI race
When it comes to the hundreds of billions of dollars being spent to build AI data centers, leading technology companies in emerging markets are direct beneficiaries.
Taiwan’s TSMC, for example, dominates advanced chip manufacturing, while Korea’s SK Hynix leads in high-bandwidth memory chips essential for AI servers. There are risks, however. If AI spending cools, the tech-heavy EM benchmark could face headwinds, especially if order volumes decline.
Beyond AI, EM firms supplying raw materials, semiconductors and industrial automation tools stand to benefit from supply chain realignment and new manufacturing investments worldwide. Rising global defense spending could also boost demand for Korean shipbuilders and defense equipment makers.
3. Reforms to improve corporate profitability
Across Asia, a wave of regulatory-driven initiatives is reshaping corporate behavior. These initiatives, aimed at improving profitability, boosting return on equity, and divesting noncore assets, could help boost valuations and stock prices.
Korea is a prime example. Our research shows at least 150 Korean companies since February 2024 have filed multi-year plans promising tighter capital discipline, bigger cash returns and clearer growth stories. Similar programs are underway in China, Taiwan and southeast Asia, creating fertile ground for active investors.
4. China reengineers growth model
Several years ago, many wondered if China was uninvestible after a government crackdown on private sector firms sparked a sharp selloff in Chinese stocks. Making matters worse, China’s property market — a key driver of GDP growth and personal wealth — was saddled with too much debt, hurting consumer spending.
The picture is not as dire as once believed, which may bode well. China is an influential part of the MSCI Emerging Markets Index, making up 31% of the weighting.
For one, the macro environment is slowly improving. Government officials seek to blunt deflation by shuttering inefficient manufacturing capacity and taming hyper price competition in certain industries. The party’s policy direction is also evolving. There’s greater emphasis on high end manufacturing and leveraging AI to bolster the economy. Meanwhile, there’s been a de-escalation in the ongoing trade and technology conflict with the U.S., adding to a more positive backdrop.
China’s technology sector is thriving again, boosted by the emergence of AI startup DeepSeek and supportive government policies to encourage entrepreneurs. Plus, China’s tech giants are flush with cash to fuel growth plans for AI and other ventures.
China tech giants sitting on pile of cash
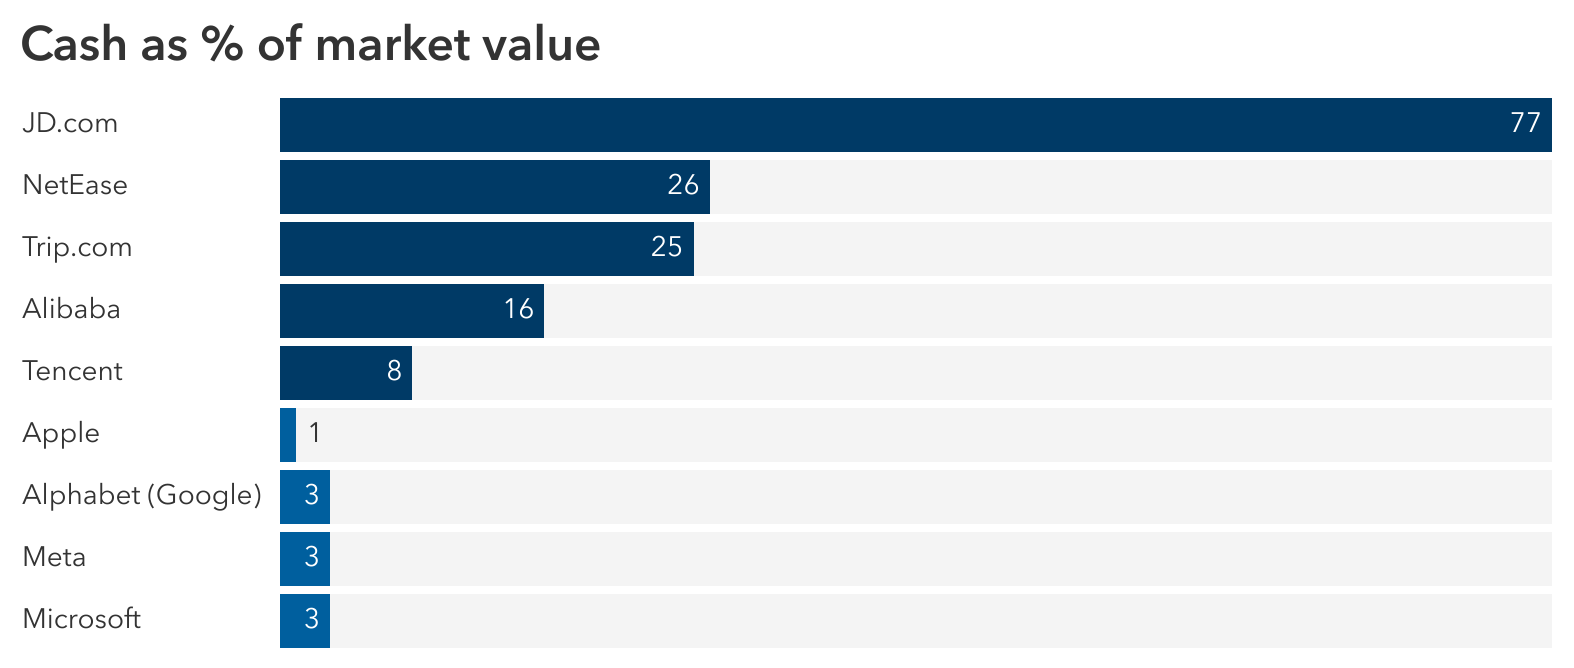
Source: FactSet. Data for cash and short-term investments is as of September 30, 2025. Market value as of November 30, 2025. U.S. companies (Apple, Alphabet, Meta and Microsoft) listed among largest by weight in the MSCI USA Index as of November 30, 2025.
5. Valuations offer room to run
Valuations have improved but EM trades at a significant discount to global peers.
Korea and Brazil, for instance, trade near their 10-year averages on a forward price-to-earnings basis. Multiples for China’s leading technology companies have recovered from historic lows but remain reasonable compared to U.S. counterparts. India’s valuations have moderated, aligning better with its strong demographic and growth profile.
EM trades at significant valuation discount to world
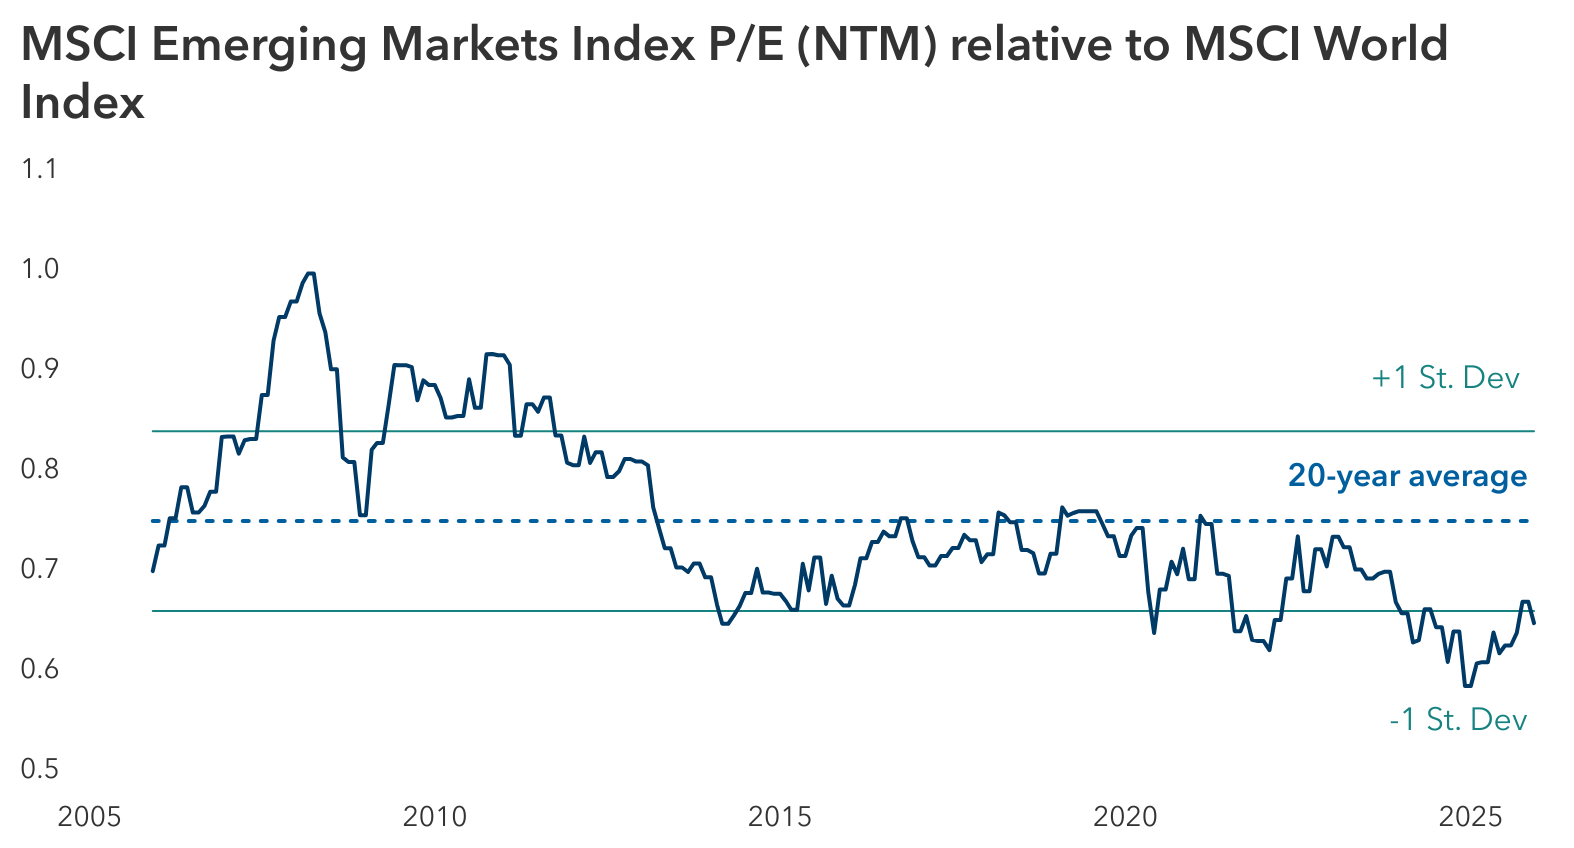
Sources: Capital Group, FactSet, MSCI. As of November 30, 2025. NTM = next twelve months. P/E = price-to-earnings.
A promising direction
Robust earnings growth, potential rate cuts and structural reforms across Asia should all bode well for emerging markets. With dollar strength abating, we think durable trends — such as reshoring of supply chains, corporate profitability reforms and the rapid development of AI – offer compelling opportunities for select EM companies.
Past results are not predictive of results in future periods.
MSCI Brazil Index is designed to measure the performance of the large- and mid-cap segments of the Brazilian market.
MSCI China Index captures large- and mid-cap representation across China A shares, H shares, B shares, Red chips, P chips and foreign listings (e.g. ADRs).
MSCI Emerging Markets Index is a free-float-adjusted market-capitalization-weighted index designed to measure equity market results across global emerging markets, consisting of more than 20 emerging markets country indexes.
MSCI India Index is designed to measure the performance of the large- and mid-cap segments of the Indian market.
MSCI Korea Index is designed to measure the performance of the large- and mid-cap segments of the South Korean market.
MSCI Taiwan Index is designed to measure the performance of the large- and mid-cap segments of the Taiwan market.
MSCI World Index captures large- and mid-cap representation across Developed Markets countries.
S&P 500 Index is a market capitalization-weighted index based on the results of approximately 500 widely held common stocks.
Don't miss our latest insights.
Our latest insights
-
-
Global Equities
-
U.S. Equities
-
Health Care
-
Chart in Focus
RELATED INSIGHTS
Don’t miss out
Get the Capital Ideas newsletter in your inbox every other week