Liability-Driven Investing


- Plans at or approaching their ultimate funded status objective should consider more aggressive de-risking. The focus should shift to downside protection rather than reaching for funded levels that have little value.
- Consider increasing the amount of interest rate risk you are hedging due to 1) interest rate risk being uncompensated, and 2) forward rates defining the break-even rate for hedging decisions.
- Balance your risk budget by utilizing efficient capital strategies that will limit interest rate risk and allow for potential growth in assets.
Plan sponsors have many factors to consider when making prudent pension risk management decisions. Equity results, interest rate movements, glide path development, Pension Benefit Guaranty Corporation premiums, contribution policy, company-specific risk tolerance, actuarial assumption changes — the list goes on.
Moreover, many of these variables are outside of a plan sponsor’s control as they strive to achieve their ultimate objective: paying benefit obligations to plan participants.
To cut through the complexity, we outline three fundamental pension risk management questions that all plan sponsors should ask themselves — regardless of their company-specific situation.
1. Is pension asymmetry a factor in my strategic asset allocation decisions?
Plan sponsors evaluate many different types of risk, and one of these is surplus risk — the variability of possible funding status outcomes over time. Its simplicity makes it an intuitive and frequently used metric in pension asset-liability analysis.
Here’s the problem: pension plan outcomes are, in fact, asymmetrical. Even though upside and downside scenarios may be equally likely, their impact is very different.
We propose that the “sweet spot” for most plan sponsors is between 100% and 115% funded. Above this range, there are diminishing benefits to an increased funding level. Below 100%, sponsors often take larger positions in return-generating assets with greater risk with the goal of pushing funded status higher.
At the top end of the sweet spot, say 115% funded, sponsors certainly have a comfortable cushion to weather any “un-hedgeables” such as changes to actuarial assumptions, bond downgrades and modest funded status drawdowns. Arguably, any funded status gains above 115% funded result in little or no additional benefit to sponsor or participant. We often refer to this excess as a “trapped surplus” because funded status gains beyond a certain point cannot typically be utilized to create value for the firm or plan participants.
On the flipside, when a plan’s funded status is below 100% there can be significant negative implications. And it only gets worse as funded status declines further. The potential pain for sponsors increases exponentially, with limitations on lump sums, large expected cash contributions, and a portfolio without the asset base to help close the funding gap. In these low-funded scenarios, cash contributions will likely be the largest driver of plans increasing their funding position.
The funded status journey: marginal gain, and potential for significant pain
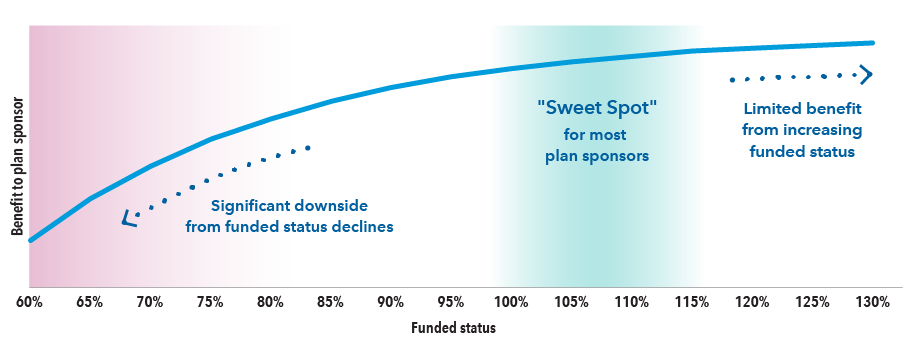
Source: Capital Group. For illustrative purposes only.
2. Am I hedging enough of my interest rate risk?
Interest rates continue to be a hot topic, with most of the focus on where they could go. As many of us have experienced, including industry experts, accurately predicting the future path of interest rates is often a humbling experience.
It is important, however, to take into account two strategic factors when making interest rate hedging decisions. The first is to recognize that interest rate risk is an uncompensated risk. The second factor to bear in mind is that hedging decisions should be based on the forward rates rather than spot rates.
For a pension plan, equities and other return-generating assets are generally utilized to capture an expected return premium in excess of liabilities, to help improve the plan’s funded status and to cover the plan’s ongoing service costs and expenses.
In contrast, the liability hedging portfolio is utilized to reduce volatility by better matching the interest rate sensitivity of the liability, as well as grow with the liability’s interest cost. Based on these basic tenets, equity risk is a “compensated” risk, while interest rate risk is “uncompensated.”
Additionally, while current interest rate levels are observable and easy to reference, it’s actually forward rates that matter when making hedging decisions. Forward rates are derived by current spot rates and reflect the arbitrage-free pricing of interest rates in future periods. Therefore, forwards will always be higher than spot rates when the yield curve has an upward slope.1
By definition, if forward rates are realized, all returns across the yield curve are the same over the time period analyzed. Importantly, this applies to both returns on hedging assets as well as liabilities. So, if forwards are realized, hedging assets and liabilities will have the same return due to interest rate movements, all else being equal.
For an under-hedged plan, it is only when future interest rates exceed the forward curve that a plan will experience a benefit to funded status. In this scenario, liabilities will fall by more than assets, creating a positive funded status outcome for sponsors.
Looking forward to find the right curve
Current yield (spot) curve versus three years forward
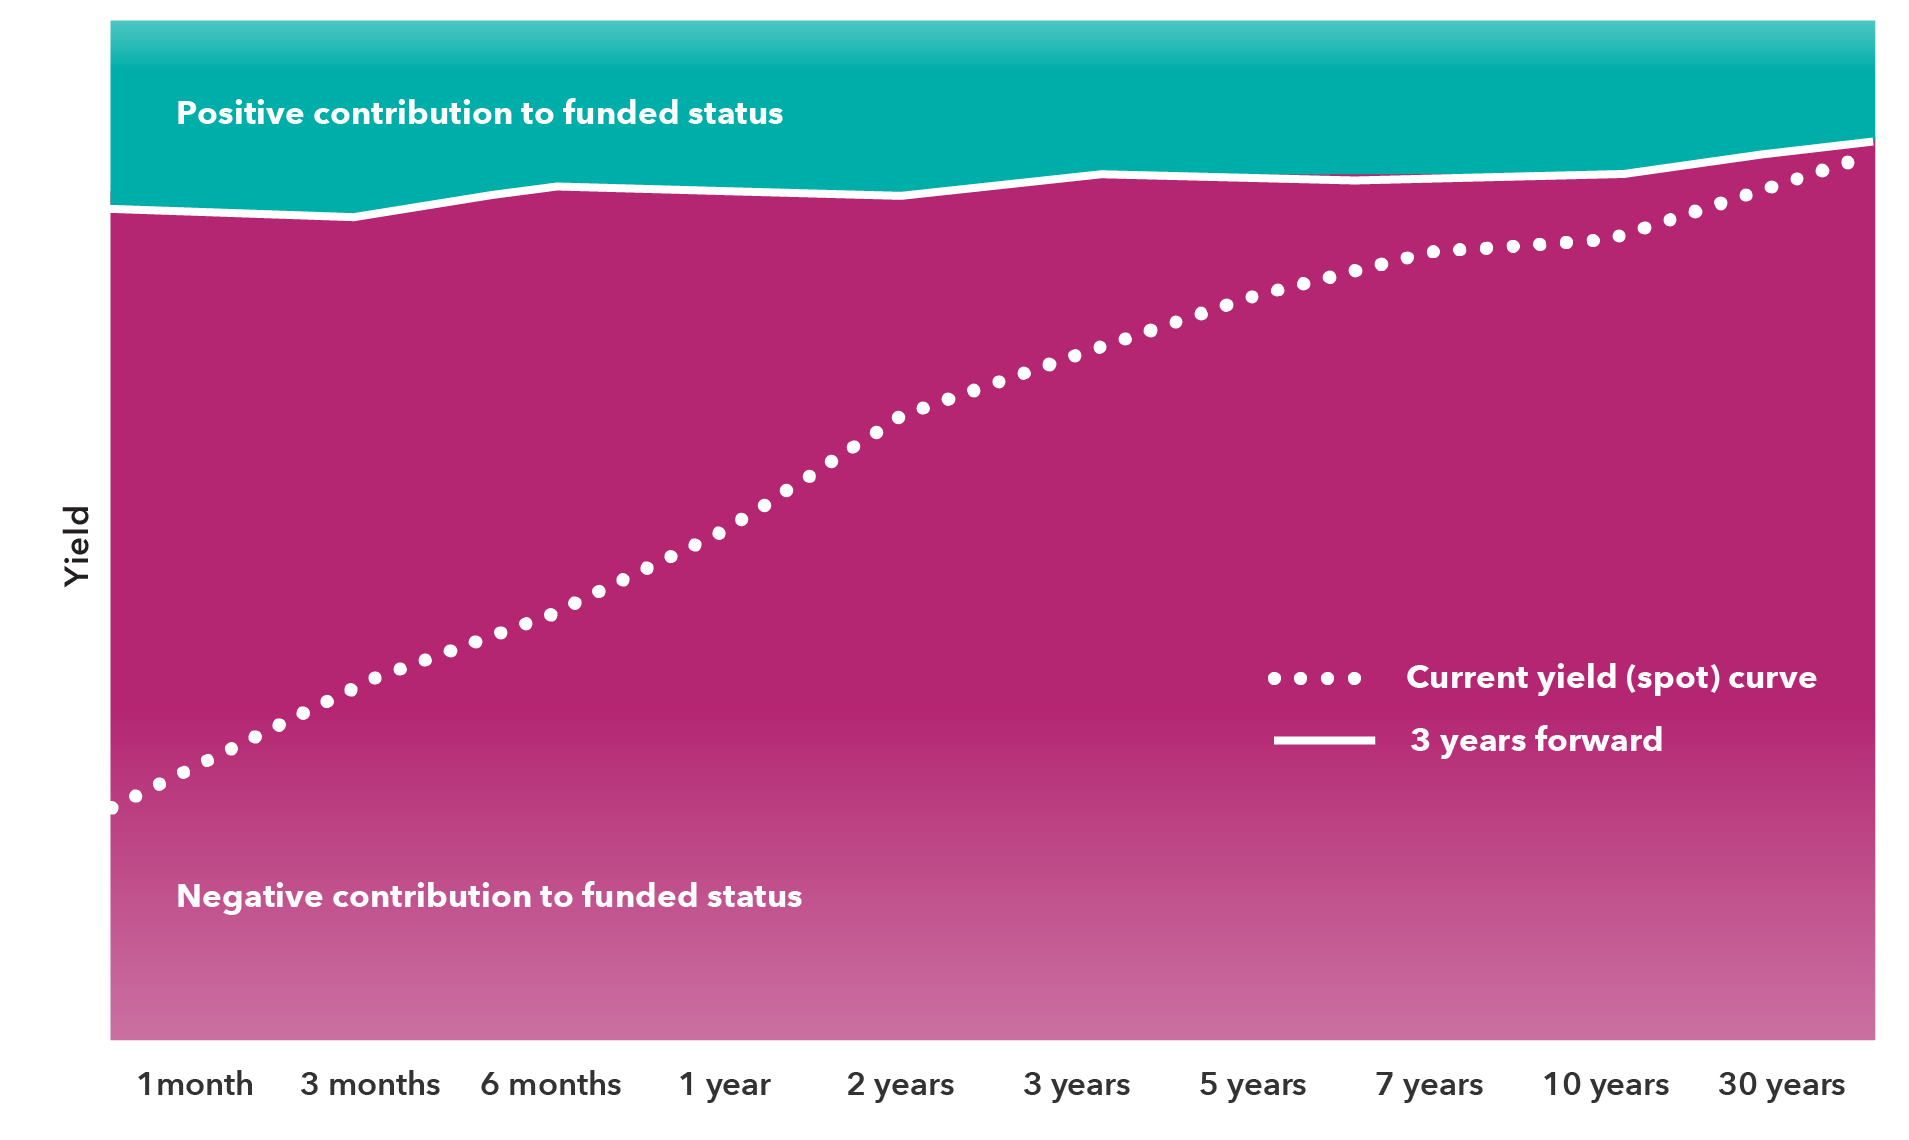
Source: Capital Group. For illustrative purposes only.
1The normal yield curve will be upward sloping, reflecting longer-term risks such as the potential for inflation or default. Flat or inverted yield curves are relatively rare and can result from many factors including explicit Federal Reserve actions, bond supply and demand, or a bleak economic outlook.
3. Am I using my overall risk budget in the most efficient possible way?
For a pension plan, all risk isn’t created equal. Understanding the sources and types of risk in your portfolio is the key to securing long-term plan objectives with the least amount of uncertainty.
As mentioned above, equities and other return-generating assets are utilized to outperform the liability, while the hedging portfolio is utilized to reduce volatility and fluctuate with the liability. So in order to maximize the effectiveness of the return-generating assets, plan sponsors should consider the sources of risk in the portfolio.
Consider a simple example to demonstrate how a plan with a defined risk budget can construct a portfolio in very different ways and with very different pension risk management outcomes.
The equity and fixed income allocations in these portfolios differ, however both result in a one-year surplus VaR (95%) of $29 million.
One risk budget, very different portfolios
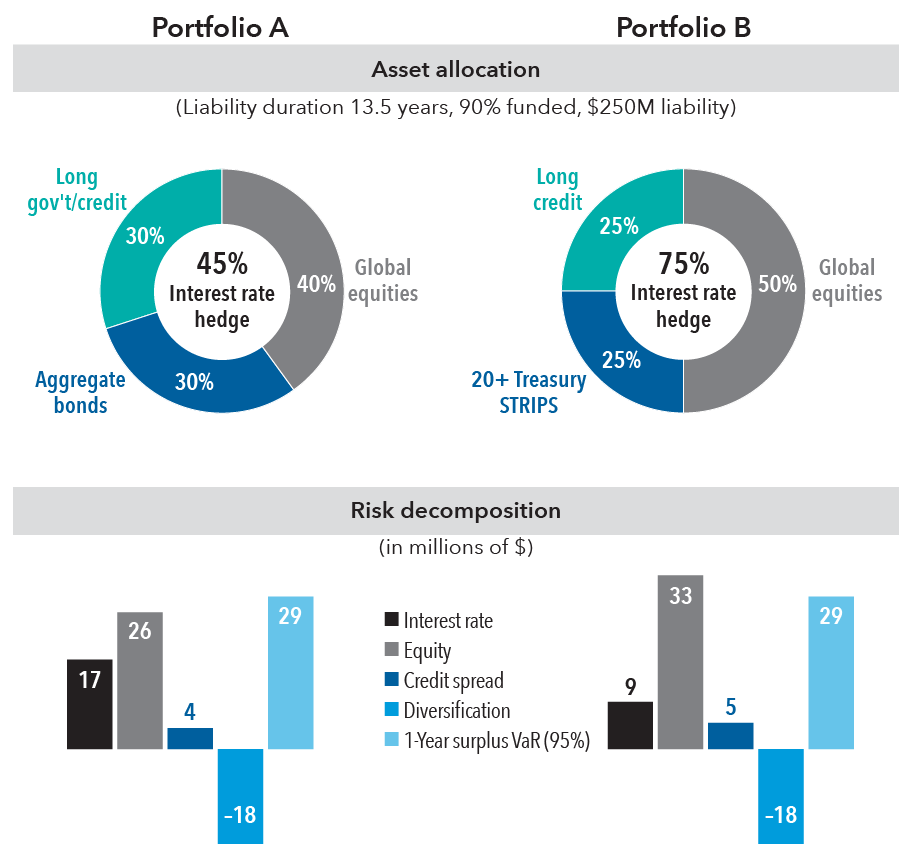
Source: Capital Group. For illustrative purposes only. “Risk decomposition” is expected loss over one-year period. Value at risk (VaR) is an estimate of how much the hypothetical portfolio might lose over one year with a 95% confidence interval given normal market conditions.
We would expect Portfolio B to have a higher expected rate of return due to the 10% higher allocation to equities. While Portfolio B has a smaller fixed income portfolio, it is created in a more capital-efficient manner by utilizing a combination of long credit and Treasury STRIPS. This results in a much higher hedge ratio of 75% for Portfolio B relative to Portfolio A.
In summary, Portfolio B has a higher allocation to equities, a higher expected return, a higher interest rate hedge ratio and a risk budget balanced more toward compensated risk than uncompensated risk.
By following the three takeaways above, plan sponsors can seek to build a better asset allocation that can help improve their pension risk management outcomes. Whether considering pension risk asymmetry, the level of interest rate risk hedging, or getting compensated for risk, these insights can help guide decision-making toward an improved LDI strategy.
Our latest insights
-
-
Regulation & Legislation
-
Asset Allocation
-
Portfolio Construction
-
Defined Benefit
Bloomberg® is a trademark and service mark of Bloomberg Finance L.P. and its affiliates (collectively “Bloomberg”). Bloomberg or Bloomberg’s licensors own all proprietary rights in the Bloomberg Indices. Neither Bloomberg nor Bloomberg’s licensors approves or endorses this material, or guarantees the accuracy or completeness of any information herein, or makes any warranty, express or implied, as to the results to be obtained therefrom and, to the maximum extent allowed by law, neither shall have any liability or responsibility for injury or damages arising in connection therewith.