Active Management
Categories
Emerging Markets
Emerging markets 2026: Can the rally keep rolling?
 Saurav Jain
 Lisa Thompson
 Kent Chan
December 16, 2025
Emerging markets (EM) are on track for their strongest annual return since 2017, driven by a weaker U.S. dollar and a global rotation into non-U.S. stocks. As we look ahead to 2026, can the rebound continue? Several catalysts — from accelerating earnings growth to AI-driven demand — suggest the outlook is promising.
For an asset class that has long been out of favour, it would be a welcome sign. For 15 years, emerging markets, as measured by the MSCI Emerging Markets Index, have trailed global benchmarks like the S&P 500 Index and MSCI World Index by a wide margin. Among the reasons: slowing growth in China, a strong U.S. dollar and the dominance of U.S. tech companies.
Today, the picture is shifting in a more positive direction for emerging markets. After strong gains this year, here are key factors that could drive further interest.
Emerging markets have outpaced U.S.
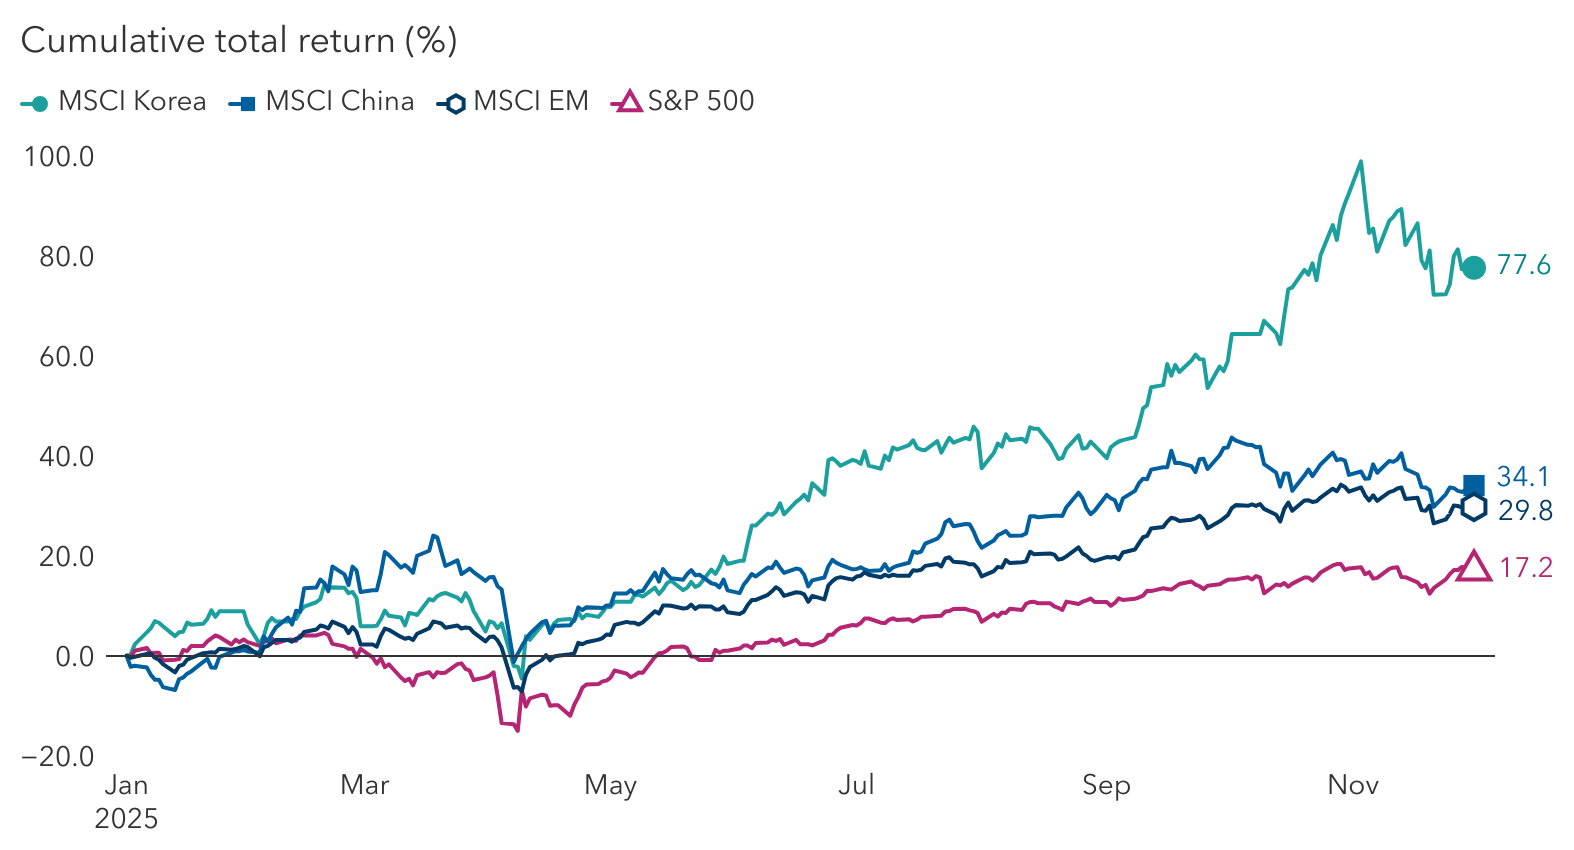
Sources: MSCI, RIMES, S&P Dow Jones Indices LLC. Data as of December 1, 2025. Returns are in USD.
1. Earnings growth and rate cuts appear promising
For starters, earnings growth across most emerging markets appears promising, with four of the five countries that make up 80% of the MSCI Emerging Markets Index projected to increase profits at a double-digit rate year over year.
Central banks in many EM countries are poised to cut interest rates, which may benefit returns in those local equity markets. Inflation is under control, and in some countries, inflation is much lower than in developed markets.
Additionally, many EM economies maintain current account surpluses, whereas some developed markets, notably the U.S., run deficits. This dynamic could strengthen EM currencies over the medium term.
EM earnings growth set to accelerate
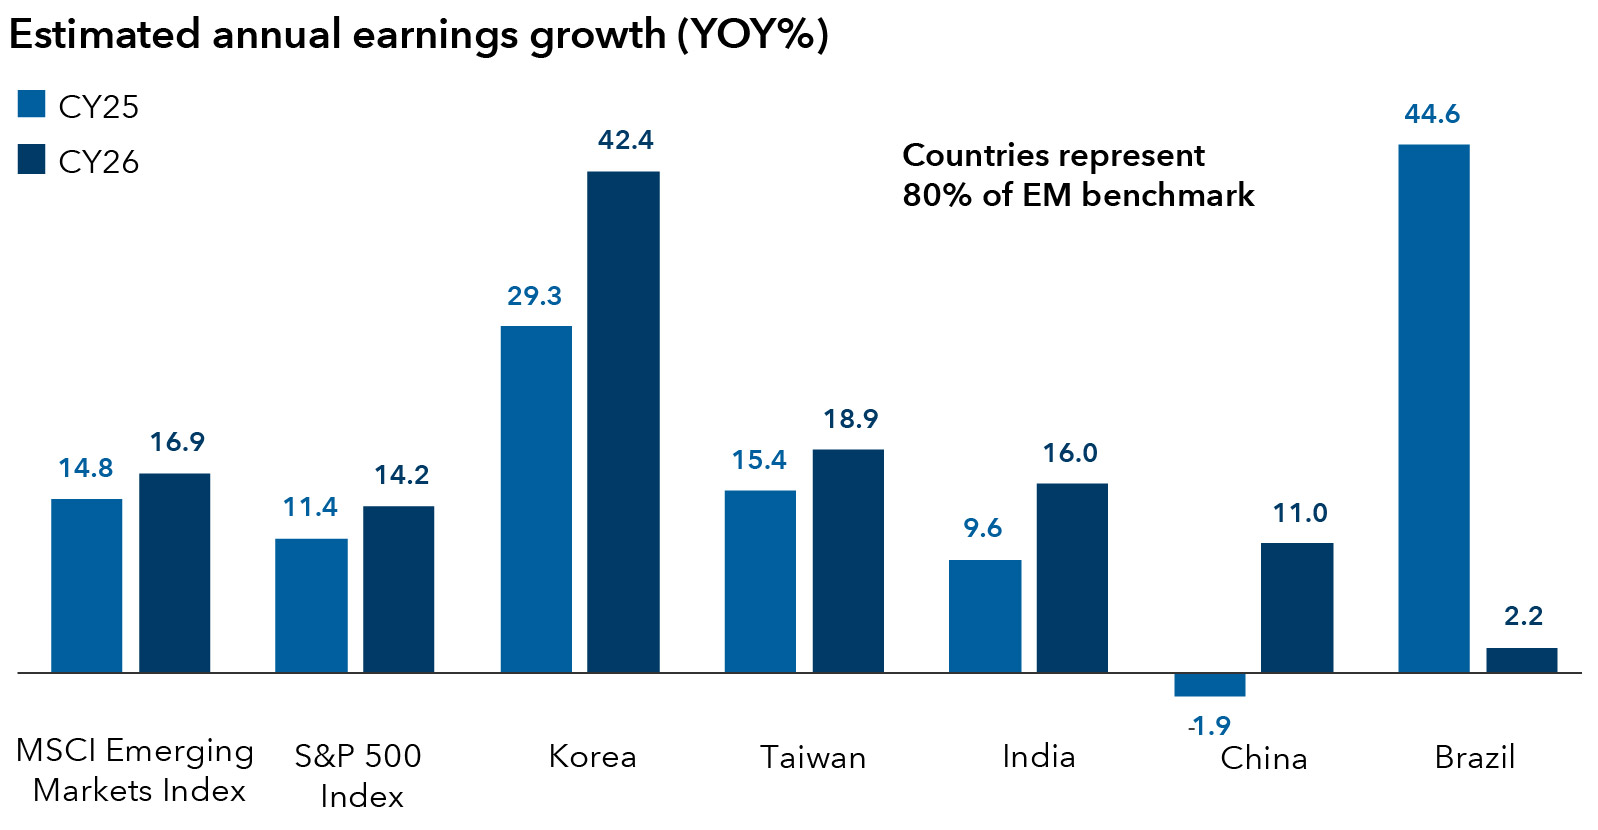
Sources: FactSet, MSCI. Countries are represented by their respective MSCI index. EM benchmark = MSCI Emerging Markets Index. Data as of November 28, 2025.
2. EM companies are key suppliers in global AI race
When it comes to the hundreds of billions of dollars being spent to build AI data centres, leading technology companies in emerging markets are direct beneficiaries.
Taiwan’s TSMC, for example, dominates advanced chip manufacturing, while Korea’s SK Hynix leads in high-bandwidth memory chips essential for AI servers. There are risks, however. If AI spending cools, the tech-heavy EM benchmark could face headwinds, especially if order volumes decline.
Beyond AI, EM firms supplying raw materials, semiconductors and industrial automation tools stand to benefit from supply chain realignment and new manufacturing investments worldwide. Rising global defence spending could also boost demand for Korean shipbuilders and defence equipment makers.
3. Reforms to improve corporate profitability
Across Asia, a wave of regulatory-driven initiatives is reshaping corporate behaviour. These initiatives, aimed at improving profitability, boosting return on equity, and divesting noncore assets, could help boost valuations and stock prices.
Korea is a prime example. Our research shows at least 150 Korean companies since February 2024 have filed multi-year plans promising tighter capital discipline, bigger cash returns and clearer growth stories. Similar programs are underway in China, Taiwan and southeast Asia, creating fertile ground for active investors.
4. China reengineers growth model
Several years ago, many wondered if China was uninvestible after a government crackdown on private sector firms sparked a sharp selloff in Chinese stocks. Making matters worse, China’s property market — a key driver of GDP growth and personal wealth — was saddled with too much debt, hurting consumer spending.
The picture is not as dire as once believed, which may bode well. China is an influential part of the MSCI Emerging Markets Index, making up 31% of the weighting.
For one, the macro environment is slowly improving. Government officials seek to blunt deflation by shuttering inefficient manufacturing capacity and taming hyper price competition in certain industries. The party’s policy direction is also evolving. There’s greater emphasis on high end manufacturing and leveraging AI to bolster the economy. Meanwhile, there’s been a de-escalation in the ongoing trade and technology conflict with the U.S., adding to a more positive backdrop.
China’s technology sector is thriving again, boosted by the emergence of AI startup DeepSeek and supportive government policies to encourage entrepreneurs. Plus, China’s tech giants are flush with cash to fuel growth plans for AI and other ventures.
China tech giants sitting on pile of cash
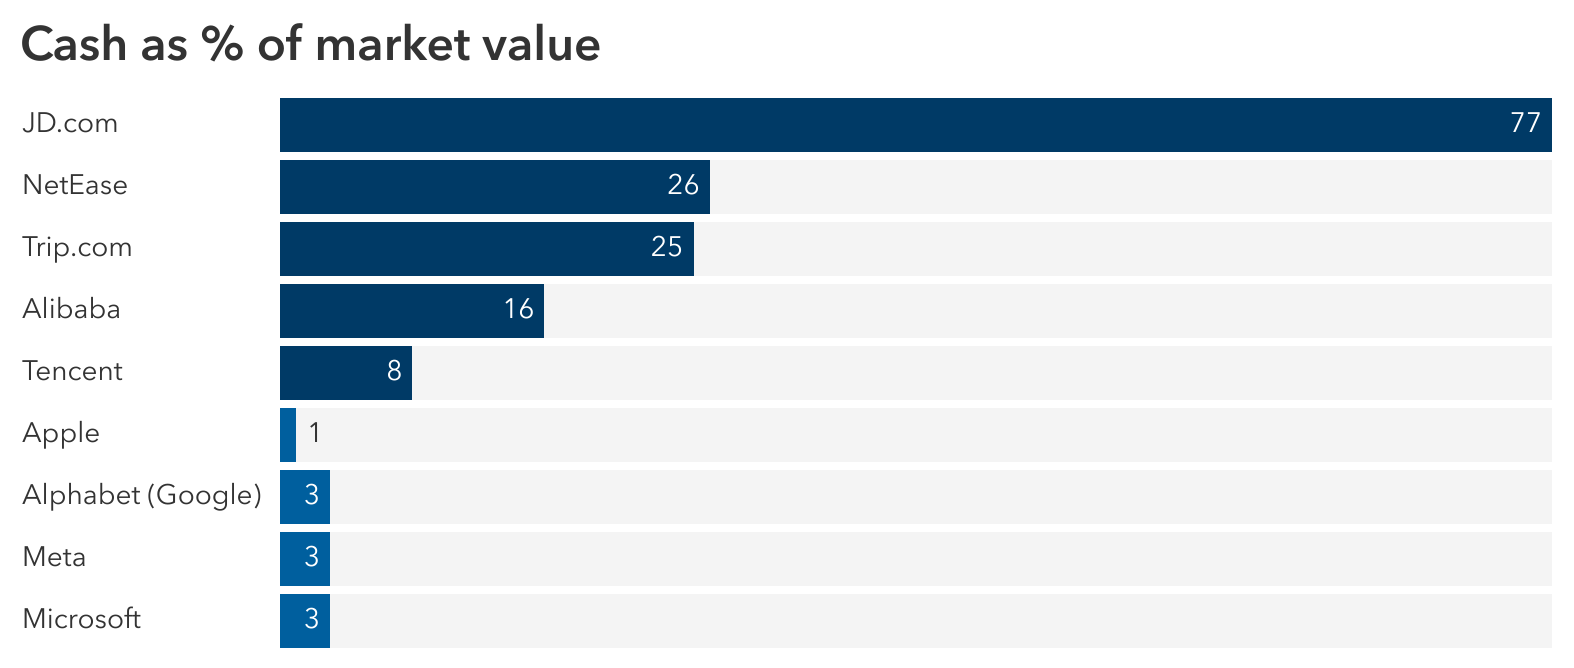
Source: FactSet. Data for cash and short-term investments is as of September 30, 2025. Market value as of November 30, 2025. U.S. companies (Apple, Alphabet, Meta and Microsoft) listed among largest by weight in the MSCI USA Index as of November 30, 2025.
5. Valuations offer room to run
Valuations have improved but EM trades at a significant discount to global peers.
Korea and Brazil, for instance, trade near their 10-year averages on a forward price-to-earnings basis. Multiples for China’s leading technology companies have recovered from historic lows but remain reasonable compared to U.S. counterparts. India’s valuations have moderated, aligning better with its strong demographic and growth profile.
EM trades at significant valuation discount to world
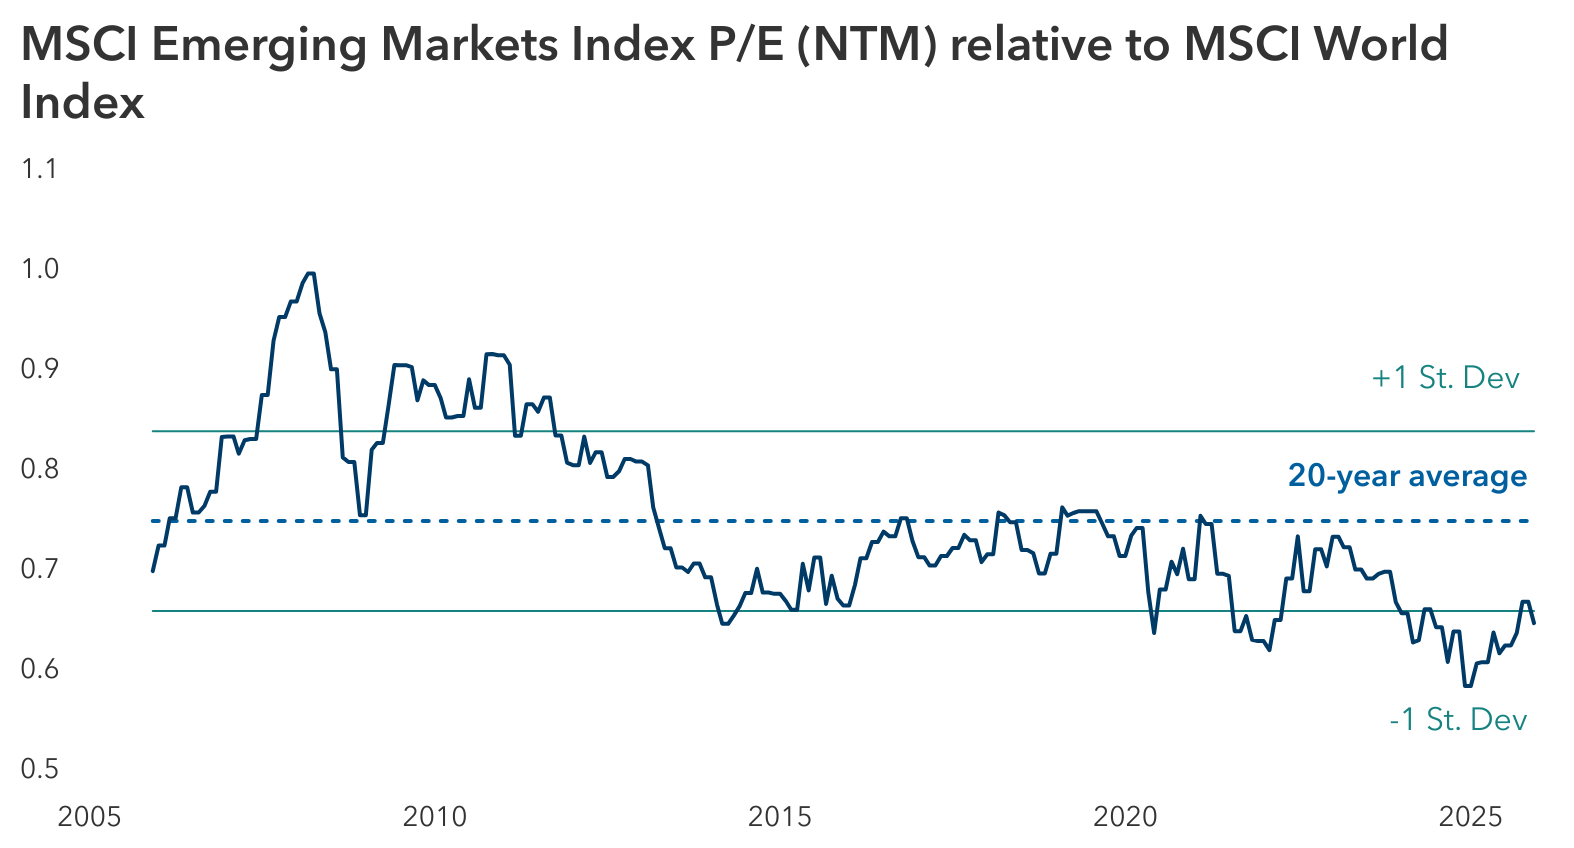
Sources: Capital Group, FactSet, MSCI. As of November 30, 2025. NTM = next twelve months. P/E = price-to-earnings.
A promising direction
Robust earnings growth, potential rate cuts and structural reforms across Asia should all bode well for emerging markets. With U.S. dollar strength abating, we think durable trends — such as reshoring of supply chains, corporate profitability reforms and the rapid development of AI – offer compelling opportunities for select EM companies.
Learn more about
Saurav Jain is a portfolio manager for Capital Group Capital Income Builder (Canada).
Lisa Thompson is a portfolio manager for Capital Group International Equity Fund (Canada) and Capital Group International Equity Select ETF (Canada).
Past results are not predictive of results in future periods.
MSCI Brazil Index is designed to measure the performance of the large- and mid-cap segments of the Brazilian market.
MSCI China Index captures large- and mid-cap representation across China A shares, H shares, B shares, Red chips, P chips and foreign listings (e.g. ADRs).
MSCI Emerging Markets Index is a free-float-adjusted market-capitalization-weighted index designed to measure equity market results across global emerging markets, consisting of more than 20 emerging markets country indexes.
MSCI India Index is designed to measure the performance of the large- and mid-cap segments of the Indian market.
MSCI Korea Index is designed to measure the performance of the large- and mid-cap segments of the South Korean market.
MSCI Taiwan Index is designed to measure the performance of the large- and mid-cap segments of the Taiwan market.
MSCI World Index captures large- and mid-cap representation across Developed Markets countries.
S&P 500 Index is a market capitalization-weighted index based on the results of approximately 500 widely held common stocks.
Our latest insights
RELATED INSIGHTS
-
Global Equities
-
-
Economic Indicators
Commissions, trailing commissions, management fees and expenses all may be associated with investments in investment funds. Please read the prospectus before investing. Investment funds are not guaranteed or covered by the Canada Deposit Insurance Corporation or by any other government deposit insurer. For investment funds other than money market funds, their values change frequently. For money market funds, there can be no assurances that the fund will be able to maintain its net asset value per security at a constant amount or that the full amount of your investment in the fund will be returned to you. Past performance may not be repeated.
Unless otherwise indicated, the investment professionals featured do not manage Capital Group‘s Canadian investment funds.
References to particular companies or securities, if any, are included for informational or illustrative purposes only and should not be considered as an endorsement by Capital Group. Views expressed regarding a particular company, security, industry or market sector should not be considered an indication of trading intent of any investment funds or current holdings of any investment funds. These views should not be considered as investment advice nor should they be considered a recommendation to buy or sell.
Statements attributed to an individual represent the opinions of that individual as of the date published and do not necessarily reflect the opinions of Capital Group or its affiliates. This information is intended to highlight issues and not be comprehensive or to provide advice. For informational purposes only; not intended to provide tax, legal or financial advice. Capital Group funds are available in Canada through registered dealers. For more information, please consult your financial and tax advisors for your individual situation.
Forward-looking statements are not guarantees of future performance, and actual events and results could differ materially from those expressed or implied in any forward-looking statements made herein. We encourage you to consider these and other factors carefully before making any investment decisions and we urge you to avoid placing undue reliance on forward-looking statements.
The S&P 500 Composite Index (“Index”) is a product of S&P Dow Jones Indices LLC and/or its affiliates and has been licensed for use by Capital Group. Copyright © 2026 S&P Dow Jones Indices LLC, a division of S&P Global, and/or its affiliates. All rights reserved. Redistribution or reproduction in whole or in part are prohibited without written permission of S&P Dow Jones Indices LLC.
FTSE source: London Stock Exchange Group plc and its group undertakings (collectively, the "LSE Group"). © LSE Group 2026. FTSE Russell is a trading name of certain of the LSE Group companies. "FTSE®" is a trade mark of the relevant LSE Group companies and is used by any other LSE Group company under licence. All rights in the FTSE Russell indices or data vest in the relevant LSE Group company which owns the index or the data. Neither LSE Group nor its licensors accept any liability for any errors or omissions in the indices or data and no party may rely on any indices or data contained in this communication. No further distribution of data from the LSE Group is permitted without the relevant LSE Group company's express written consent. The LSE Group does not promote, sponsor or endorse the content of this communication. The index is unmanaged and cannot be invested in directly.
BLOOMBERG® is a trademark and service mark of Bloomberg Finance L.P. and its affiliates (collectively “Bloomberg”). Bloomberg or Bloomberg’s licensors own all proprietary rights in the Bloomberg Indices. Neither Bloomberg nor Bloomberg’s licensors approves or endorses this material, or guarantees the accuracy or completeness of any information herein, or makes any warranty, express or implied, as to the results to be obtained therefrom and, to the maximum extent allowed by law, neither shall have any liability or responsibility for injury or damages arising in connection therewith.
The MSCI information may only be used for your internal use, may not be reproduced or redisseminated in any form and may not be used as a basis for or a component of any financial instruments or products or indices. None of the MSCI information is intended to constitute investment advice or a recommendation to make (or refrain from making) any kind of investment decision and may not be relied on as such. Historical data and analysis should not be taken as an indication or guarantee of any future performance analysis, forecast or prediction. The MSCI information is provided on an “as is” basis and the user of this information assumes the entire risk of any use made of this information. MSCI, each of its affiliates and each other person involved in or related to compiling, computing or creating any MSCI information (collectively, the “MSCI Parties”) expressly disclaims all warranties (including, without limitation, any warranties of originality, accuracy, completeness, timeliness, non-infringement, merchantability and fitness for a particular purpose) with respect to this information. Without limiting any of the foregoing, in no event shall any MSCI Party have any liability for any direct, indirect, special, incidental, punitive, consequential (including, without limitation, lost profits) or any other damages. (www.msci.com)
Capital believes the software and information from FactSet to be reliable. However, Capital cannot be responsible for inaccuracies, incomplete information or updating of the information furnished by FactSet. The information provided in this report is meant to give you an approximate account of the fund/manager's characteristics for the specified date. This information is not indicative of future Capital investment decisions and is not used as part of our investment decision-making process.
Indices are unmanaged and cannot be invested in directly. Returns represent past performance, are not a guarantee of future performance, and are not indicative of any specific investment.
All Capital Group trademarks are owned by The Capital Group Companies, Inc. or an affiliated company in Canada, the U.S. and other countries. All other company names mentioned are the property of their respective companies.
Capital Group funds are offered in Canada by Capital International Asset Management (Canada), Inc., part of Capital Group, a global investment management firm originating in Los Angeles, California in 1931. Capital Group manages equity assets through three investment groups. These groups make investment and proxy voting decisions independently. Fixed income investment professionals provide fixed income research and investment management across the Capital organization; however, for securities with equity characteristics, they act solely on behalf of one of the three equity investment groups.
The Capital Group funds offered on this website are available only to Canadian residents.