Portfolio Construction
Categories
Credit
The AI debt boom: Balancing risk and opportunity
 Mital Kotecha
 Theo Pan
 Greg Garrett
September 23, 2026
KEY TAKEAWAYS
- Financing the AI buildout has led to a dramatic increase in debt issuance in public and private markets.
- Despite the record level of AI debt issuance over the past three years, market demand for U.S. investment-grade (IG) bonds has largely absorbed this supply.
- As of the end of August, U.S. IG spreads have remained unchanged in 2026, but spreads for hyperscalers and other AI-related issuers have widened.
- Among AI-related bonds, we favour companies with diversified business models and a high degree of infrastructure fungibility.
Like many transformative technologies, artificial intelligence (AI) is driving an investment wave of historic proportions. For example, estimated capital expenditures (capex) among the five major U.S. hyperscalers — Alphabet, Amazon, Meta, Microsoft and Oracle — in 2026 and 2027 dwarf previous periods of capital-intensive technological advancements such as the Manhattan Project, the Apollo moon landing and the internet buildout.
Hyperscalers 2026 and 2027 estimated capex dwarfs U.S. technological leaps
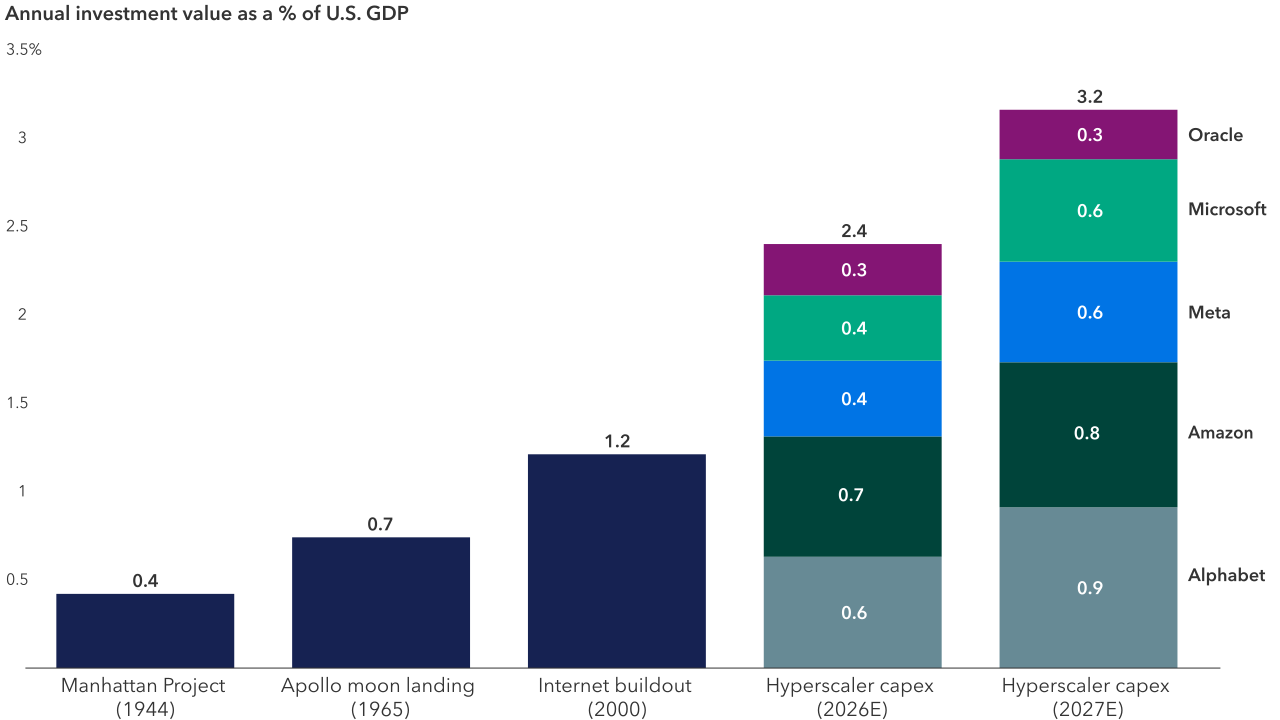
Sources: Capital Group, Brookings, U.S. Congressional Budget Office (CBO), FactSet, Federal Reserve Bank of St. Louis, The Planetary Society, U.S. Census Bureau. Project costs for the Manhattan Project, Apollo moon landing and internet buildout reflect peak annual spending during each project's lifetime. Hyperscalers are large technology firms that operate global data centre networks to provide scalable cloud computing and AI services, represented by Alphabet, Amazon, Meta, Microsoft and Oracle. “2026E” and “2027E” represent estimated, full-year figures for hyperscaler capital expenditures (capex). Estimated 2027 hyperscaler capital expenditures are based on sell-side consensus estimates as of September 11, 2026, expressed as a percentage of GDP using CBO long-term budget projections released on February 11, 2026.
Meanwhile, several AI-related stocks have been on a tear, with companies like Dell Technologies, Nvidia and Micron Technology generating cumulative price returns of 925%, 986% and 1696% over the past five years, respectively, as of August 31. With this success, however, concentration risk has developed in equity markets as AI companies have come to represent a much larger percentage of the market capitalization of the S&P 500 Index and the NASDAQ 100.
Financing the AI buildout has led to a dramatic increase in debt issuance in public and private markets. In the investment-grade (IG) market, for example, the five major hyperscalers mentioned above have issued US$240.7 billion in debt year-to-date as of August 31, with US$66 billion issued in non-dollar currencies. If we add U.S. dollar issuance from SpaceX and Nvidia, U.S. dollar issuance reaches US$224.5 billion and total issuance across currencies jumps to US$290.7 billion. To put that in perspective: The total value of all 10-year U.S. Treasury bonds issued in 2026 as of August 31 was US$321 billion – only modestly higher than the combined issuance of the companies mentioned above.
While most issuance in the IG market has consisted of senior unsecured debt, the IG market has also produced bespoke, structured finance issues that companies have engineered to support the construction of large data centres. For example, the largest single‑tranche bond issue in terms of dollar value in the U.S. IG market belongs to Beignet Investor LLC, a holding company created by Blue Owl Capital to fund the construction of a 2.1-gigawatt Meta data centre campus in Louisiana. Due to the public-private nature of the offering, these bonds are not index-eligible, yet they are very liquid securities, thus reflecting the broad acceptance that structured finance issues have gained in the IG market.
Market demand has largely absorbed AI debt supply
Despite the record level of AI debt issuance over the past three years, market demand for U.S. IG bonds has largely absorbed this supply. In fact, based on the Bloomberg U.S. Corporate Index, corporate bond spreads ended August at 78 basis points — the same level at which they began 2026.
AI debt issuance has been massive, but U.S. IG spreads haven’t widened in 2026
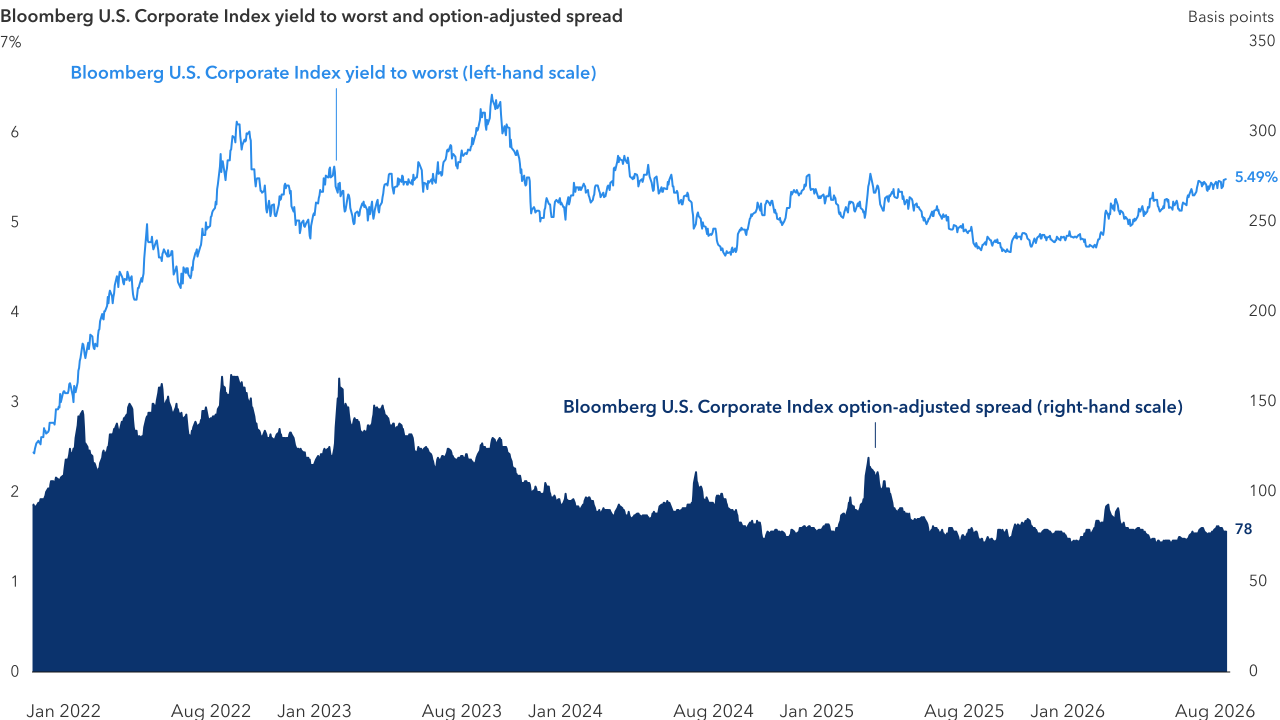
Source: LSEG Datastream. As of August 31, 2026.
This demand has consisted of several components. First, the general rise in U.S. Treasury yields since the end of 2021 has contributed to U.S. IG yields mostly trading above 5% since the second half of 2022. In turn, these higher yields have attracted more inflows as investors have looked to U.S. IG bonds to provide portfolio income.
The annuity market has provided another source of demand. In the U.S., an aging population and a growing cohort of retirees have helped support demand for investment vehicles that provide consistent income. And while not all of this demand has found its way to the U.S. IG market, a large portion of annuity assets are invested there. Within this environment, LIMRA (the Life Insurance Marketing and Research Association) reported in July that annuity sales had remained above US$100 billion for the eleventh quarter in a row.
Finally, foreign demand for U.S. IG bonds has grown steadily since 2021, especially among private sector investors. Net foreign inflows reached US$448 billion for the rolling 12-month period ending on June 15, 2026, the highest level since 2007.
Foreign demand for U.S. IG bonds has risen sharply since 2021
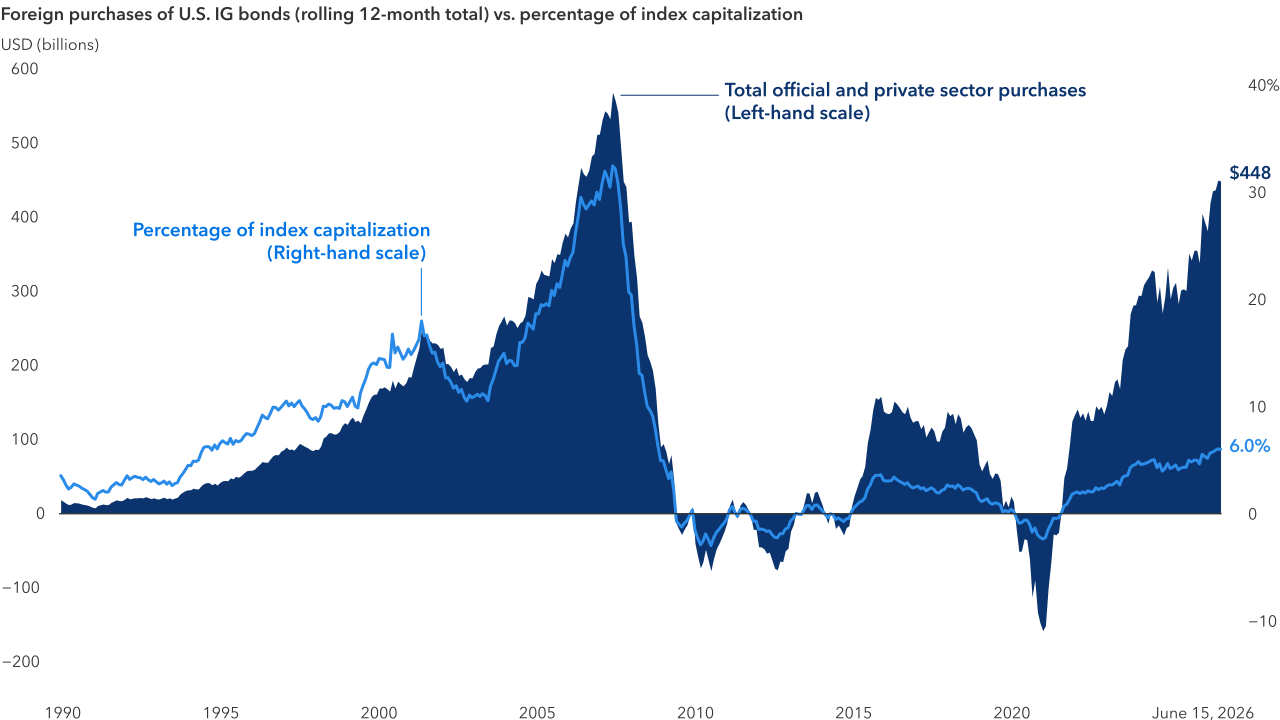
Source: LSEG Datastream. As of August 31, 2026. U.S. IG bonds are represented by the Bloomberg U.S. Corporate Index. In this context, official sector purchases represent purchases by foreign government entities such as central banks or sovereign wealth funds. Private sector purchases represent purchases by foreign private individuals or entities, such as investment firms, foundations or endowments. The percentage of index capitalization represents the percentage of the total value of the Bloomberg U.S. Corporate Index that foreign purchases represent at a given point in the chart. Indices are unmanaged and therefore have no expenses. Investors cannot invest directly in an index. Values are in USD.
Meanwhile, U.S. IG yields continue to look attractive in the context of lower interest rates in other developed markets. Given that dynamic and the relatively funding-cost-insensitive nature of hyperscaler debt issuers, we expect that the market will show continued demand for AI debt, albeit at potentially wider spreads as issuer concentration limits come into greater focus over time.
The impact of AI issuance on spreads
As of the end of August, U.S. IG spreads have remained unchanged in 2026 (based on the Bloomberg U.S. Corporate Index), but spreads for 10+-year hyperscaler bonds and other AI-related issuers have widened.
10+-year hyperscaler spreads have widened as issuance levels have increased
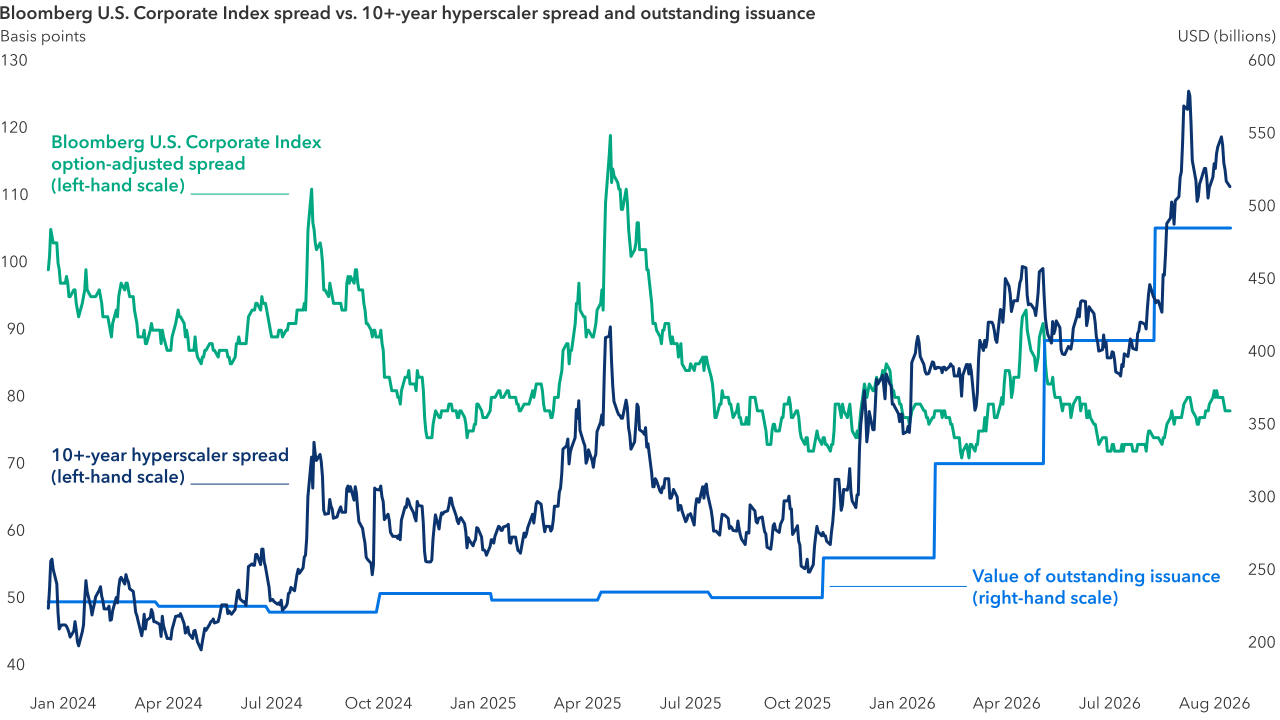
Sources: Sage, Bloomberg Finance L.P. As of August 31, 2026. Values are in USD.
In our view, this widening has been driven by high current issuance and the fact that the market expects future issuance to rise even higher. In the last four months of 2026, for example, we expect that the five major hyperscalers will issue more than US$25 billion in additional debt. Beyond that, we anticipate that in 2027 and 2028, total issuance for the five major hyperscalers in the U.S. IG dollar market will likely be between US$100 billion and US$200 billion. We also believe that AI spread widening reflects concerns that the revenue that AI issuers will eventually generate may disappoint investors’ expectations and weaken these companies’ fundamentals.
To some extent, we share these concerns. While these companies generate substantial amounts of operating cash flow from their existing businesses, consensus forecasts indicate that in 2027 and 2028, the upfront cost of their AI investments will exceed these figures. Although estimates indicate that operating cash flow will turn positive in 2029, whether these companies will eventually be able to generate enough revenue to justify their massive AI investments remains uncertain.
Finding opportunities within an array of options
Although the proliferation of AI debt has created an array of options for investors, we’re focused on narrowing that range to identify bonds that offer strong upside potential with limited downside risk. Generally speaking, we’re concentrating on liquid, on-the-run securities that allow us to take advantage of relative value opportunities as they evolve in the marketplace. More specifically, we favour AI issuers with diversified business models and those that provide a high degree of fungibility in their infrastructure.
When a company has a highly diversified business model, we think they have much greater potential to generate the extraordinary amount of revenue that’s necessary to fund their AI investments directly or to issue equity or high-quality bonds that will help fund those investments. On the other hand, AI companies with less diversified business models, such as those that are developing advanced large language models or niche AI applications, may be less attractive given their potentially higher degree of risk.
Fungibility is also an important consideration. In the AI infrastructure market, fungibility is generally defined as the ability to repurpose infrastructure (such as GPUs, clusters, and power and data centres) as necessary to meet one’s business objectives. In a rapidly evolving market, we favour companies whose infrastructure can easily pivot to host competing AI models if these companies believe that such a shift would be advantageous. In other words, if certain AI applications don’t generate sufficient revenue over time — or if more profitable applications become apparent — we think a high degree of infrastructure fungibility gives AI issuers the ability to remain adaptive in a highly competitive and uncertain business environment.
In terms of our broad portfolio positioning, we’re modestly overweight bonds issued by select hyperscalers and investment-grade issuers that are focused on building data centres. This positioning reflects our confidence that these companies can generate meaningful AI-related revenue while balancing the risk of continued heavy debt issuance. We also favour select industrial suppliers, including companies that provide power generation and infrastructure equipment. In our view, these companies benefit from AI-related infrastructure demand without necessarily carrying the same financing and contingent-liability risk as hyperscalers. We have less exposure to semiconductor-related issuers because these companies are taking on additional balance sheet risks to facilitate their customers’ chip purchases, among other reasons.
Broadly speaking, each of the bespoke structures discussed earlier (such as special purpose vehicles or “SPVs”) has deal-specific covenants and provisions, some of which may be unusually complex from the bondholders’ perspective. Given the nature of the SPV structures that have been issued in the 144A format this year, we are taking a very selective approach and evaluating each structure individually. We tend to favour structures with lease terms and amortization profiles that are sufficiently strong to consider valuing the SPV relative to the tenant or ultimate credit backstop. When deciding whether to participate in a transaction, we assess the opportunity carefully across a spectrum of construction risk, casualty risk and tenant lease termination provisions, among other factors.
Remaining cognizant of risk
The AI buildout is offering investors an opportunity to participate in one of the most extraordinary investment booms in history. Still, we remain cognizant of the fact that at this point, AI investments vastly exceed AI revenues. And while AI revenue is growing quickly, there’s still no guarantee that it will eventually meet investors’ high expectations. In the fixed income market, we believe that AI issuers will generally be able to meet their payment obligations. In addition, spread widening in these issuers has started to provide attractive relative value opportunities. That said, given the amount of AI debt that companies have already issued and the amount that we expect them to issue going forward, we remain appropriately cautious as we seek to balance concentration risk and long-term expected returns. AI debt opportunities are in many ways compelling, but patient, fundamentally sound investing is still essential.
Learn more about
The Bloomberg U.S. Corporate Index measures the investment-grade, fixed-rate, taxable corporate bond market. It includes USD-denominated securities publicly issued by U.S. and non-U.S. industrial, utility, and financial issuers.
In the context of special purpose vehicles (SPVs), the 144A format refers to issuing debt or equity securities under U.S. Security and Exchange Commission Rule 144A. This format provides a regulatory "safe harbour" that allows the SPV to issue and trade unregistered securities quickly and efficiently, provided they are sold exclusively to qualified institutional buyers (QIBs) such as insurance companies, pension funds and large asset managers.
Our latest insights
-
-
Technology & Innovation
-
Objective-Based Investing
-
-
Active Management
RELATED INSIGHTS
-
-
Interest Rates
-
Technology & Innovation
Commissions, trailing commissions, management fees and expenses all may be associated with investments in investment funds. Please read the prospectus before investing. Investment funds are not guaranteed or covered by the Canada Deposit Insurance Corporation or by any other government deposit insurer. For investment funds other than money market funds, their values change frequently. For money market funds, there can be no assurances that the fund will be able to maintain its net asset value per security at a constant amount or that the full amount of your investment in the fund will be returned to you. Past performance may not be repeated.
Unless otherwise indicated, the investment professionals featured do not manage Capital Group‘s Canadian investment funds.
References to particular companies or securities, if any, are included for informational or illustrative purposes only and should not be considered as an endorsement by Capital Group. Views expressed regarding a particular company, security, industry or market sector should not be considered an indication of trading intent of any investment funds or current holdings of any investment funds. These views should not be considered as investment advice nor should they be considered a recommendation to buy or sell.
Statements attributed to an individual represent the opinions of that individual as of the date published and do not necessarily reflect the opinions of Capital Group or its affiliates. This information is intended to highlight issues and not be comprehensive or to provide advice. For informational purposes only; not intended to provide tax, legal or financial advice. Capital Group funds are available in Canada through registered dealers. For more information, please consult your financial and tax advisors for your individual situation.
Forward-looking statements are not guarantees of future performance, and actual events and results could differ materially from those expressed or implied in any forward-looking statements made herein. We encourage you to consider these and other factors carefully before making any investment decisions and we urge you to avoid placing undue reliance on forward-looking statements.
The S&P 500 Composite Index (“Index”) is a product of S&P Dow Jones Indices LLC and/or its affiliates and has been licensed for use by Capital Group. Copyright © 2026 S&P Dow Jones Indices LLC, a division of S&P Global, and/or its affiliates. All rights reserved. Redistribution or reproduction in whole or in part are prohibited without written permission of S&P Dow Jones Indices LLC.
FTSE source: London Stock Exchange Group plc and its group undertakings (collectively, the "LSE Group"). © LSE Group 2026. FTSE Russell is a trading name of certain of the LSE Group companies. "FTSE®" is a trade mark of the relevant LSE Group companies and is used by any other LSE Group company under licence. All rights in the FTSE Russell indices or data vest in the relevant LSE Group company which owns the index or the data. Neither LSE Group nor its licensors accept any liability for any errors or omissions in the indices or data and no party may rely on any indices or data contained in this communication. No further distribution of data from the LSE Group is permitted without the relevant LSE Group company's express written consent. The LSE Group does not promote, sponsor or endorse the content of this communication. The index is unmanaged and cannot be invested in directly.
BLOOMBERG® is a trademark and service mark of Bloomberg Finance L.P. and its affiliates (collectively “Bloomberg”). Bloomberg or Bloomberg’s licensors own all proprietary rights in the Bloomberg Indices. Neither Bloomberg nor Bloomberg’s licensors approves or endorses this material, or guarantees the accuracy or completeness of any information herein, or makes any warranty, express or implied, as to the results to be obtained therefrom and, to the maximum extent allowed by law, neither shall have any liability or responsibility for injury or damages arising in connection therewith.
The MSCI information may only be used for your internal use, may not be reproduced or redisseminated in any form and may not be used as a basis for or a component of any financial instruments or products or indices. None of the MSCI information is intended to constitute investment advice or a recommendation to make (or refrain from making) any kind of investment decision and may not be relied on as such. Historical data and analysis should not be taken as an indication or guarantee of any future performance analysis, forecast or prediction. The MSCI information is provided on an “as is” basis and the user of this information assumes the entire risk of any use made of this information. MSCI, each of its affiliates and each other person involved in or related to compiling, computing or creating any MSCI information (collectively, the “MSCI Parties”) expressly disclaims all warranties (including, without limitation, any warranties of originality, accuracy, completeness, timeliness, non-infringement, merchantability and fitness for a particular purpose) with respect to this information. Without limiting any of the foregoing, in no event shall any MSCI Party have any liability for any direct, indirect, special, incidental, punitive, consequential (including, without limitation, lost profits) or any other damages. (www.msci.com)
Capital believes the software and information from FactSet to be reliable. However, Capital cannot be responsible for inaccuracies, incomplete information or updating of the information furnished by FactSet. The information provided in this report is meant to give you an approximate account of the fund/manager's characteristics for the specified date. This information is not indicative of future Capital investment decisions and is not used as part of our investment decision-making process.
Indices are unmanaged and cannot be invested in directly. Returns represent past performance, are not a guarantee of future performance, and are not indicative of any specific investment.
All Capital Group trademarks are owned by The Capital Group Companies, Inc. or an affiliated company in Canada, the U.S. and other countries. All other company names mentioned are the property of their respective companies.
Capital Group funds are offered in Canada by Capital International Asset Management (Canada), Inc., part of Capital Group, a global investment management firm originating in Los Angeles, California in 1931. Capital Group manages equity assets through three investment groups. These groups make investment and proxy voting decisions independently. Fixed income investment professionals provide fixed income research and investment management across the Capital organization; however, for securities with equity characteristics, they act solely on behalf of one of the three equity investment groups.
The Capital Group funds offered on this website are available only to Canadian residents.