Economic Indicators
 Darrell Spence
 Jody Jonsson
 Tom Cooney
 Chitrang Purani
There are many ways to describe the outlook for the U.S. and world economies. But at the midpoint of 2025, one word has risen to the top of the lexicon: uncertainty.
A lack of clarity over U.S. trade policy — with rising tariffs at the centre of the storm — has delivered a shock to the global economy. For the first time since 2022, U.S. GDP in the first quarter declined. Some companies stopped issuing forward guidance. Capital expenditures have been delayed. Cargo volumes have plummeted at major ports. Hiring has slowed.
As policy uncertainty rises, global economic growth projections are falling. Downward revisions have been issued for the U.S., Europe, Japan and many emerging markets, based on the latest available figures from the International Monetary Fund. Recent trade negotiations involving the U.S., Europe and China are encouraging but much remains to be done.
Economic growth projections are down across the board

Sources: International Monetary Fund, World Economic Outlook, April 2025. Reflects latest IMF projections as of May 31, 2025. Real GDP is adjusted for inflation, providing a more accurate measure of economic growth.
“Many companies are hitting the pause button because they don’t know what the rules are going to be a week, a month or a year from now,” Capital Group economist Darrell Spence explains. “Even if some tariffs are ultimately lowered or rescinded, this pause effect is going to have an impact. Whether that pushes us into a recession or not remains an open question, but it raises the risk significantly.”
In some ways, the uncertainty has become an economic data point that must be taken into account, much as we look at other hard data such as employment, consumer spending and business investment, Spence adds. “I think so much of forecasting the economy right now is a forecast of policy. And that’s difficult to do when the policy can change so quickly.”
Market volatility returns in force
Market volatility has risen sharply in the first half of the year as the U.S. launched a series of new tariffs against virtually every trading partner, including Canada, Mexico and China. In a now familiar pattern, the news shook stock and bond markets, followed by powerful rallies when the tariffs were later reduced or paused.
By the end of May, U.S. stocks — as represented by the S&P 500 Index — had recovered nearly all of the earlier losses as investors turned a favourable eye toward the prospects for revised trade deals.
“We probably reached a point of maximum uncertainty in April,” says Jody Jonsson, Capital Group vice chair and equity portfolio manager. That’s when the largest series of tariffs was announced on what President Donald Trump called Liberation Day. “Since then we’ve seen some encouraging progress. If we can resolve more of this uncertainty, markets may have a smoother ride in the second half of the year.”
Four scenarios for global realignment
Taking a step back and looking at the big picture, Jonsson observes that the world is clearly changing in ways we haven’t seen in decades. This global realignment — politically, militarily, economically — is disruptive and likely to remain so until a new order takes shape.
“We are in the middle of a fundamental restructuring of the geopolitical order as we’ve known it since the end of World War II,” she says. “The integrated global system we’ve come to rely on over the past several decades is rapidly changing, and it may look very different going forward.”
Capital Group’s Night Watch — a team of economists, political analysts and portfolio managers — is seeking to understand these changes through scenario analysis. Rather than make predictions, they identify a range of potential outcomes, then connect them to investment implications.
In their initial analysis, they’ve identified four large-scale scenarios that could play out in coming years as the world seeks a new equilibrium. A global trade war and shifting political alliances could slow global economic growth, boost inflation and raise the risk of a recession. On the other hand, swift and successful trade negotiations could spark a market rally.
A world in transition: Scenario planning for the future
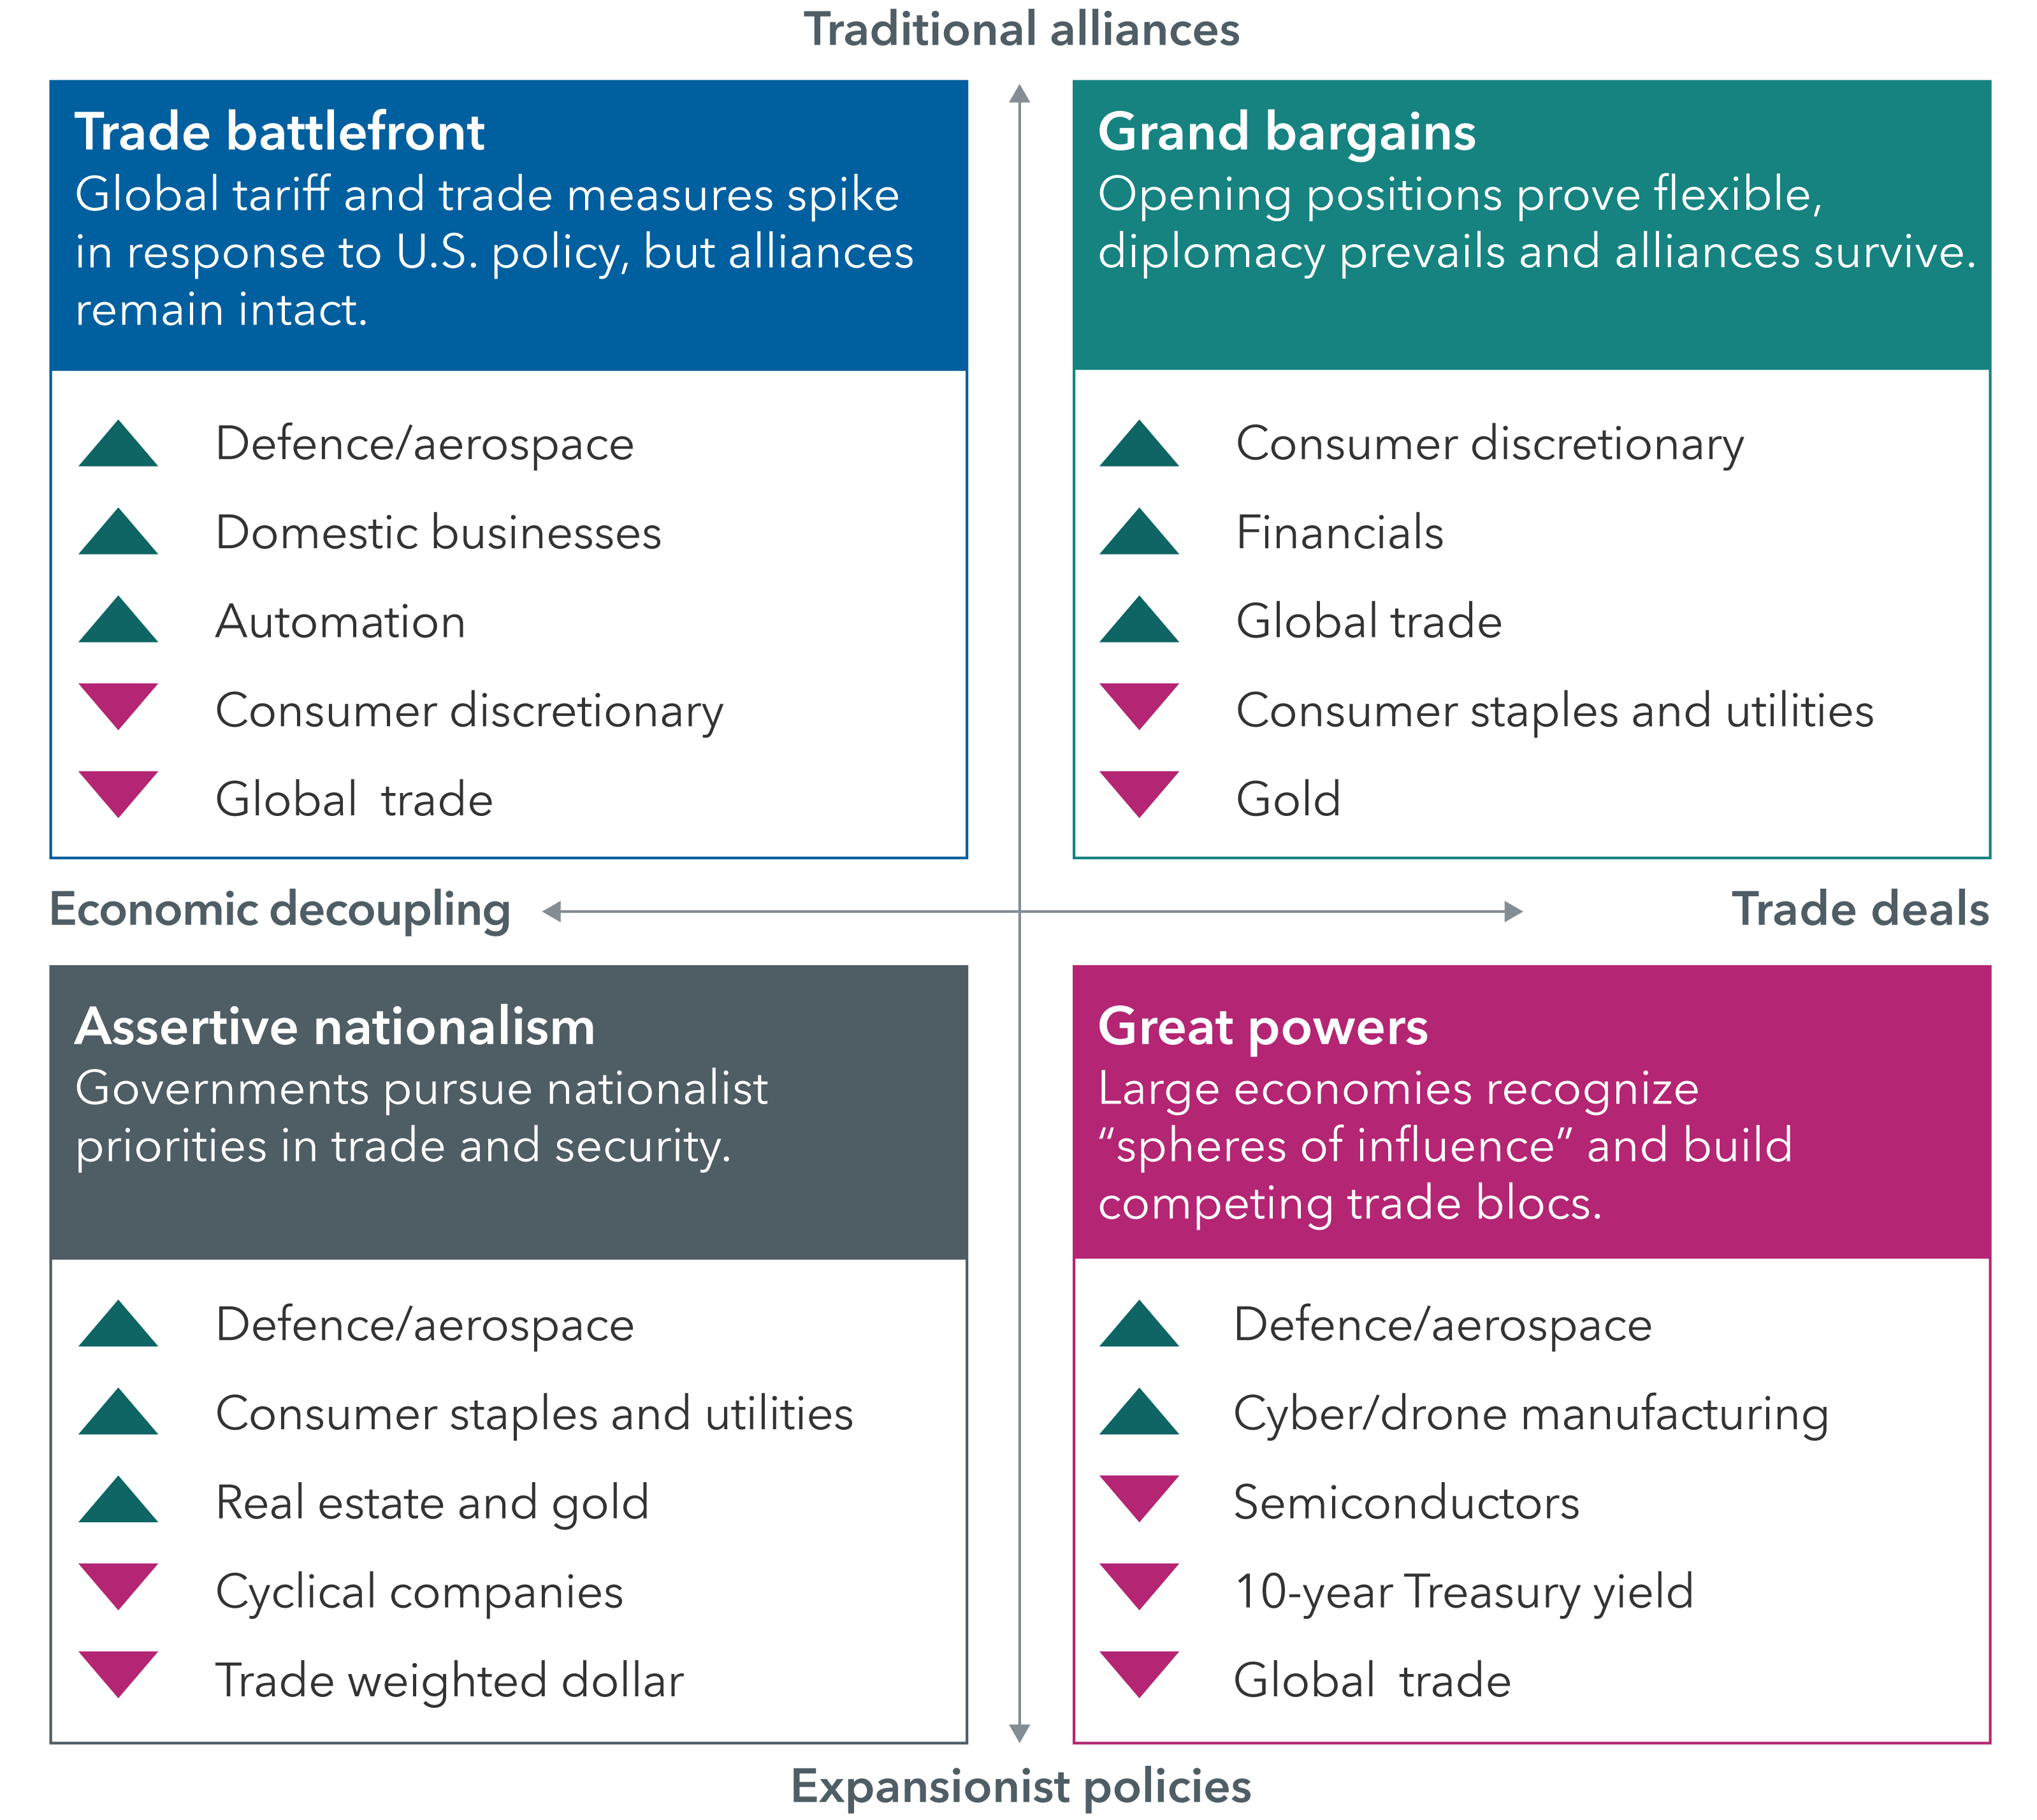
Source: Capital Group. Scenarios reflect analysis of Capital Group’s Night Watch team as of April 2025, and are not predictive of future outcomes.
Much depends on the outcome of trade negotiations currently underway. But given their complexity and the vast number of trading partners involved, it could take a long time to hammer out the details, says Tom Cooney, Capital Group’s international policy advisor and a former diplomat with the U.S. Department of State.
“It took many years to build the post-war order, and it could be many more before a new order emerges,” Cooney explains. “Trade deals, in particular, normally take several years to negotiate, so I think we have a long journey ahead of us.”
Will central banks come to the rescue?
Officials at the world’s major central banks — chiefly, the U.S. Federal Reserve and the European Central Bank — are watching closely as these events unfold. The ECB has already started cutting rates, and many investors believe the Fed will too, as tariffs threaten economic growth. However, rising consumer prices are making that decision difficult, since lower rates could reignite inflation.
In the U.S., inflation has remained stubbornly high in recent months, hovering around 2.5% to 3% on an annualized basis. That’s above the Fed’s 2% target. Even so, bond investors are expecting the Fed’s first rate cut of the year to come in July, followed by two or three more before the end of the year.
The U.S. Federal Reserve is expected to loosen monetary policy this summer
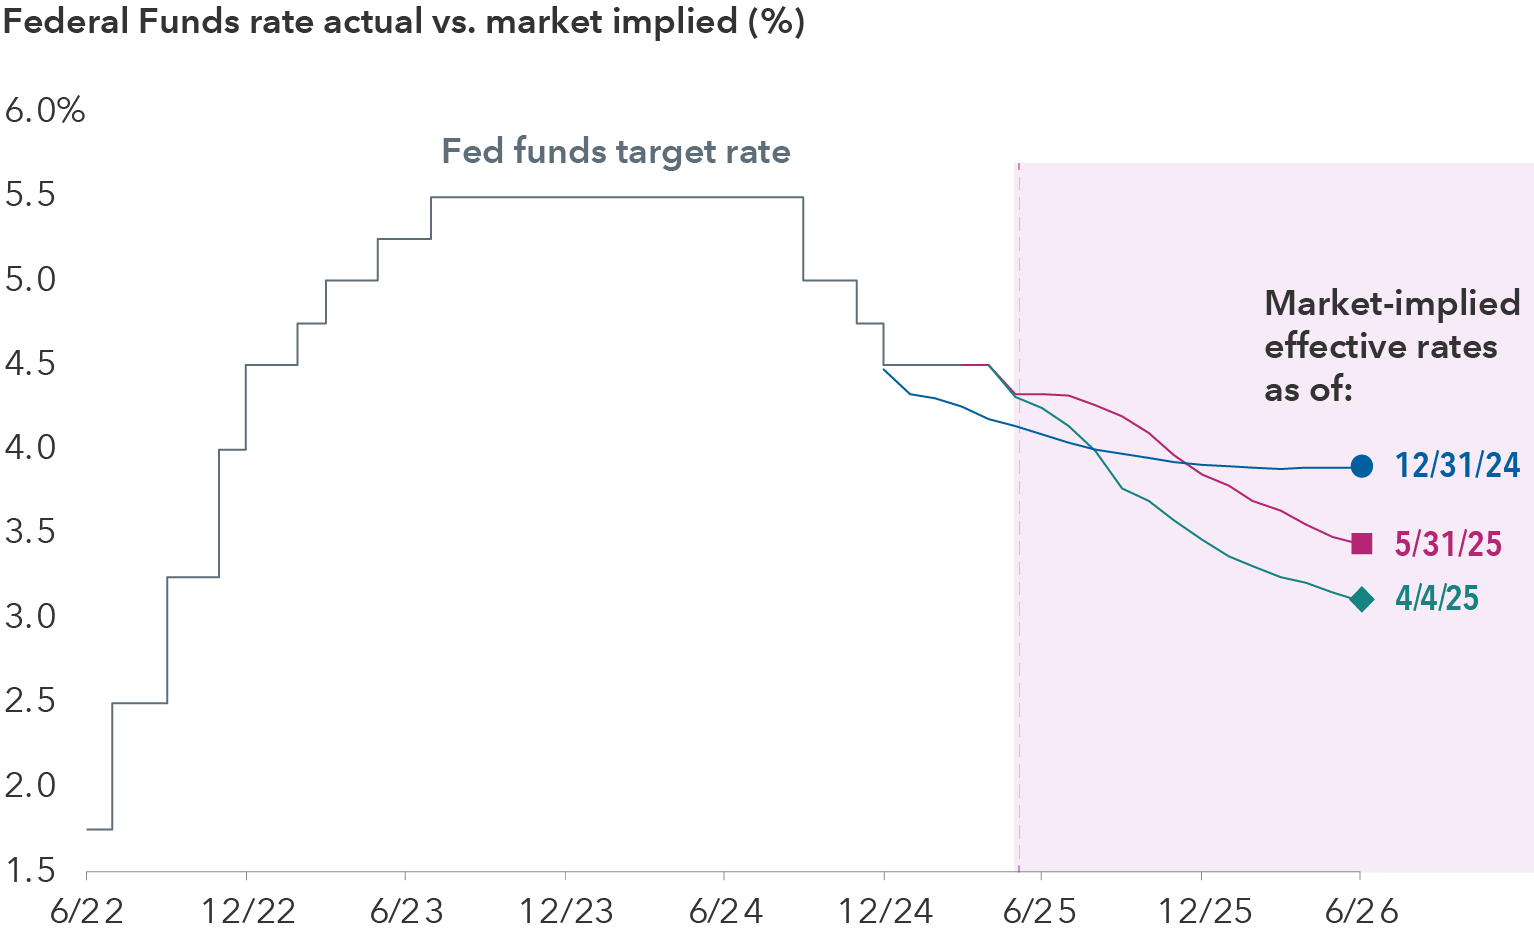
Sources: Capital Group, Bloomberg Index Services Ltd., U.S. Federal Reserve. Fed funds target rate reflects the upper bound of the Federal Open Markets Committee’s (FOMC) target range for overnight lending among U.S. banks. As of May 31, 2025.
“While the U.S. economy is showing some signs of slowing, employment remains strong, so the Fed probably isn’t likely to take action too quickly or too aggressively,” says fixed income portfolio manager Chitrang Purani.
“As long as labour markets don’t materially weaken, the Fed has good reason to stay patient with inflation remaining above target,” Purani explains. He views current market pricing of the federal funds rate at around 3.8% by the end of the year, down from roughly 4.3% today, as a fair level based on the balance of risks.
“I do expect U.S. growth and global growth to slow in the face of tariffs and trade war uncertainty,” he adds, “but I think it’s too early to call for a recession.”
How to avoid a recession
What needs to happen for the U.S. and the world to steer clear of an economic downturn?
There are already signs that it won’t happen right away. Most of the economic data we’ve seen so far suggests that the U.S. economy will expand in the second quarter, Spence says. A 6% rise for the S&P 500 Index in May also indicates that investors aren’t expecting an immediate tariff-induced downturn.
“If the largest culprit for triggering a recession is a trade war, then dialing back the trade war is obviously a helpful step,” Spence says. “And it has been dialed back in the past few weeks. To remove the uncertainty, however, I think we would need to see an announcement that the trade war is over. Otherwise, it may be difficult to convince businesses and consumers to move forward with confidence.”
S&P 500 Index is a market capitalization-weighted index based on the results of approximately 500 widely held common stocks.
Our latest insights
RELATED INSIGHTS
Commissions, trailing commissions, management fees and expenses all may be associated with investments in investment funds. Please read the prospectus before investing. Investment funds are not guaranteed or covered by the Canada Deposit Insurance Corporation or by any other government deposit insurer. For investment funds other than money market funds, their values change frequently. For money market funds, there can be no assurances that the fund will be able to maintain its net asset value per security at a constant amount or that the full amount of your investment in the fund will be returned to you. Past performance may not be repeated.
Unless otherwise indicated, the investment professionals featured do not manage Capital Group‘s Canadian investment funds.
References to particular companies or securities, if any, are included for informational or illustrative purposes only and should not be considered as an endorsement by Capital Group. Views expressed regarding a particular company, security, industry or market sector should not be considered an indication of trading intent of any investment funds or current holdings of any investment funds. These views should not be considered as investment advice nor should they be considered a recommendation to buy or sell.
Statements attributed to an individual represent the opinions of that individual as of the date published and do not necessarily reflect the opinions of Capital Group or its affiliates. This information is intended to highlight issues and not be comprehensive or to provide advice. For informational purposes only; not intended to provide tax, legal or financial advice. Capital Group funds are available in Canada through registered dealers. For more information, please consult your financial and tax advisors for your individual situation.
Forward-looking statements are not guarantees of future performance, and actual events and results could differ materially from those expressed or implied in any forward-looking statements made herein. We encourage you to consider these and other factors carefully before making any investment decisions and we urge you to avoid placing undue reliance on forward-looking statements.
The S&P 500 Composite Index (“Index”) is a product of S&P Dow Jones Indices LLC and/or its affiliates and has been licensed for use by Capital Group. Copyright © 2026 S&P Dow Jones Indices LLC, a division of S&P Global, and/or its affiliates. All rights reserved. Redistribution or reproduction in whole or in part are prohibited without written permission of S&P Dow Jones Indices LLC.
FTSE source: London Stock Exchange Group plc and its group undertakings (collectively, the "LSE Group"). © LSE Group 2026. FTSE Russell is a trading name of certain of the LSE Group companies. "FTSE®" is a trade mark of the relevant LSE Group companies and is used by any other LSE Group company under licence. All rights in the FTSE Russell indices or data vest in the relevant LSE Group company which owns the index or the data. Neither LSE Group nor its licensors accept any liability for any errors or omissions in the indices or data and no party may rely on any indices or data contained in this communication. No further distribution of data from the LSE Group is permitted without the relevant LSE Group company's express written consent. The LSE Group does not promote, sponsor or endorse the content of this communication. The index is unmanaged and cannot be invested in directly.
BLOOMBERG® is a trademark and service mark of Bloomberg Finance L.P. and its affiliates (collectively “Bloomberg”). Bloomberg or Bloomberg’s licensors own all proprietary rights in the Bloomberg Indices. Neither Bloomberg nor Bloomberg’s licensors approves or endorses this material, or guarantees the accuracy or completeness of any information herein, or makes any warranty, express or implied, as to the results to be obtained therefrom and, to the maximum extent allowed by law, neither shall have any liability or responsibility for injury or damages arising in connection therewith.
The MSCI information may only be used for your internal use, may not be reproduced or redisseminated in any form and may not be used as a basis for or a component of any financial instruments or products or indices. None of the MSCI information is intended to constitute investment advice or a recommendation to make (or refrain from making) any kind of investment decision and may not be relied on as such. Historical data and analysis should not be taken as an indication or guarantee of any future performance analysis, forecast or prediction. The MSCI information is provided on an “as is” basis and the user of this information assumes the entire risk of any use made of this information. MSCI, each of its affiliates and each other person involved in or related to compiling, computing or creating any MSCI information (collectively, the “MSCI Parties”) expressly disclaims all warranties (including, without limitation, any warranties of originality, accuracy, completeness, timeliness, non-infringement, merchantability and fitness for a particular purpose) with respect to this information. Without limiting any of the foregoing, in no event shall any MSCI Party have any liability for any direct, indirect, special, incidental, punitive, consequential (including, without limitation, lost profits) or any other damages. (www.msci.com)
Capital believes the software and information from FactSet to be reliable. However, Capital cannot be responsible for inaccuracies, incomplete information or updating of the information furnished by FactSet. The information provided in this report is meant to give you an approximate account of the fund/manager's characteristics for the specified date. This information is not indicative of future Capital investment decisions and is not used as part of our investment decision-making process.
Indices are unmanaged and cannot be invested in directly. Returns represent past performance, are not a guarantee of future performance, and are not indicative of any specific investment.
All Capital Group trademarks are owned by The Capital Group Companies, Inc. or an affiliated company in Canada, the U.S. and other countries. All other company names mentioned are the property of their respective companies.
Capital Group funds are offered in Canada by Capital International Asset Management (Canada), Inc., part of Capital Group, a global investment management firm originating in Los Angeles, California in 1931. Capital Group manages equity assets through three investment groups. These groups make investment and proxy voting decisions independently. Fixed income investment professionals provide fixed income research and investment management across the Capital organization; however, for securities with equity characteristics, they act solely on behalf of one of the three equity investment groups.
The Capital Group funds offered on this website are available only to Canadian residents.