Active Management
Categories
Economic Indicators
Macro outlook: Less uncertainty, healthy growth
 Brady Enright
 Jared Franz
 Tryggvi Gudmundsson
 Darrell Spence
December 4, 2025
If 2025 was the year that tariff-induced uncertainty upended the outlook for the global economy, 2026 could be the year that things come back into focus.
Investors should expect greater stability in the year ahead as global trade disputes subside, government stimulus measures kick in, interest rates move lower, and the boom in artificial intelligence spending continues to drive economic growth.
“The economy has been pushing through several headwinds,” says portfolio manager Brady Enright, citing rising tariffs, relatively high interest rates, and the recent U.S. government shutdown, among other challenging events. “I think there is a case that the economic backdrop improves considerably in 2026.”
The global economy shows its resilience
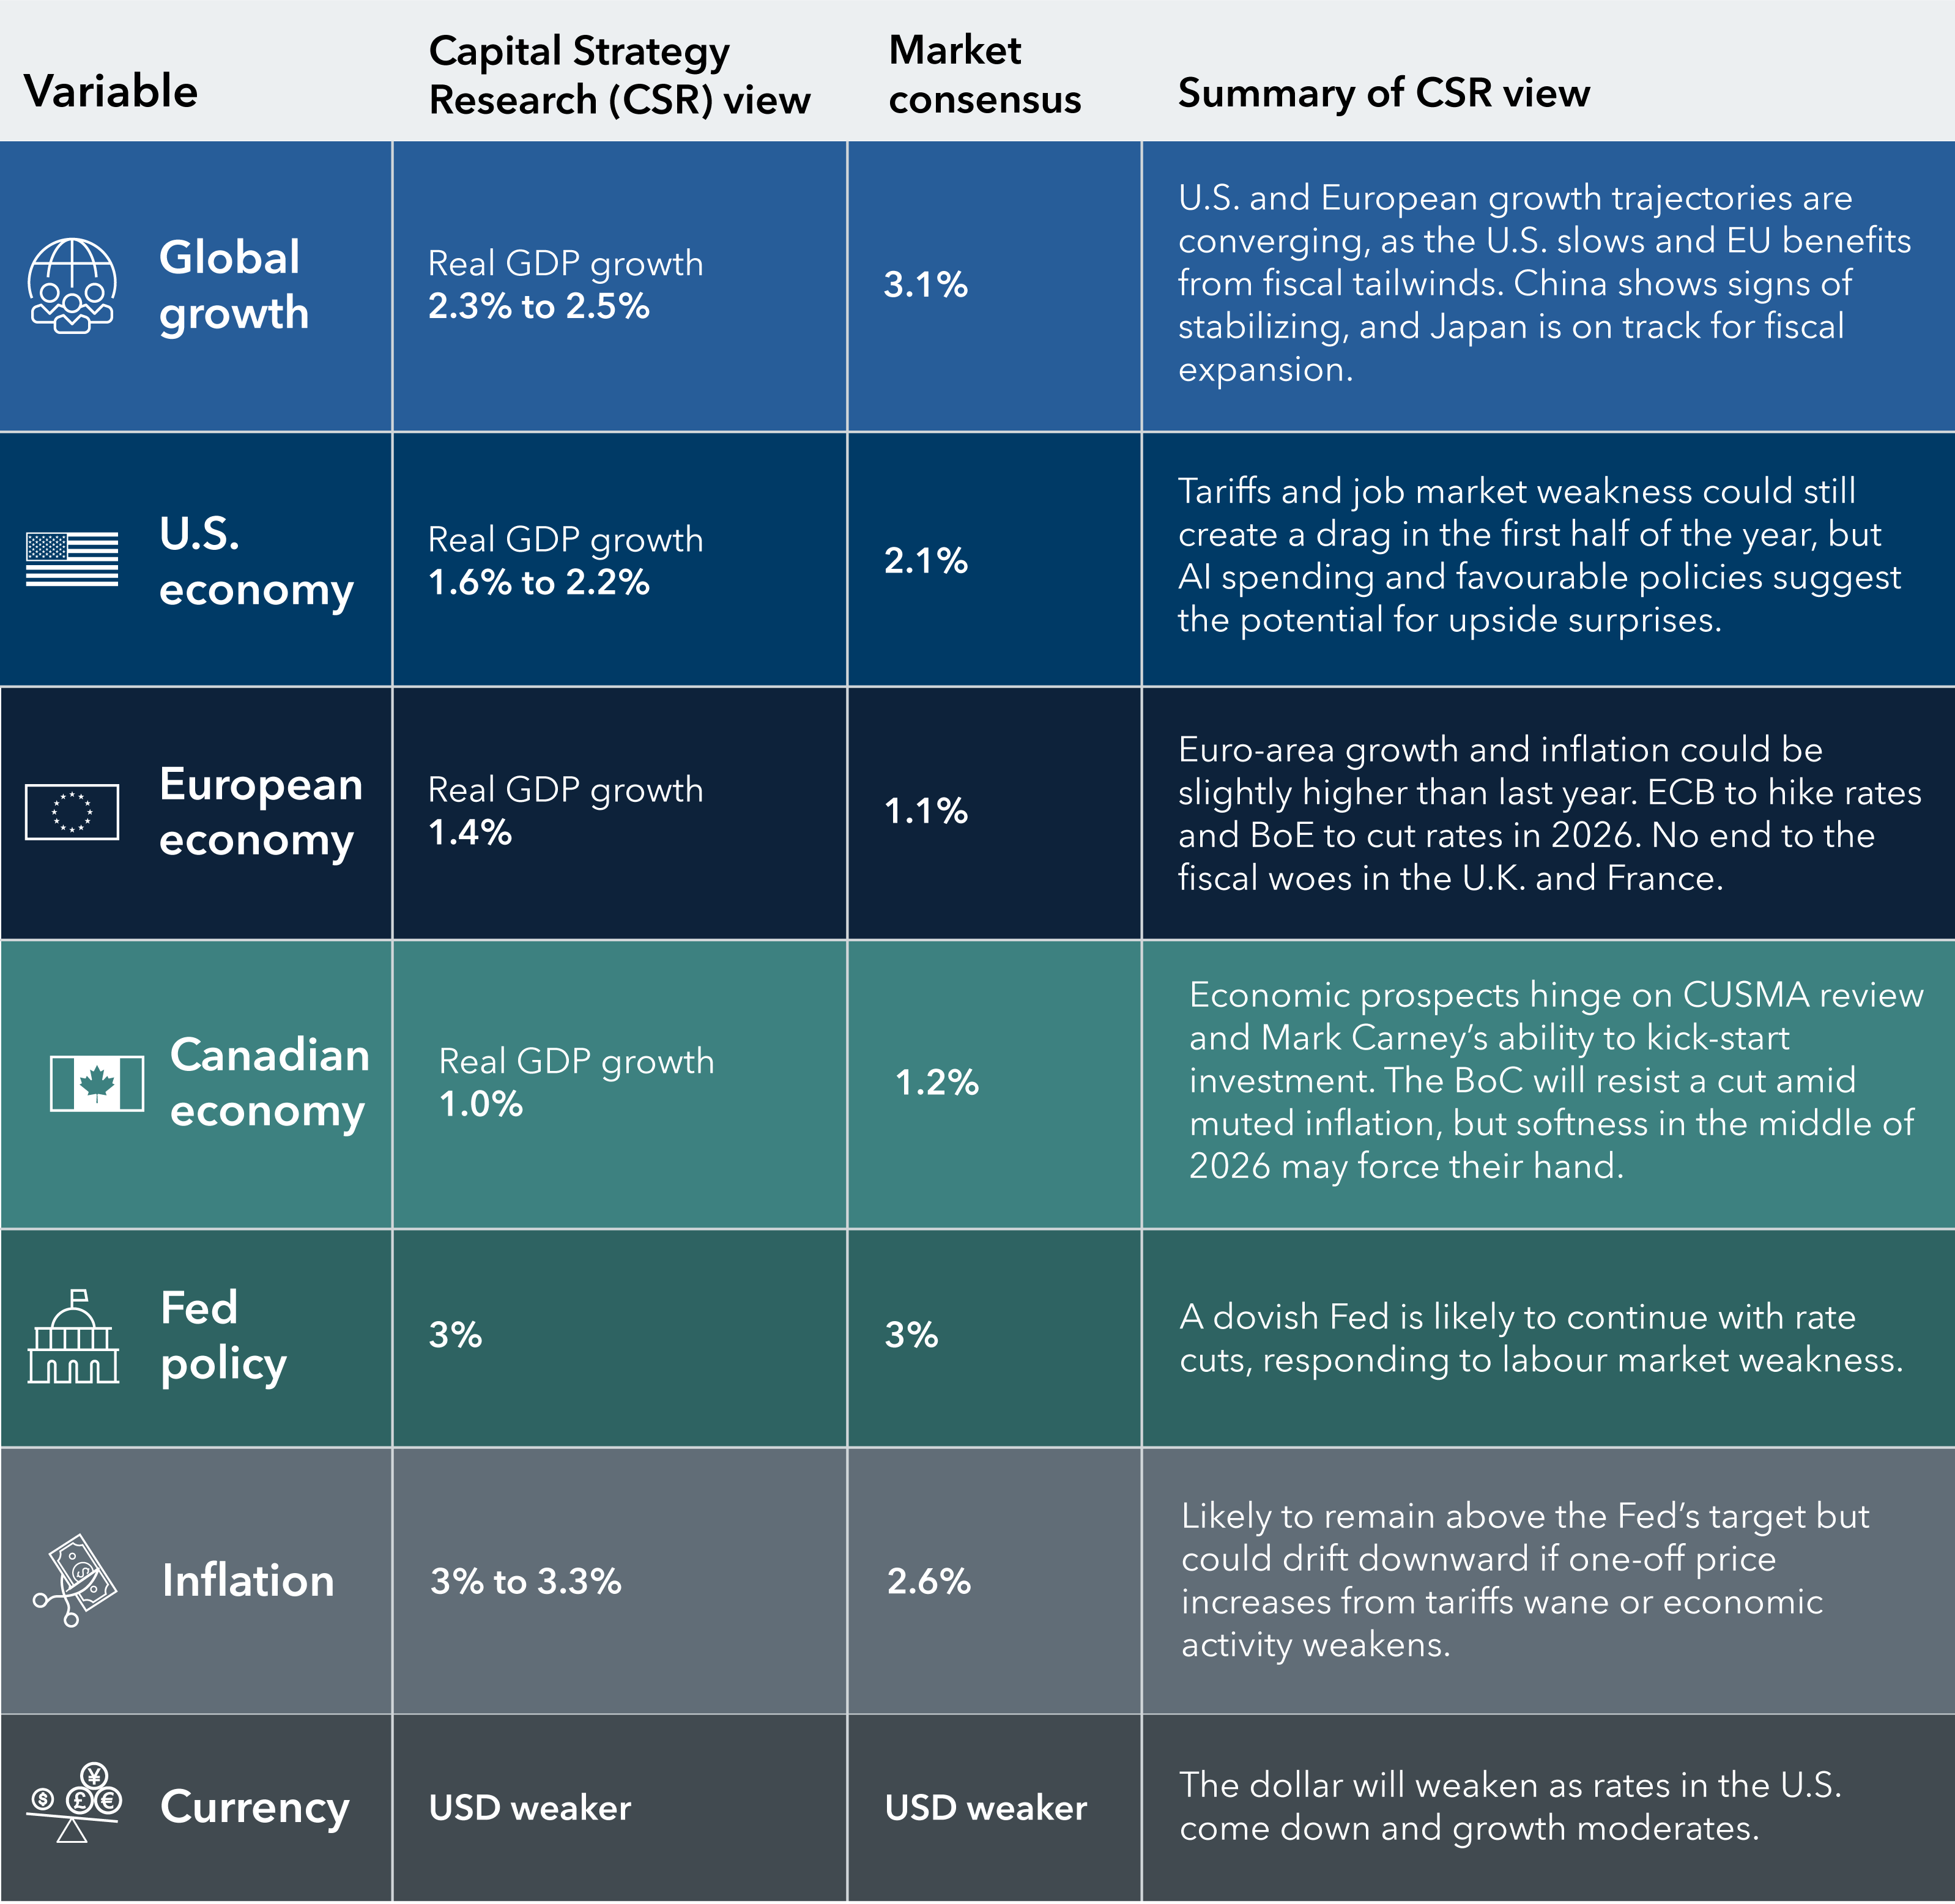
Sources: Capital Group, National Association for Business Economics, International Monetary Fund World Economic Outlook October 2025 (published October 14). Market consensus refers to the general views, expectations or forecasts of market participants about key economic, financial or market metrics. ECB: European Central Bank, GDP: gross domestic product, BoE: Bank of England, BoC: Bank of Canada, CUSMA: Canada-United States-Mexico Agreement. Figures reflect latest available data as of November 30, 2025.
Indeed, consensus estimates for global economic growth are positive across the board despite expectations for lingering trade disputes, geopolitical conflicts and elevated inflation. Worldwide, real GDP growth is projected to hit 3.1% on a full-year basis in 2026, according to the International Monetary Fund (IMF).
The Canadian economy is expected to grow modestly with GDP expected to rise about 1%, held back by the impact of tariffs, reduced immigration and ongoing business uncertainty.
“The labour market is projected to improve only gradually next year, and inflation should remain near target, though the forecast of 2.1% for next year appears slightly elevated,” says economist Tryggvi Gudmundsson.
According to him, the key themes to watch in 2026 will be the CUSMA review and efforts by the Carney administration to stimulate investment. When it comes to rate hikes, Gudmundsson thinks the Bank of Canada will resist cutting rates next year, but mid-year softness could compel action.
The U.S. economy could grow about 2.0% as AI-related spending and government stimulus measures provide support while the labour market weakens and higher tariffs reduce trade activity. Emerging markets, led by China, are expected to produce the strongest growth rates, aggregating to 4% in 2026, based on IMF projections, while the European economy comes in around 1.1%, supported by higher spending on national defence and infrastructure.
Capital Group economists are slightly less optimistic about the prospects for the global economy, but they still expect to see solid growth in the U.S., Europe, Japan and most emerging markets. That’s primarily due to more clarity on U.S. tariffs and trade policy, compared to earlier in the year.
“The clearer picture on tariffs should free up businesses to make capital decisions, like investing in reshoring supply chains,” says economist Jared Franz.
Less policy uncertainty should support business confidence

Sources: Capital Group, Bloomberg, RIMES, Standard & Poor’s. Bloomberg U.S. Economic Policy Uncertainty (EPU) Index data is calculated as a rolling seven-day average using daily index values. S&P 500 returns calculated as total returns. Data as of November 30, 2025.
U.S. trade policy whipsawed financial markets this year, but 2026 could be less eventful given recent trade deals announced between the U.S., Europe and Japan, among other countries. That’s a big change from April, when President Trump unleashed the highest tariffs in nearly 100 years against every U.S. trading partner in what he called “Liberation Day.” Stocks initially fell sharply, then reversed course and staged a remarkable months-long rally.
How that happened remains up for debate. But part of the explanation is that policy uncertainty gradually declined over the ensuing months as world leaders hammered out trade deals, Trump backed away from some threats, and investors concluded that tariff rates might not be as onerous as previously expected. In fact, the actual effective U.S. tariff rate has hovered around 11% in recent months, far lower than anticipated.
U.S. recession worries, widespread in April, have calmed and markets have reflected that shift. This positive investor sentiment could continue to boost stocks in 2026 as the U.S. economy avoids a downturn and grows at a moderate pace.
“It would probably take something akin to ‘Liberation Day: Part Two’ to really sink the U.S. economy,” says economist Tryggvi Gudmundsson. “Policy uncertainty has dissipated, and markets have moved on. While it’s likely that trade drama will flare up as new tariffs emerge, it will hopefully come with fewer market fireworks.”
Company profits are expected to rise across the globe

Sources: Capital Group, FactSet, MSCI, Standard & Poor’s. Estimated annual earnings growth is represented by the mean consensus earnings per share estimates for the years ending December 2025 and 2026, respectfully, across the S&P 500 Index (U.S.), the MSCI Europe Index (Europe), the MSCI Japan Index (Japan), the MSCI Emerging Markets Index (Emerging markets) and MSCI China Index (China). Estimates are as of November 30, 2025.
Generally favourable macroeconomic conditions are providing a positive backdrop for corporate earnings in 2026. Consensus earnings estimates for the new year are looking brighter as the U.S. Federal Reserve seeks to reduce interest rates, government spending fuels industrial activity, and many companies plan to resume major capital expenditures (CapEx) now that tariff levels are better known. The AI boom is a significant driver of CapEx expansion, spurring strong demand for computer chips, data centres and related spending.
Companies based in emerging markets are expected to enjoy the strongest earnings growth, rising 17.2%, while the United States comes in just over 14% and Europe slightly above 11%, based on FactSet earnings estimates as of November 30, 2025.
Looking ahead, there are tailwinds that should drive earnings growth and support market gains beyond the technology sector, but ultimately what’s going to matter is corporate earnings growth.
Investors should expect occasional market downturns
Although there are many encouraging signs for the year ahead, there are also clear risks on the horizon, and investors should prepare for inevitable market pullbacks.
For starters, stocks are expensive. Most equity markets around the world generated strong returns from 2023 to 2025. While company earnings have generally been solid, price-to-earnings ratios (the ratio of a company’s share price to the company’s earnings per share) for U.S., developed international and emerging markets were all above their 10-year averages at the end of September 2025.
Valuations are elevated across global markets
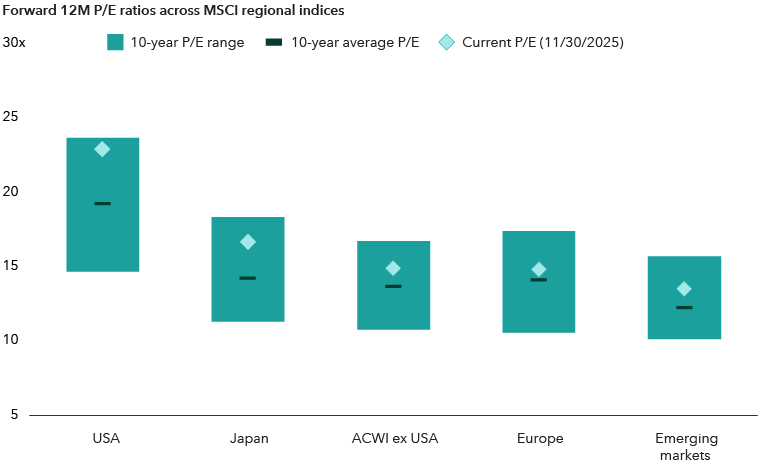
Sources: Capital Group, MSCI, RIMES. As of November 30, 2025. Countries and regions shown are represented by their respective MSCI indices. Forward 12-month price-to-earnings (12M P/E) ratios based on latest consensus estimates. The forward P/E ratio divides the current share price of a company by the estimated future earnings per share of that company.
Sticky inflation and mounting government debt in the U.S., Europe and elsewhere are also cause for concern. Aggressive stimulus measures to support economic growth will only contribute to debt levels, with the total for the U.S. expected to exceed 140% of GDP by 2030, according to IMF projections.
Keep in mind, stock market declines are regular occurrences. The S&P 500 Index has experienced market corrections, or declines of 10 percent or more, about once every 16 months. Whereas the index has had bear markets, or declines of 20 percent or more, about once every six years, based on market data from 1954 to 2025.
“The optimism priced into markets doesn’t leave a lot of room for disappointment,” says economist Darrell Spence. “There will almost always be the unanticipated surprises that occur every year, even when the outlook is positive.”
Learn more about
The views of individual portfolio managers and analysts may differ from Capital Strategy Research views.
Gross domestic product (GDP) is the market value of the goods and services produced by labor and property located in the United States for one year.
Bloomberg U.S. Economic Policy Uncertainty Index measures U.S. economic policy uncertainty by counting newspaper articles on the topic.
MSCI USA Index is a free float-adjusted, market capitalization-weighted index designed to measure the performance of the large- and mid-cap segments of the U.S. market. MSCI All Country World Index (ACWI) ex USA is a free float-adjusted market capitalization-weighted index designed to measure equity market results in the global developed and emerging markets, excluding the United States. MSCI China Index captures large- and mid-cap representation across China A shares, H shares, B shares, Red chips, P chips and foreign listings (e.g., ADRs). MSCI Emerging Markets Index captures large- and mid-cap representation across 27 emerging markets (EM) countries. MSCI Europe Index is designed to measure developed equity market results across 15 developed countries in Europe. MSCI Japan Index is a free float-adjusted market capitalization-weighted index designed to measure the equity market results of Japan.
The S&P 500 Index is a market capitalization-weighted index based on the results of approximately 500 widely held common stocks.
Our latest insights
RELATED INSIGHTS
-
-
Market Volatility
-
Global Equities
Commissions, trailing commissions, management fees and expenses all may be associated with investments in investment funds. Please read the prospectus before investing. Investment funds are not guaranteed or covered by the Canada Deposit Insurance Corporation or by any other government deposit insurer. For investment funds other than money market funds, their values change frequently. For money market funds, there can be no assurances that the fund will be able to maintain its net asset value per security at a constant amount or that the full amount of your investment in the fund will be returned to you. Past performance may not be repeated.
Unless otherwise indicated, the investment professionals featured do not manage Capital Group‘s Canadian investment funds.
References to particular companies or securities, if any, are included for informational or illustrative purposes only and should not be considered as an endorsement by Capital Group. Views expressed regarding a particular company, security, industry or market sector should not be considered an indication of trading intent of any investment funds or current holdings of any investment funds. These views should not be considered as investment advice nor should they be considered a recommendation to buy or sell.
Statements attributed to an individual represent the opinions of that individual as of the date published and do not necessarily reflect the opinions of Capital Group or its affiliates. This information is intended to highlight issues and not be comprehensive or to provide advice. For informational purposes only; not intended to provide tax, legal or financial advice. Capital Group funds are available in Canada through registered dealers. For more information, please consult your financial and tax advisors for your individual situation.
Forward-looking statements are not guarantees of future performance, and actual events and results could differ materially from those expressed or implied in any forward-looking statements made herein. We encourage you to consider these and other factors carefully before making any investment decisions and we urge you to avoid placing undue reliance on forward-looking statements.
The S&P 500 Composite Index (“Index”) is a product of S&P Dow Jones Indices LLC and/or its affiliates and has been licensed for use by Capital Group. Copyright © 2026 S&P Dow Jones Indices LLC, a division of S&P Global, and/or its affiliates. All rights reserved. Redistribution or reproduction in whole or in part are prohibited without written permission of S&P Dow Jones Indices LLC.
FTSE source: London Stock Exchange Group plc and its group undertakings (collectively, the "LSE Group"). © LSE Group 2026. FTSE Russell is a trading name of certain of the LSE Group companies. "FTSE®" is a trade mark of the relevant LSE Group companies and is used by any other LSE Group company under licence. All rights in the FTSE Russell indices or data vest in the relevant LSE Group company which owns the index or the data. Neither LSE Group nor its licensors accept any liability for any errors or omissions in the indices or data and no party may rely on any indices or data contained in this communication. No further distribution of data from the LSE Group is permitted without the relevant LSE Group company's express written consent. The LSE Group does not promote, sponsor or endorse the content of this communication. The index is unmanaged and cannot be invested in directly.
BLOOMBERG® is a trademark and service mark of Bloomberg Finance L.P. and its affiliates (collectively “Bloomberg”). Bloomberg or Bloomberg’s licensors own all proprietary rights in the Bloomberg Indices. Neither Bloomberg nor Bloomberg’s licensors approves or endorses this material, or guarantees the accuracy or completeness of any information herein, or makes any warranty, express or implied, as to the results to be obtained therefrom and, to the maximum extent allowed by law, neither shall have any liability or responsibility for injury or damages arising in connection therewith.
The MSCI information may only be used for your internal use, may not be reproduced or redisseminated in any form and may not be used as a basis for or a component of any financial instruments or products or indices. None of the MSCI information is intended to constitute investment advice or a recommendation to make (or refrain from making) any kind of investment decision and may not be relied on as such. Historical data and analysis should not be taken as an indication or guarantee of any future performance analysis, forecast or prediction. The MSCI information is provided on an “as is” basis and the user of this information assumes the entire risk of any use made of this information. MSCI, each of its affiliates and each other person involved in or related to compiling, computing or creating any MSCI information (collectively, the “MSCI Parties”) expressly disclaims all warranties (including, without limitation, any warranties of originality, accuracy, completeness, timeliness, non-infringement, merchantability and fitness for a particular purpose) with respect to this information. Without limiting any of the foregoing, in no event shall any MSCI Party have any liability for any direct, indirect, special, incidental, punitive, consequential (including, without limitation, lost profits) or any other damages. (www.msci.com)
Capital believes the software and information from FactSet to be reliable. However, Capital cannot be responsible for inaccuracies, incomplete information or updating of the information furnished by FactSet. The information provided in this report is meant to give you an approximate account of the fund/manager's characteristics for the specified date. This information is not indicative of future Capital investment decisions and is not used as part of our investment decision-making process.
Indices are unmanaged and cannot be invested in directly. Returns represent past performance, are not a guarantee of future performance, and are not indicative of any specific investment.
All Capital Group trademarks are owned by The Capital Group Companies, Inc. or an affiliated company in Canada, the U.S. and other countries. All other company names mentioned are the property of their respective companies.
Capital Group funds are offered in Canada by Capital International Asset Management (Canada), Inc., part of Capital Group, a global investment management firm originating in Los Angeles, California in 1931. Capital Group manages equity assets through three investment groups. These groups make investment and proxy voting decisions independently. Fixed income investment professionals provide fixed income research and investment management across the Capital organization; however, for securities with equity characteristics, they act solely on behalf of one of the three equity investment groups.
The Capital Group funds offered on this website are available only to Canadian residents.