Important information

This website is for Financial Intermediaries in Switzerland only.


If you are an Individual Investor click here, if you are an Institutional Investor click here. Should you be looking for information for another location, please click here.


By clicking, you acknowledge that you have fully understood and accepted the Legal and Regulatory Information.

Elections How US midterm elections affect the markets

With everything happening in the world — from the US push to annex Greenland, to new tariffs against Europe, to military intervention in Venezuela — investors may not be focused on the US midterm elections just yet. But this pivotal contest is just 10 months away, and the campaign starts in earnest next month when President Donald Trump delivers the State of the Union Address.


“Trump will use the State of the Union, where he commands a massive audience, to kick off the 2026 campaign,” says Capital Group political economist Matt Miller. “He will lay out a narrative and policy agenda designed to help the Republican Party defy the normal setback that we would expect to see for a president in the midterm elections.”


The key question for investors is: How might the midterms influence the stock market?

The president’s party typically loses seats in Congress

Net change in House of Representatives seats controlled by president’s party after midterm elections

A bar chart showing the number of U.S. House of Representative seats gained or lost during midterm elections from 1934 to 2022. Notably, the incumbent has lost seats in all midterm elections except for three.

Sources: Capital Group, UCSB: The American Presidency Project. As of 15 January 2026.

Midterm elections occur at the midpoint of a presidential term in November, and usually result in the president’s party losing ground in Congress. Over the past 23 midterm elections, the president’s party has lost an average 27 seats in the House of Representatives and three in the Senate. Only twice has the president’s party gained seats in both chambers.


This tends to happen for two reasons. First, supporters of the party not in power — in this case, the Democratic Party — usually are more motivated to boost voter turnout. Second, the president’s approval rating typically dips during the first two years in office, as it has with Trump, which can influence swing voters and frustrated constituents.


Republicans currently control both the Senate and House by slim margins. Losing either chamber would effectively end any chance to pass ambitious Republican-sponsored legislation over the next two years, and it would put Trump on the defensive for the remainder of his term in office, Miller explains.


Since losing seats is so common, it is usually priced into the markets early in the year. But the extent of a political power shift and resulting policy impacts remain unclear until later in the year, which can explain other interesting trends.


History suggests lower returns and higher volatility


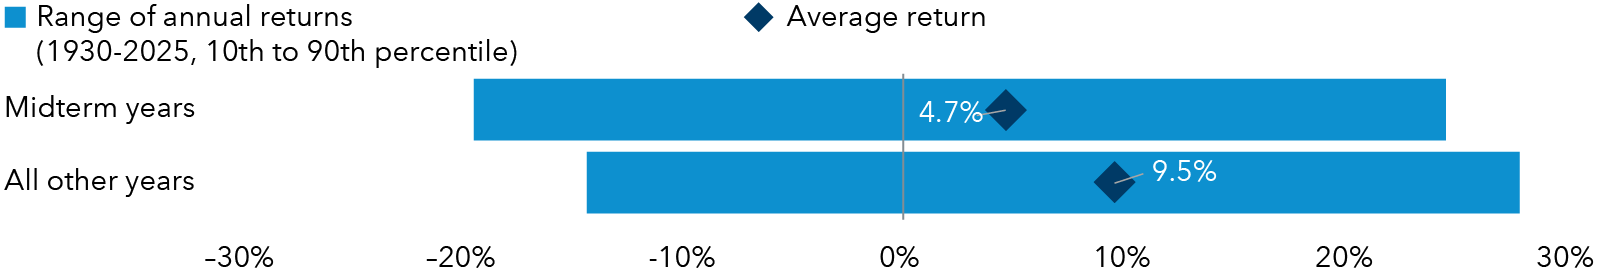
Capital Group examined more than 90 years of data and found that markets tend to behave differently during midterm election years. Our analysis of returns for the S&P 500 Index since 1930 revealed that the path of stocks during midterm election years differs noticeably compared to other years.


Since markets have typically gone up over long periods of time, the average stock movement during an average year should steadily increase. But we found that in the initial months of midterm election years, stocks have tended to generate lower average returns and often gained little ground until shortly before the election.

Market returns have lagged in midterm election years

S&P 500 Index total returns

A bar chart which shows the 10th to 90th percentile ranges of S&P 500 total returns from 1930 to 2022 for midterm and non‑midterm years, with average returns labeled. Midterm years average 4.7 percent, well below the 9.5 percent average for non‑midterm years.

Past results are not a guarantee of future results.

Sources: Capital Group, RIMES, Standard & Poor's. As of 15 January 2026.

Markets do not like uncertainty — and that adage seems to apply here. Earlier in the year, there is less certainty about the election’s outcome and impact. But markets have tended to rally in the weeks before an election, and they have continued to rise after the polls close.


In 2025, the S&P 500 Index enjoyed a solid return of nearly 18%; however, it significantly lagged other major markets around the world. The MSCI Europe Index returned more than 35%. The MSCI Japan Index gained 24%. And the MSCI Emerging Markets Index was up nearly 34%.


Despite election-related uncertainty, investors should consider the cost of sitting on the sidelines or trying to time the market. Historically speaking, staying invested has been the smartest move. The path of stocks varies greatly each election cycle, but the overall long-term trend of markets has been positive.

Political uncertainty has dampened returns in midterm years

S&P 500 Index average returns since 1931

A line chart comparing average S&P 500 year‑to‑date returns in midterm election years versus all other years from January through December, beginning in 1931. The "all other years" line trends steadily higher throughout the year, while the midterm‑year line hovers between +1% and negative 2% until late in the year, before rising in November and December.

Past results are not a guarantee of future results.

Sources: Capital Group, RIMES, Standard & Poor’s. The chart shows the average trajectory of cumulative price returns for the S&P 500 Index throughout midterm election years compared to non-midterm election years. Each point on the lines represents the average year-to-date return as of that particular month and day, and is calculated using daily price returns from 1 January 1931 to 31 December 2025.

That said, there is no question that election season can be tough on the nerves. Candidates often draw attention to the country’s problems, and campaigns regularly amplify negative messages. Policy proposals may be unclear and often target specific industries or companies.


It may come as no surprise then that market volatility is higher in midterm years, especially in the weeks leading up to the election. Since 1970, midterm years have a median standard deviation of returns of nearly 16%, compared with 13% in all other years.

Midterm election years have come with higher volatility

A bar chart comparing S&P 500 monthly average annualized volatility from 1970 to 2025 in midterm election years versus non‑midterm years. It shows that the months leading up to Election Day in midterm years exhibit higher average annualized volatility than non‑election years.

Sources: Capital Group, RIMES, Standard & Poor's. Volatility is calculated using the standard deviation of daily returns for each individual month. The median volatility for each month is then displayed in the chart on an annualised basis. Standard deviation is a measure of how returns over time have varied from the average. As of 31 December 2025.

“I don’t think this election will be any different,” says Chris Buchbinder, an equity portfolio manager. “There may be bumps in the road, and investors should brace for short-term volatility, but I don’t expect the election results to be a huge driver of investment outcomes one way or the other.”


Post-midterm market returns have been strong


The silver lining for investors is that markets have tended to rebound strongly after Election Day. Above-average returns have been typical for the full year following an election cycle. Since 1950, the average one-year return following a midterm election was 15.4%. That is nearly twice the return of all other years during a similar period.

S&P 500 Index price return one year after midterm election

A horizontal bar chart with one‑year returns for the S&P 500 following every U.S. midterm election from 1950 through 2023. The chart highlights that there has not been a single negative one‑year return after any midterm election during this period.

Past results are not a guarantee of future results.

Sources: Capital Group, RIMES, Standard & Poor's. Calculations use Election Day as the starting date in all election years and November 5th as a proxy for the starting date in other years. Only midterm election years are shown in the chart. As of 15 January 2026.

Every cycle is different though, and elections are just one of many factors influencing market returns. For example, investors will need to weigh the potential impacts of tariffs, inflation, and interest rates, as well as global economic growth and geopolitical conflicts.


The bottom line for investors


There is certainly nothing wrong with wanting your preferred candidate to win, but investors can run into trouble if they place too much importance on election results. That’s because, historically, elections have had little impact on long-term investment returns. Going back to 1933, markets have averaged double-digit returns during various government-control scenarios, including when a single party controlled the White House and both chambers of Congress, a split Congress, and when the president’s opposing party controls Congress.


Midterm elections — and politics as a whole — generate a lot of noise and uncertainty.


Even if elections spur higher volatility, there is no need to fear them. The reality is that long-term equity returns are driven by the earnings and perceived value of individual companies over time. Investors would be wise to look past the short-term highs and lows and maintain a long-term focus, regardless of which way the political winds may shift in any given year.

Matt Miller is a political economist with 35 years of experience and has been with Capital for 10 years (as of 12/31/2025). He holds a law degree from Columbia and a bachelor's from Brown University.

Chris Buchbinder is an equity portfolio manager with 30 years of investment industry experience (as of 12/31/2025). He holds a bachelor’s degree in economics and international relations from Brown University.

Past results are not predictive of results in future periods. It is not possible to invest directly in an index, which is unmanaged. The value of investments and income from them can go down as well as up and you may lose some or all of your initial investment. This information is not intended to provide investment, tax or other advice, or to be a solicitation to buy or sell any securities.
 
Statements attributed to an individual represent the opinions of that individual as of the date published and do not necessarily reflect the opinions of Capital Group or its affiliates. All information is as at the date indicated unless otherwise stated. Some information may have been obtained from third parties, and as such the reliability of that information is not guaranteed.
 
Capital Group manages equity assets through three investment groups. These groups make investment and proxy voting decisions independently. Fixed income investment professionals provide fixed income research and investment management across the Capital organisation; however, for securities with equity characteristics, they act solely on behalf of one of the three equity investment groups.