Municipal Bonds
 Greg Ortman
 Aditi Gupta
 Neil Amirtha
- The loss of revenue stemming from COVID-19 has left many states struggling with funding, though large-scale municipal defaults or bankruptcies are unlikely.
- Since the bulk of state funds are spent on education and health care, those sectors are likely to feel the greatest impact from revenue loss.
- Given expected low interest rates and tax rates that may increase, municipal bonds can offer attractive, high-quality, tax-efficient income.
Declines in employment, output and consumption in the face of COVID-19 have left many states and municipalities struggling with funding just as they face higher spending needs. Nonetheless, the rarity of municipal bankruptcies and defaults — considered alongside the robust federal support pledged — suggests there’s room for optimism in the municipal bond outlook.
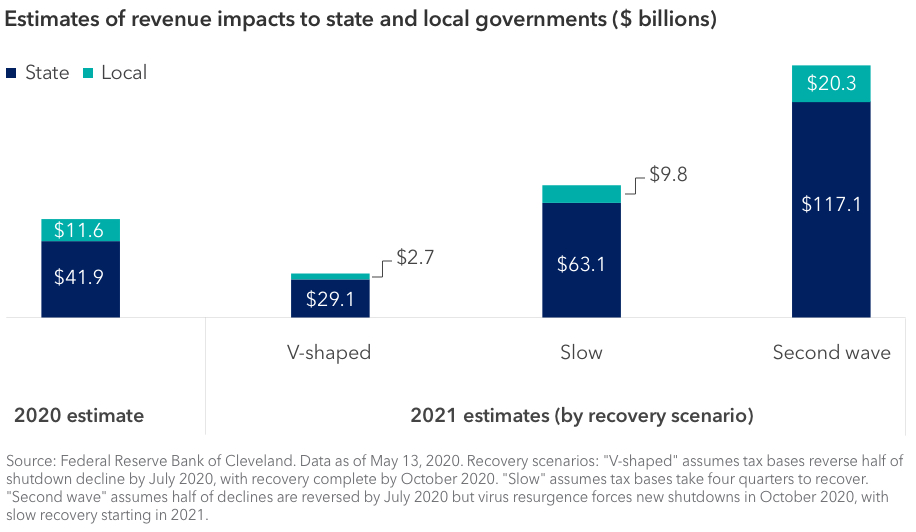
Revenue impact on state and local governments
Local government revenues have already dropped off precipitously. In many states, it’s estimated that sales and income taxes have declined more than 50% on a year-over-year basis.1 Across all states, total revenue shortfalls for the current fiscal year are projected to top $53 billion. Looking ahead to 2021, estimates range from $25 billion to $137 billion.
With the use of budget stabilization funds, also known as rainy day funds, states in aggregate can lessen the overall impact of lost revenues. However, nearly half of all states are expected to exhaust their rainy day funds entirely. On the other hand, state and local governments have the flexibility to raise revenues and cut expenses to offset these challenges. Many issuers will also have access to support from the Federal Reserve and from Congress.
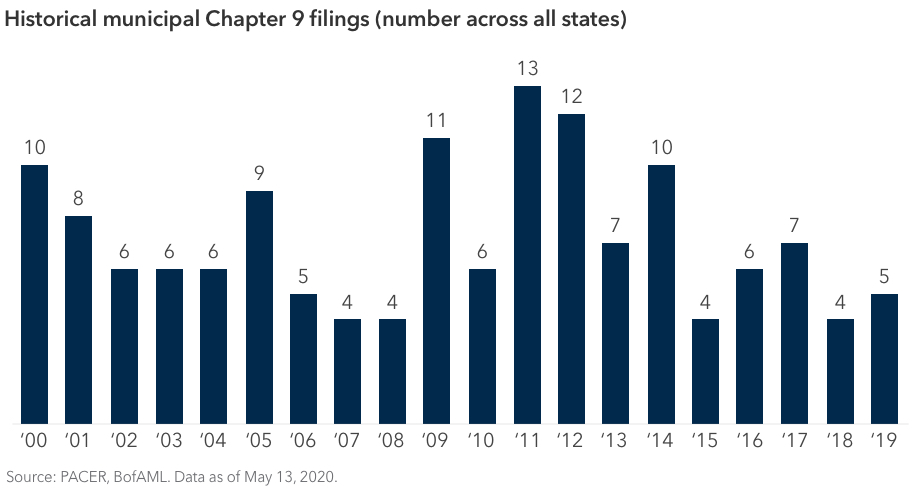
While the recent halt in the economy is unprecedented, it is important to note that historically, municipal bankruptcies have been rare as compared with the corporate sector. States are not able to file for relief under Chapter 9 of the U.S. Bankruptcy Code, and filings by counties and cities have typically numbered 10 or fewer per year (see top chart). Notable examples include the city of Detroit and Jefferson County in Alabama.
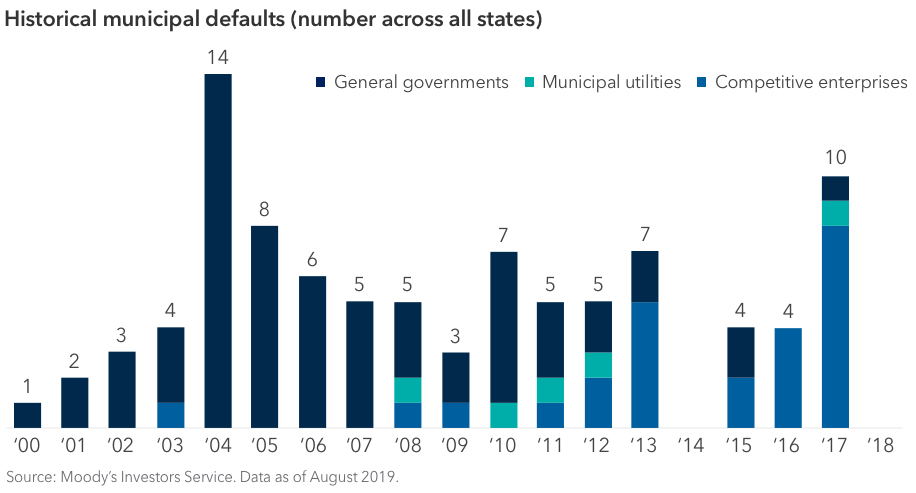
As for defaults, they typically number less than a dozen in most years (see bottom chart). In 2018 (the latest available data through Moody’s), there were none for rated municipal bonds versus nearly 50 for U.S. corporates.
Support for state and local governments
Federal support has been pledged to state and local governments through explicit aid funded by Congress as well as market support by the Federal Reserve through an initiative called the Municipal Liquidity Facility. Under the CARES Act, Congress appropriated over $500 billion to state and local governments. An additional $1 trillion is being sought through the HEROES Act, recently passed by the House. Senate debate on the bill is ongoing, but there is agreement that more aid will likely be needed.
Sectors impacted by revenue loss
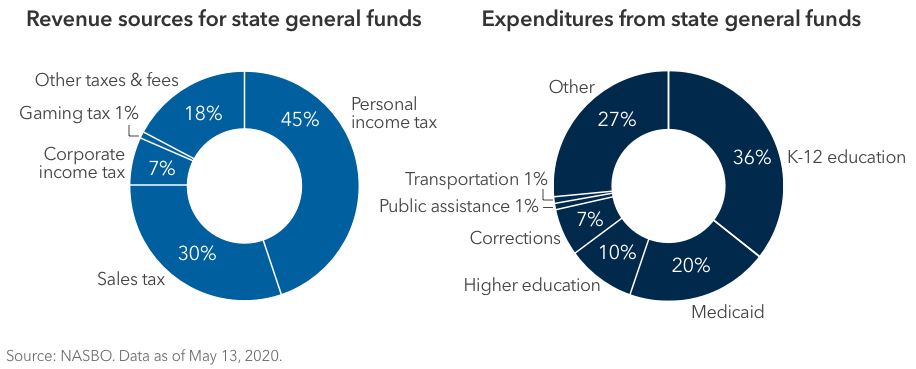
Most states derive the bulk of their revenue from personal income taxes and sales taxes — both considered volatile sources of revenue given their reliance on consumption and employment. The decline in employment and reduced spending brought on by COVID-19 will put significant pressure on that revenue, which is used largely for education and health care-related expenditures.
- School districts – In most states, school districts are largely dependent on state funding. They usually have strong pledges of state support, and that support is likely to continue. If strain on state budgets intensifies, however, school district funding could be negatively impacted. Districts that rely more on property taxes would likely see a slower impact, as declines in property tax collections typically lag downturns in economic activity.
- Higher education – Our fixed income portfolio managers believe that the largest issuers in the higher education sector, namely large public universities, are generally well positioned to deal with the COVID-19 pandemic. These institutions benefit from strong balance sheets and name recognition. Smaller state and regional schools, however, may face budget cuts as states look to offset revenue declines. Moody’s notes that none of its rated public universities has ever defaulted on its debt.
- Health care – As states look to balance their budgets, hospitals may face the prospect of Medicaid funds being cut. Causing further strain is the revenue lost from canceled surgical procedures and other elective medical treatments. The American Hospital Association estimates monthly revenue losses to hospitals and health systems to be more than $50 billion. However, some of these revenues are starting to rebound as restrictions ease.
- Transportation – Transit agencies were allotted only $25 billion in the CARES Act. The proposed HEROES Act would provide an additional $15.75 billion. Moody’s expects traffic and revenue to decline through 2021 and remain suppressed thereafter. The pandemic has made such predictions difficult, however. For example, a decrease in mass transit ridership could translate to an increase in toll road revenue if people opt to drive more.
The path ahead
While there are many unknowns as we move ahead, it’s clear that the market tone has improved materially since March. Yields are lower across the curve, spreads have stopped moving rapidly upward and primary market issuance has returned to normal.
Are there still risks in the market? Yes. Are investors being compensated adequately for these risks? Members of our investment team believe so. The dislocations in the municipal bond market have created many potential opportunities for municipal bond investors. With interest rates expected to remain low and tax rates potentially increasing in the future, municipal bonds can offer attractive, high-quality, tax-efficient income. Through active research and discerning among credits, our investment team has determined that now may be a good time to add value to investors’ portfolios for the long term.
1 Source: BofAML Research. As of May 13, 2020.
Our latest insights
-
-
-
Defined Benefit
-
U.S. Equities
-
Economic Indicators
RELATED INSIGHTS
Statements attributed to an individual represent the opinions of that individual as of the date published and do not necessarily reflect the opinions of Capital Group or its affiliates. This information is intended to highlight issues and should not be considered advice, an endorsement or a recommendation.