Active Management
Categories
Election
How U.S. midterm elections may affect markets
 Reagan Anderson
 Matt Miller
May 13, 2026
KEY TAKEAWAYS
- The president’s party typically loses seats in Congress — and markets know it.
- Market returns tend to be muted in midterm years.
- Volatility has been elevated in midterm election years.
- Markets usually bounced back strongly after elections.
- Control of Congress has had little impact on investment returns.
Held near the midpoint of a president’s four-year term in office, U.S. midterm elections are often seen by the electorate and the political press as something of a referendum on the status quo. Control of Congress is at stake, and Republicans and Democrats go all out to win. Whichever party prevails in November will command the legislative agenda for the next two years. Historically speaking, the party in power tends to lose seats, but that doesn’t mean history always repeats itself.
Every election cycle generates uncertainty, but how do midterms specifically affect stocks? To find out, Capital Group examined more than 90 years of data from the S&P 500 Index and, as it turns out, U.S. stocks do exhibit some unique characteristics in midterm election years. Although a variety of other factors may influence the investment environment in any given year, after digging deeper into midterm election history, we identified five key takeaways.
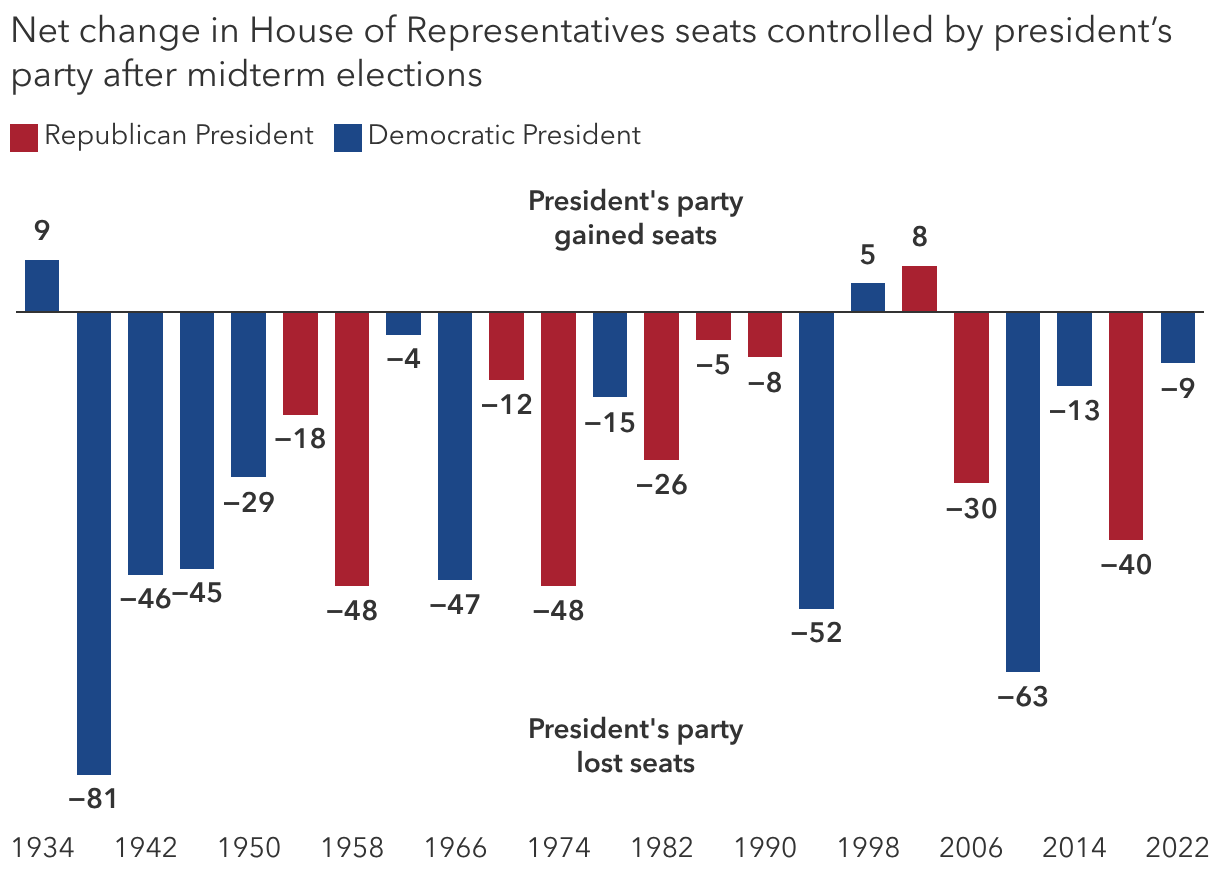
1. The president’s party typically loses seats in Congress — and markets know it.
Midterm elections occur at the midpoint of a presidential term in November, and they usually result in the president’s party losing ground in Congress. Over the past 23 U.S. midterm elections, the president’s party lost an average 27 seats in the House of Representatives and three in the Senate. Only twice has the president’s party gained seats in both chambers.
This tends to happen for two reasons. First, supporters of the party not in power — in this case, the Democratic Party — usually are more motivated to boost voter turnout. Second, the president’s approval rating typically dips during the first two years in office, as it has with President Trump, which can influence swing voters and frustrated constituents.
Republicans currently control both the Senate and House by slim margins. Losing either chamber would effectively end any chance to pass ambitious Republican-sponsored legislation over the next two years, and it would put Trump on the defensive for the remainder of his term in office, according to Capital Group political economist Matt Miller.
Since losing seats is so common, it’s usually priced into the markets early in the year. But the extent of a political power shift and resulting policy impacts remain unclear until later in the year, which can explain other interesting trends.
The incumbent has lost seats in all but three midterm elections
Sources: Capital Group, UCSB: The American Presidency Project. As of January 15, 2026.
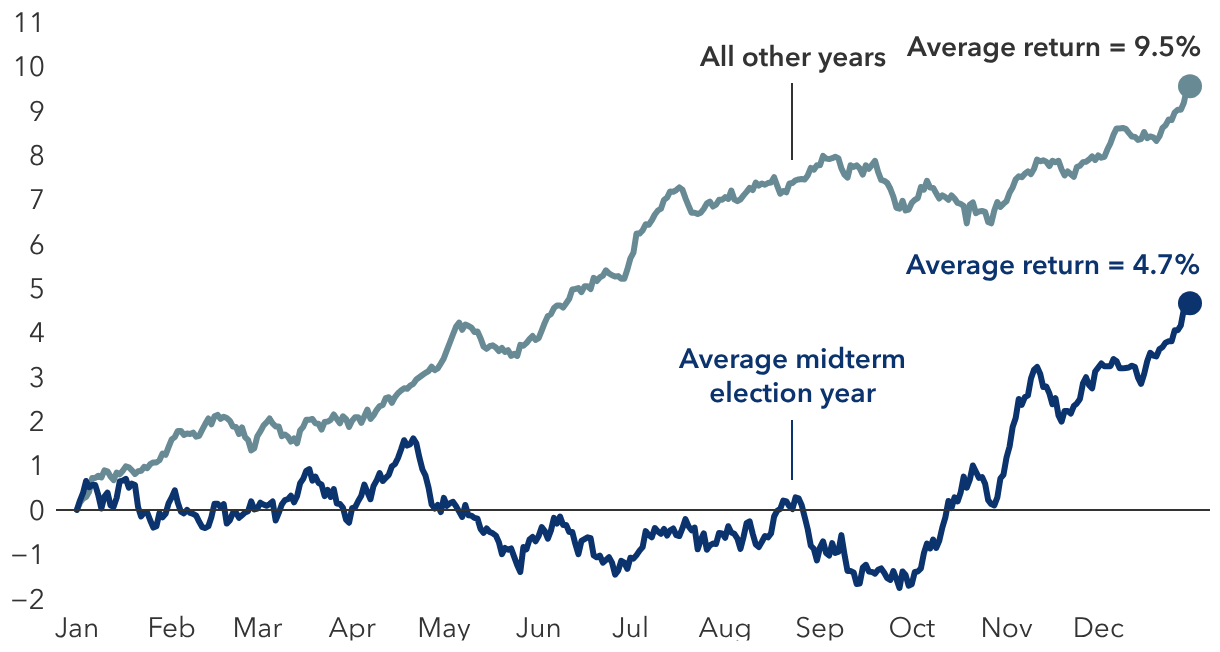
2. Market returns tend to be muted in midterm years.
Since markets have typically gone up over long periods of time, the average stock movement during an average year should steadily increase. But we found that in the initial months of midterm election years, stocks have tended to generate lower average returns and often gained little ground until shortly before the election.
Markets don’t like uncertainty — and that adage seems to apply here. At the start of the year there is less certainty about the election’s outcome and impact. But markets have tended to rally in the weeks before an election then continue to rise after the polls close.
Despite election-related uncertainty, investors should consider the cost of sitting on the sidelines or trying to time the market. Historically speaking, staying invested has been the smartest move.
The path of stocks varies greatly each election cycle, but the overall long-term trend of markets has been upward. Since 1931, in U.S. dollar terms, the S&P 500 Index has seen an average return of 4.7% in midterm election years, about half the 9.5% average for all other years but positive all the same.
Political uncertainty has dampened returns in midterm years
S&P 500 Index average price return (%), 1931-2025
Sources: Capital Group, RIMES, S&P Global. The chart shows the average trajectory of cumulative price returns for the S&P 500 Index throughout midterm election years compared to non-midterm election years. Each point on the lines represents the average year-to-date return as of that month and day, and is calculated using daily price returns from January 1, 1931, to December 31, 2025. Price returns exclude distributions. Returns are in USD.
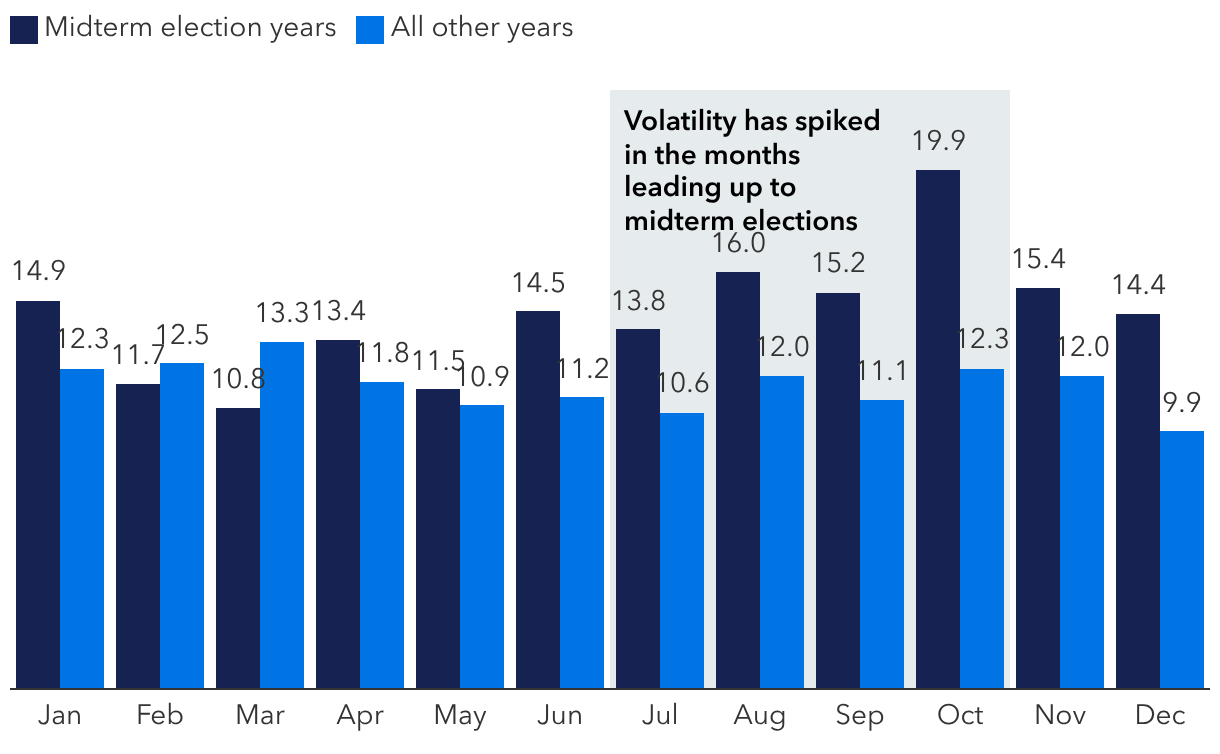
3. Volatility has been elevated in midterm election years.
There is no question that election season can be tough on the nerves. Candidates often draw attention to the country’s problems, and campaigns regularly amplify negative messages. Policy proposals may be unclear and often target specific industries or companies.
If you suspect that this contributes to increased market volatility, then you’re right. Once again, election year uncertainty seems to translate directly into higher volatility. This is especially true in the months just prior to an election.
Since 1970, midterm years have a median standard deviation of returns of nearly 16%, compared with 13% in all other years. Interestingly, the volatility in presidential election years has been very similar to non-election years, pointing to midterm elections as truly an outlier.
Midterm election years have come with higher volatility
Sources: Capital Group, RIMES, S&P Global. Volatility is calculated using the standard deviation of daily returns for each individual month. The median volatility for each month is then displayed in the chart on an annualized basis. Standard deviation is a measure of how returns over time have varied from the average. A lower number signifies lower volatility. As of December 31, 2025. Returns are in USD.
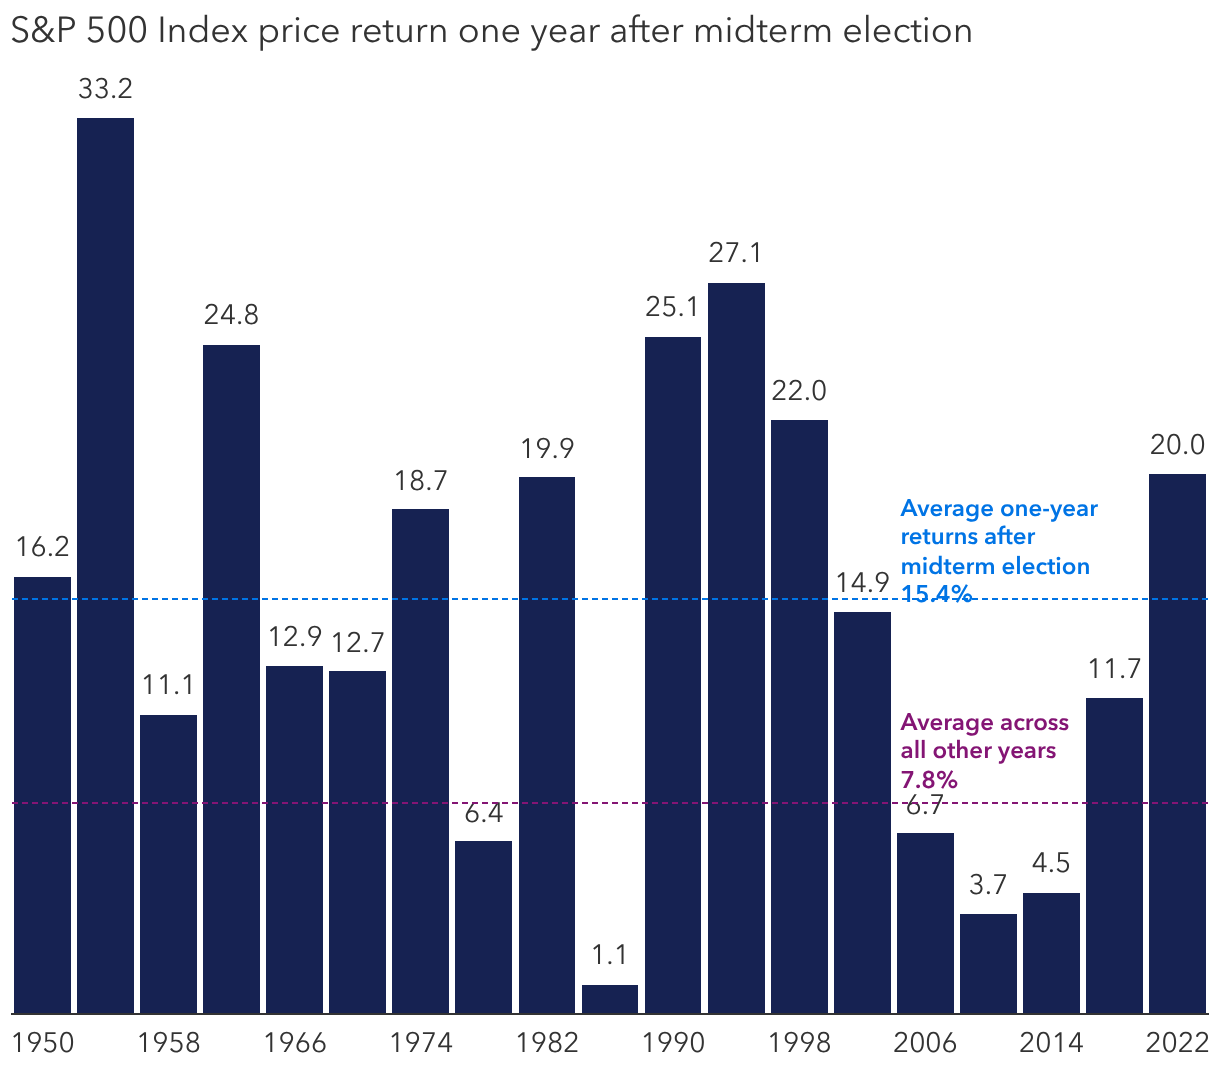
4. Markets usually bounced back strongly after elections.
The silver lining for investors is that markets have tended to rebound strongly after election day. As we have seen, markets typically rally shortly after midterm elections. History also shows that this isn’t just a short-term blip: Above-average returns are typical for a full year following the election cycle. Since 1950, the average one-year return following a midterm election was 15.4%. That’s nearly twice the return of all other years during a similar period.
Of course, every cycle is different, and elections are just one of many factors influencing market returns. For example, investors will need to weigh the potential impacts of oil prices, tariffs, inflation, and interest rates, as well as global economic growth and geopolitical conflicts.
Post-midterm market returns have been strong
Sources: Capital Group, RIMES, S&P Global. Calculations use Election Day as the starting date in all election years and November 5th as a proxy for the starting date in other years. Only midterm election years are shown in the chart. As of December 31, 2025. Price returns exclude distributions. Returns are in USD.
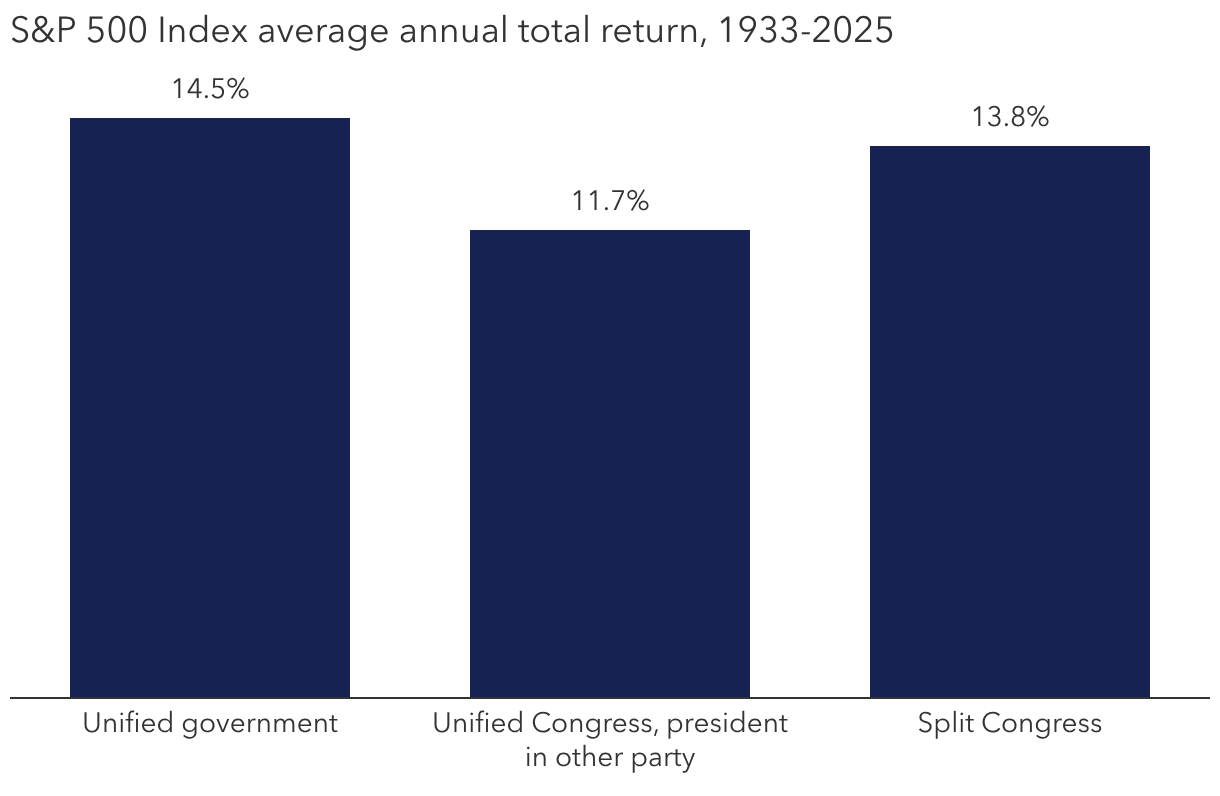
5. Control of Congress has had little impact on investment returns.
There’s nothing wrong with wanting your preferred candidates to win, but investors can run into trouble if they place too much importance on election results. That’s because, historically, elections have had little impact on long-term investment returns. Going back to 1933, markets have averaged double-digit returns during various scenarios, including when a single party controlled the White House and both chambers of Congress as a “unified government,” a split Congress, and when a president’s opposing party controls Congress.
Although midterm election years have exhibited these trends in aggregate over long periods, it is important to remember that each year follows its own path. Midterm elections — and politics as a whole — generate a lot of noise and uncertainty. But the reality is that long-term equity returns are generated by the value of individual companies over time. A prudent investor should look past the short-term volatility spikes that elections can bring and maintain a long-term focus.
Markets have averaged double-digit returns after midterm elections
Sources: Capital Group, Office of the Clerk — U.S. House of Representatives, Senate.gov, S&P Global. Unified government indicates White House, House and Senate are controlled by the same political party. Unified Congress indicates House and Senate are controlled by the same party, but the White House is controlled by a different party. Split Congress indicates House and Senate are controlled by different parties, regardless of the White House control. Data excludes 2001 due to Senator Jim Jeffords switching parties mid-year. As of December 31, 2025. Returns are in USD.
Learn more about
S&P 500 Index is a market capitalization-weighted index based on the results of approximately 500 widely held common stocks. The index is unmanaged and, therefore, has no expenses. Investors cannot invest directly in an index.
Our latest insights
RELATED INSIGHTS
-
Global Equities
-
-
Economic Indicators
Commissions, trailing commissions, management fees and expenses all may be associated with investments in investment funds. Please read the prospectus before investing. Investment funds are not guaranteed or covered by the Canada Deposit Insurance Corporation or by any other government deposit insurer. For investment funds other than money market funds, their values change frequently. For money market funds, there can be no assurances that the fund will be able to maintain its net asset value per security at a constant amount or that the full amount of your investment in the fund will be returned to you. Past performance may not be repeated.
Unless otherwise indicated, the investment professionals featured do not manage Capital Group‘s Canadian investment funds.
References to particular companies or securities, if any, are included for informational or illustrative purposes only and should not be considered as an endorsement by Capital Group. Views expressed regarding a particular company, security, industry or market sector should not be considered an indication of trading intent of any investment funds or current holdings of any investment funds. These views should not be considered as investment advice nor should they be considered a recommendation to buy or sell.
Statements attributed to an individual represent the opinions of that individual as of the date published and do not necessarily reflect the opinions of Capital Group or its affiliates. This information is intended to highlight issues and not be comprehensive or to provide advice. For informational purposes only; not intended to provide tax, legal or financial advice. Capital Group funds are available in Canada through registered dealers. For more information, please consult your financial and tax advisors for your individual situation.
Forward-looking statements are not guarantees of future performance, and actual events and results could differ materially from those expressed or implied in any forward-looking statements made herein. We encourage you to consider these and other factors carefully before making any investment decisions and we urge you to avoid placing undue reliance on forward-looking statements.
The S&P 500 Composite Index (“Index”) is a product of S&P Dow Jones Indices LLC and/or its affiliates and has been licensed for use by Capital Group. Copyright © 2026 S&P Dow Jones Indices LLC, a division of S&P Global, and/or its affiliates. All rights reserved. Redistribution or reproduction in whole or in part are prohibited without written permission of S&P Dow Jones Indices LLC.
FTSE source: London Stock Exchange Group plc and its group undertakings (collectively, the "LSE Group"). © LSE Group 2026. FTSE Russell is a trading name of certain of the LSE Group companies. "FTSE®" is a trade mark of the relevant LSE Group companies and is used by any other LSE Group company under licence. All rights in the FTSE Russell indices or data vest in the relevant LSE Group company which owns the index or the data. Neither LSE Group nor its licensors accept any liability for any errors or omissions in the indices or data and no party may rely on any indices or data contained in this communication. No further distribution of data from the LSE Group is permitted without the relevant LSE Group company's express written consent. The LSE Group does not promote, sponsor or endorse the content of this communication. The index is unmanaged and cannot be invested in directly.
BLOOMBERG® is a trademark and service mark of Bloomberg Finance L.P. and its affiliates (collectively “Bloomberg”). Bloomberg or Bloomberg’s licensors own all proprietary rights in the Bloomberg Indices. Neither Bloomberg nor Bloomberg’s licensors approves or endorses this material, or guarantees the accuracy or completeness of any information herein, or makes any warranty, express or implied, as to the results to be obtained therefrom and, to the maximum extent allowed by law, neither shall have any liability or responsibility for injury or damages arising in connection therewith.
The MSCI information may only be used for your internal use, may not be reproduced or redisseminated in any form and may not be used as a basis for or a component of any financial instruments or products or indices. None of the MSCI information is intended to constitute investment advice or a recommendation to make (or refrain from making) any kind of investment decision and may not be relied on as such. Historical data and analysis should not be taken as an indication or guarantee of any future performance analysis, forecast or prediction. The MSCI information is provided on an “as is” basis and the user of this information assumes the entire risk of any use made of this information. MSCI, each of its affiliates and each other person involved in or related to compiling, computing or creating any MSCI information (collectively, the “MSCI Parties”) expressly disclaims all warranties (including, without limitation, any warranties of originality, accuracy, completeness, timeliness, non-infringement, merchantability and fitness for a particular purpose) with respect to this information. Without limiting any of the foregoing, in no event shall any MSCI Party have any liability for any direct, indirect, special, incidental, punitive, consequential (including, without limitation, lost profits) or any other damages. (www.msci.com)
Capital believes the software and information from FactSet to be reliable. However, Capital cannot be responsible for inaccuracies, incomplete information or updating of the information furnished by FactSet. The information provided in this report is meant to give you an approximate account of the fund/manager's characteristics for the specified date. This information is not indicative of future Capital investment decisions and is not used as part of our investment decision-making process.
Indices are unmanaged and cannot be invested in directly. Returns represent past performance, are not a guarantee of future performance, and are not indicative of any specific investment.
All Capital Group trademarks are owned by The Capital Group Companies, Inc. or an affiliated company in Canada, the U.S. and other countries. All other company names mentioned are the property of their respective companies.
Capital Group funds are offered in Canada by Capital International Asset Management (Canada), Inc., part of Capital Group, a global investment management firm originating in Los Angeles, California in 1931. Capital Group manages equity assets through three investment groups. These groups make investment and proxy voting decisions independently. Fixed income investment professionals provide fixed income research and investment management across the Capital organization; however, for securities with equity characteristics, they act solely on behalf of one of the three equity investment groups.
The Capital Group funds offered on this website are available only to Canadian residents.