
Election
How U.S. midterm elections may affect markets
 Matt Miller
 Chris Buchbinder
April 17, 2026
With everything happening in the world — from the U.S.–Iran conflict to escalating tariffs and more besides — investors may not be focused on the U.S. midterm elections just yet. But this pivotal contest is mere months away, and the campaign started in earnest when President Donald Trump delivered the State of the Union Address.
“Trump used the State of the Union, where he commanded a massive audience, to kick off the 2026 campaign,” says Capital Group political economist Matt Miller. “He laid out a narrative and policy agenda designed to help the Republican Party defy the normal setback that we would expect to see for a president in the midterm elections.”
The key question for investors is: How might the midterms influence the stock market?
Midterm elections occur at the midpoint of a presidential term in November, and they usually result in the president’s party losing ground in Congress. Over the past 23 midterms, the president’s party has lost an average of 27 seats in the House of Representatives and three in the Senate. Only twice has the president’s party gained ground in both chambers.
The president’s party has typically lost seats in Congress
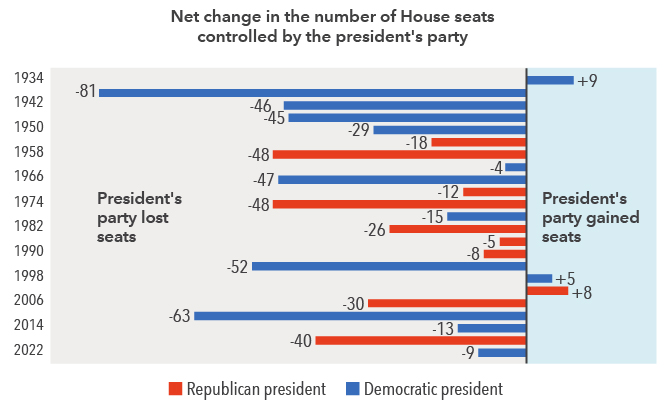
Sources: Capital Group, UCSB: The American Presidency Project. As of January 15, 2026.
This tends to happen for two reasons. First, supporters of the party not in power — in this case, the Democratic Party — usually are more motivated to boost voter turnout. Second, the president’s approval rating typically dips during the first two years in office, as it has with Trump, which can influence swing voters and frustrated constituents.
Republicans currently control both the Senate and House by slim margins. Losing either chamber would effectively end any chance to pass ambitious Republican-sponsored legislation over the next two years, and it would put Trump on the defensive for the remainder of his term, Miller explains.
Since losing seats is so common, it’s usually priced into the markets early in the year. But the extent of a political power shift and resulting policy impacts remain unclear until later in the year, which can explain other interesting trends.
History suggests lower returns and higher volatility.
Capital Group examined more than 90 years of data and found that markets tend to behave differently during midterm years. In fact, our analysis of returns for the S&P 500 Index since 1931 revealed that stocks tend to behave much differently.
Since markets have typically gone up over long periods, the average stock movement during an average year should steadily increase. But in midterm years, we found that stocks have tended to generate lower average returns and often gained little ground until shortly before the election.
Market returns have lagged in midterm election years
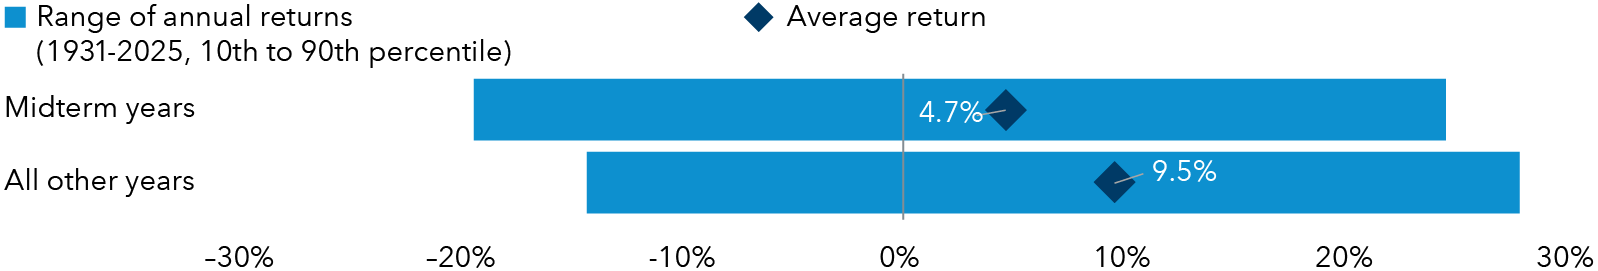
Sources: Capital Group, RIMES, Standard & Poor's. As of January 15, 2026.
Markets don’t like uncertainty — and that adage seems to apply here. Earlier in the year, there is less certainty about the election’s outcome and impact. Additionally, candidates often draw attention to the country’s problems, and campaigns regularly amplify negative messages. Policy proposals may be unclear and often target specific industries or companies.
Midterm election years have come with higher volatility

Sources: Capital Group, RIMES, Standard & Poor's. Volatility is calculated using the standard deviation of daily returns for each individual month. The median volatility for each month is then displayed in the chart on an annualized basis. Standard deviation is a measure of how returns over time have varied from the average. As of December 31, 2025.
However, markets have tended to rally in the weeks before an election and often continued to rise after the polls closed.
“I don’t think this election will be any different,” says Chris Buchbinder, a Capital Group equity portfolio manager. “There may be bumps in the road, and investors should brace for short-term volatility, but I don’t expect the election results to be a huge driver of investment outcomes one way or the other.”
Despite election-related uncertainty, investors should consider the potential cost of trying to time the market. Historically speaking, staying invested has often been the smartest move. While the path of stocks has varied greatly each election cycle, the overall long-term trend of markets has been positive.
Post-midterm market returns have been strong.
The silver lining is that markets have tended to rebound strongly after Election Day. Above-average returns have been typical for the full year following an election cycle. Since 1950, the average one-year return following a midterm election was 15.4%. That’s nearly twice the return of all other years during a similar period.
Political uncertainty has dampened returns in midterm years
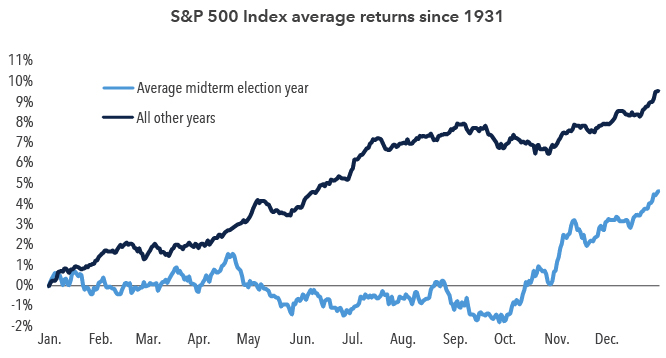
Sources: Capital Group, RIMES, Standard & Poor’s. The chart shows the average trajectory of cumulative price returns for the S&P 500 Index throughout midterm election years compared to non-midterm election years. Each point on the lines represents the average year-to-date return as of that particular month and day, and is calculated using daily price returns from January 1, 1931, to December 31, 2025.
Every cycle is different though, and elections are just one of many factors influencing returns. For example, investors need to weigh the potential impacts of tariffs, inflation and interest rates, as well as global growth and geopolitical conflicts.
The bottom line: Markets have generally done well in the long term.
There’s certainly nothing wrong with wanting your preferred candidate to win, but investors can run into trouble if they place too much importance on election results. That’s because, historically, elections have had little impact on long-term investment returns. Going back to 1933, markets have averaged double-digit returns during various government-control scenarios, including when a single party controlled the White House and both chambers of Congress, when Congress was split, and when the president’s opposing party controlled Congress.
S&P 500 Index price return one year after midterm election

Sources: Capital Group, RIMES, Standard & Poor's. Calculations use Election Day as the starting date in all election years and November 5th as a proxy for the starting date in other years. Only midterm election years are shown in the chart. As of January 15, 2026.
Even if elections spur higher volatility, there is no need to fear them. The reality is that long-term equity returns are driven by the earnings and perceived value of individual companies over time. Investors would be wise to look past the short-term highs and lows and maintain a long-term focus, regardless of which way the political winds may shift in any given year.
Explore topics
Past results are not predictive of results in future periods.
S&P 500 Index is a market capitalization-weighted index based on the results of approximately 500 widely held common stocks.
The S&P 500 Index is a product of S&P Dow Jones Indices LLC and/or its affiliates and has been licensed for use by Capital Group. Copyright © 2026 S&P Dow Jones Indices LLC, a division of S&P Global, and/or its affiliates. All rights reserved. Redistribution or reproduction in whole or in part is prohibited without written permission of S&P Dow Jones Indices LLC.
Related insights
-
-
U.S. Federal Reserve
-
Economic Indicators