
Markets & Economy
5 keys to investing in 2026
 Martin Romo
 Cheryl Frank
 Pramod Atluri
 Diana Wagner
 Chris Buchbinder
January 15, 2026
After three straight years of double-digit returns for the S&P 500 Index, investors are entering 2026 with equal parts confidence and caution.
Whether the rally will stretch into a fourth year is far from certain, but one theme has come to define the investment conversation: balance. With valuations still elevated and leadership broadening beyond the U.S. and technology stocks, the road ahead for investors may depend on how consumers and businesses navigate a more fractured economy. “That points toward what I call the “and market” — investing in U.S. and international stocks, growth and value, cyclical and secular trends, stocks and bonds,” says Chief Investment Officer Martin Romo.
Against that backdrop, our portfolio managers highlight five insights shaping the year ahead.
1. Bold stimulus could boost the global economy
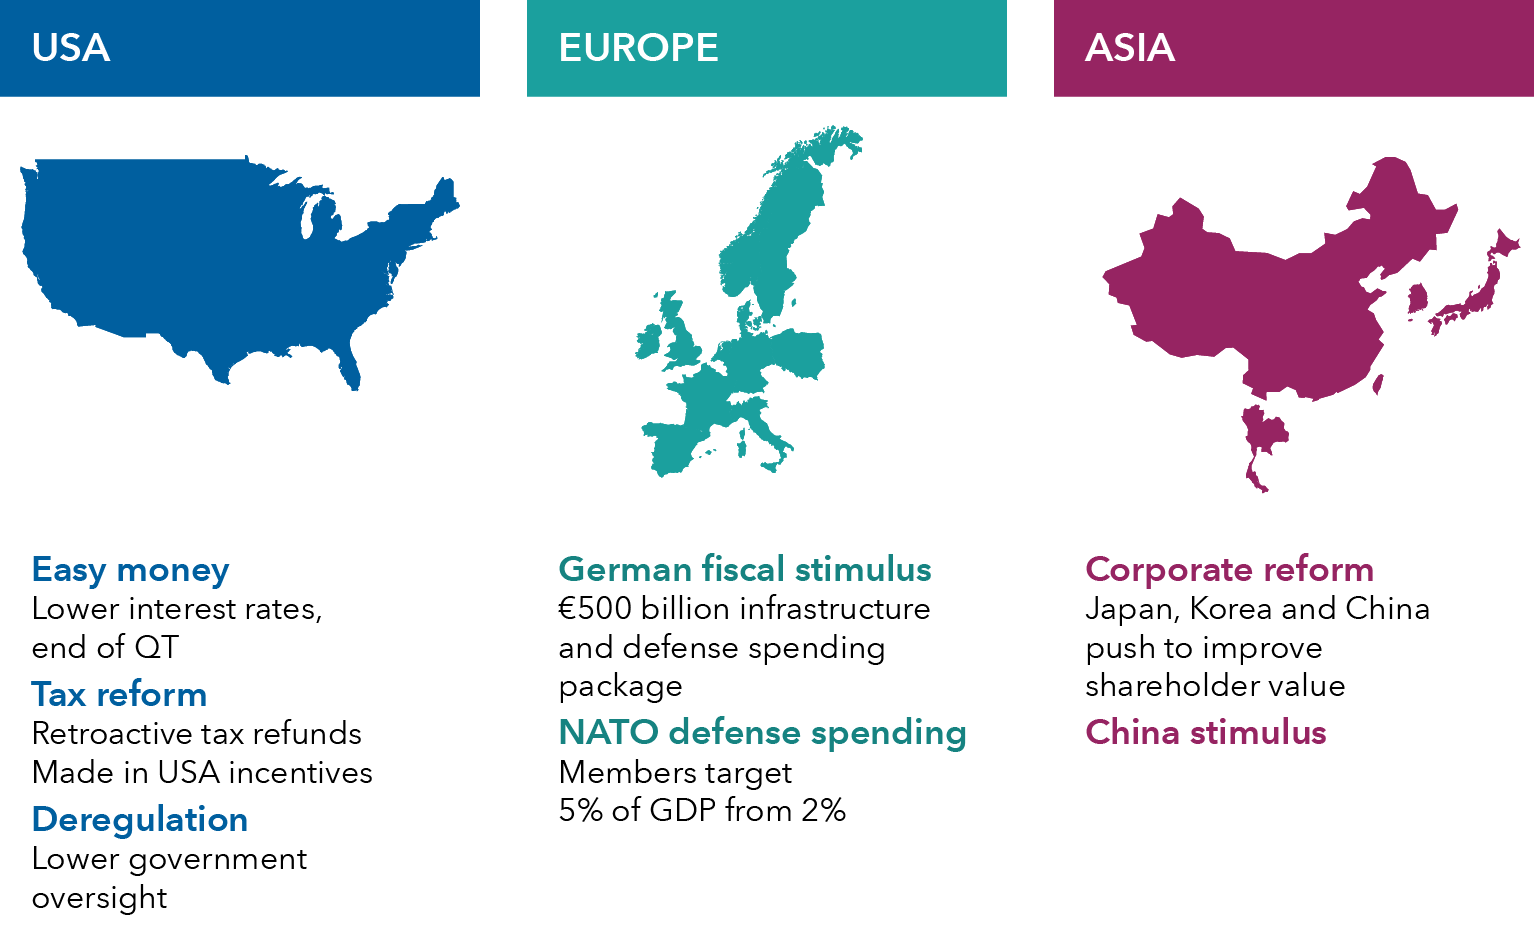
Source: Capital Group. As of December 31, 2025. QT, or quantitative tightening, refers to policies that reduce the size of the Fed Reserve’s balance sheet.
The economic landscape is expected to improve in 2026, as governments worldwide roll out bold stimulus in response to slowing growth and high trade barriers.
In the U.S., the Federal Reserve is cutting borrowing costs, a tailwind for housing and the broader economy, according to Cheryl Frank, a Capital Group equity portfolio manager. Lower rates could lift demand for high-paying construction jobs, and materials such as lumber and paint, benefiting companies like Home Depot and Sherwin-Williams.
Deregulation could increase lending activity, supporting banks such as Wells Fargo and companies left out of the artificial intelligence boom. Meanwhile, the One Big Beautiful Bill Act incentivizes U.S. manufacturing, helping industrial and technology sectors.
Across the Atlantic, Germany has shelved fiscal restraint, unveiling a €500 billion package for infrastructure and defense. The move could boost earnings potential for construction companies like Heidelberg Materials and arms maker Rheinmetall.
NATO allies are likewise pledging to raise defense spending, generating even greater demand for the systems and products made by Northrop Grumman and Rolls-Royce.
Meanwhile, Japan is pushing corporate reform to unlock shareholder value, impacting companies like insurance provider Tokio Marine. Korea and China are similarly following suit, with China also introducing stimulus measures aimed at stabilizing its economy.
These policies aren’t without risks. Missteps could contribute to rising government debt and add to inflationary pressures.
2. Fed interest rate cuts can be good for stocks and bonds
Average annualized returns across past seven Fed easing cycles
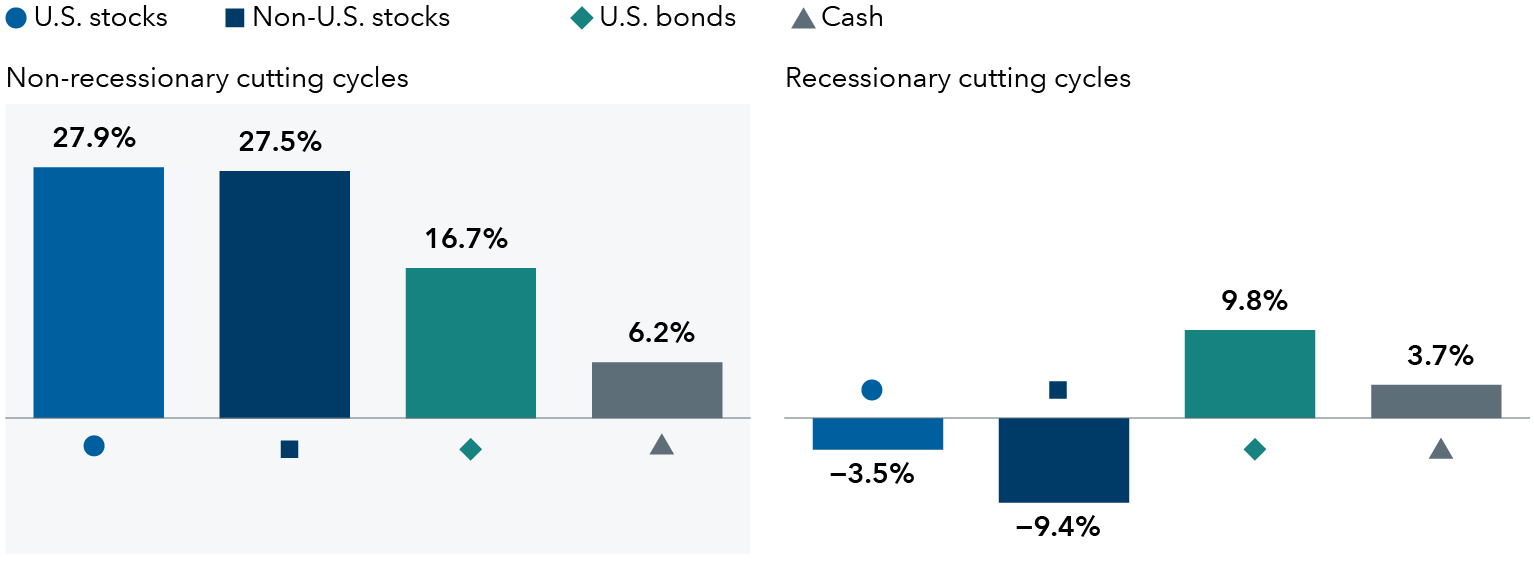
Sources: Capital Group, Bloomberg, Morningstar, Standard & Poor's. Returns reflect annualized total returns from the peak federal funds rate target to the lowest federal funds rate target for each cycle. Specific non-recessionary cutting cycles include August 1984 to August 1986, February 1995 to January 1996, and March 1997 to November 1998. Recessionary cutting cycles include May 1989 to September 1992, May 2000 to June 2003, June 2006 to December 2008, and December 2018 to March 2020. Benchmarks used are the S&P 500 Index (U.S. stocks), MSCI World ex USA Index (non-U.S. stocks), Bloomberg U.S. Aggregate Index (U.S. bonds) and 3-month U.S. Treasury Bills (cash). As of December 31, 2025.
A dovish Fed is coming into focus.
Despite elevated inflation, interest rates are set to fall in 2026 as policymakers respond to sluggish job growth. “The Federal Reserve is worried about the labor market because, historically, a weak job market leads to an economic slowdown,” says Capital Group fixed income portfolio manager Pramod Atluri. "Meanwhile, more stable tariff policies should help ease inflationary pressures.”
The U.S. federal funds rate is expected to end 2026 near 3%, a level Atluri describes as neither stimulating nor restricting economic growth. The rate influences borrowing costs worldwide, and lower rates could support business and consumer spending. Historically, Fed easing cycles that occurred outside a recession have lifted stock and bond markets, while cash lagged.
The Fed is cutting as spending for AI ripples through the economy, alongside tariff concerns and labor market softness. “There’s healthy debate over whether U.S. economic growth will slow or accelerate because of these forces,” Atluri explains. “We may be entering an unusual scenario where U.S. gross domestic product accelerates beyond an expected range of 2% to 3%, even as job creation remains weak or turns negative. At the same time, unemployment could stay relatively low due to fewer layoffs and stricter immigration enforcement reducing the overall number of workers.”
3. Company profits are expected to rise worldwide
Estimated annual earnings growth across select benchmarks
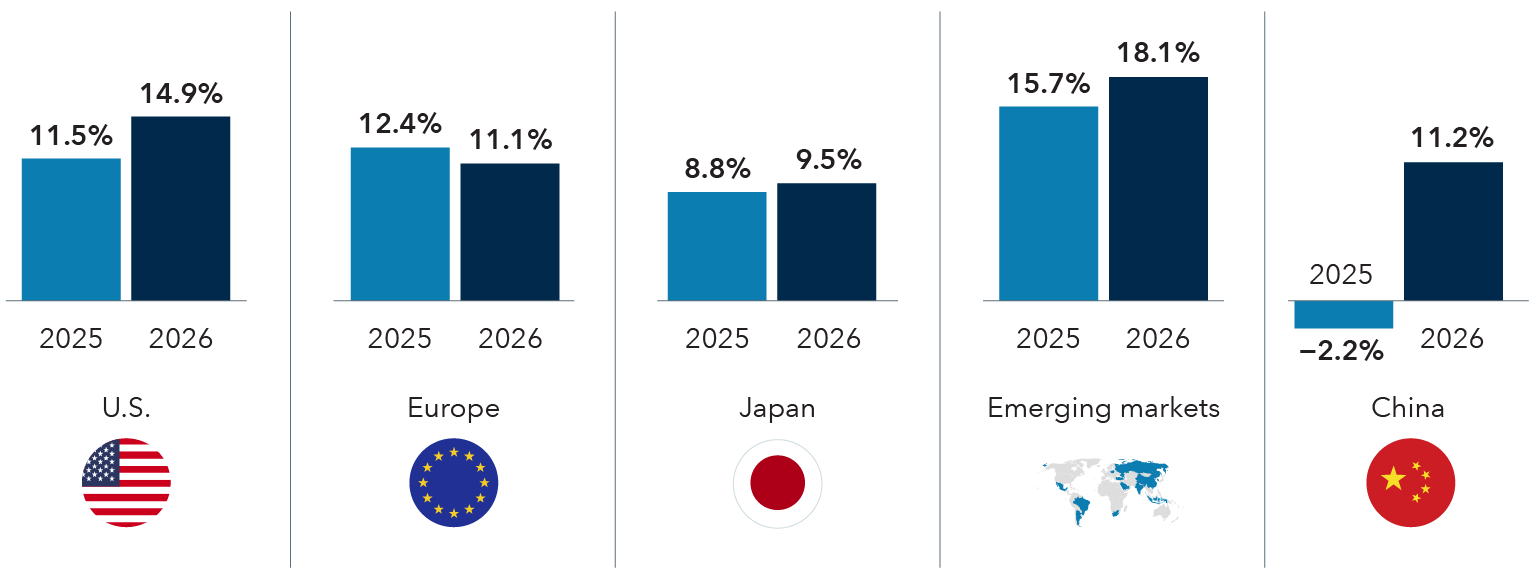
Sources: Capital Group, FactSet, MSCI, Standard & Poor's. Estimated annual earnings growth is represented by the mean consensus earnings per share estimates for the years ending December 2025 and 2026, respectively, across the S&P 500 Index (U.S.), the MSCI Europe Index (Europe), the MSCI Japan Index (Japan), the MSCI Emerging Markets Index (Emerging markets) and MSCI China Index (China). Estimates are as of December 31, 2025.
If 2025 was the year that tariff-induced uncertainty upended the outlook for corporate earnings, 2026 could be the year that the numbers come back into focus.
Consensus earnings estimates are looking brighter, largely due to declining interest rates, government stimulus and a string of trade deals that have reduced policy uncertainty. Financial markets have responded by rallying off the lows of last April, when the fear of sky-high tariffs reached its peak.
Another significant driver is the expansion of AI, which has spurred strong demand for computer chips, data centers, and high-tech and low-tech equipment to support the build-out of AI infrastructure.
Emerging markets are expected to enjoy the strongest earnings growth, rising 18.1%, while the United States comes in at 14.9% and Europe at 11.1%.
Powerful tailwinds could drive earnings growth and support market gains beyond the tech sector in the year ahead, according to Diana Wagner, a Capital Group equity portfolio manager. She singles out industrials, financials and consumer staples, among others. “There is a lot of support from a macroeconomic perspective but, ultimately, what’s going to matter is corporate earnings growth.”
4. Artificial intelligence: Boom, bubble or both?
Dot-com era: Price vs. earnings (1998-2001)
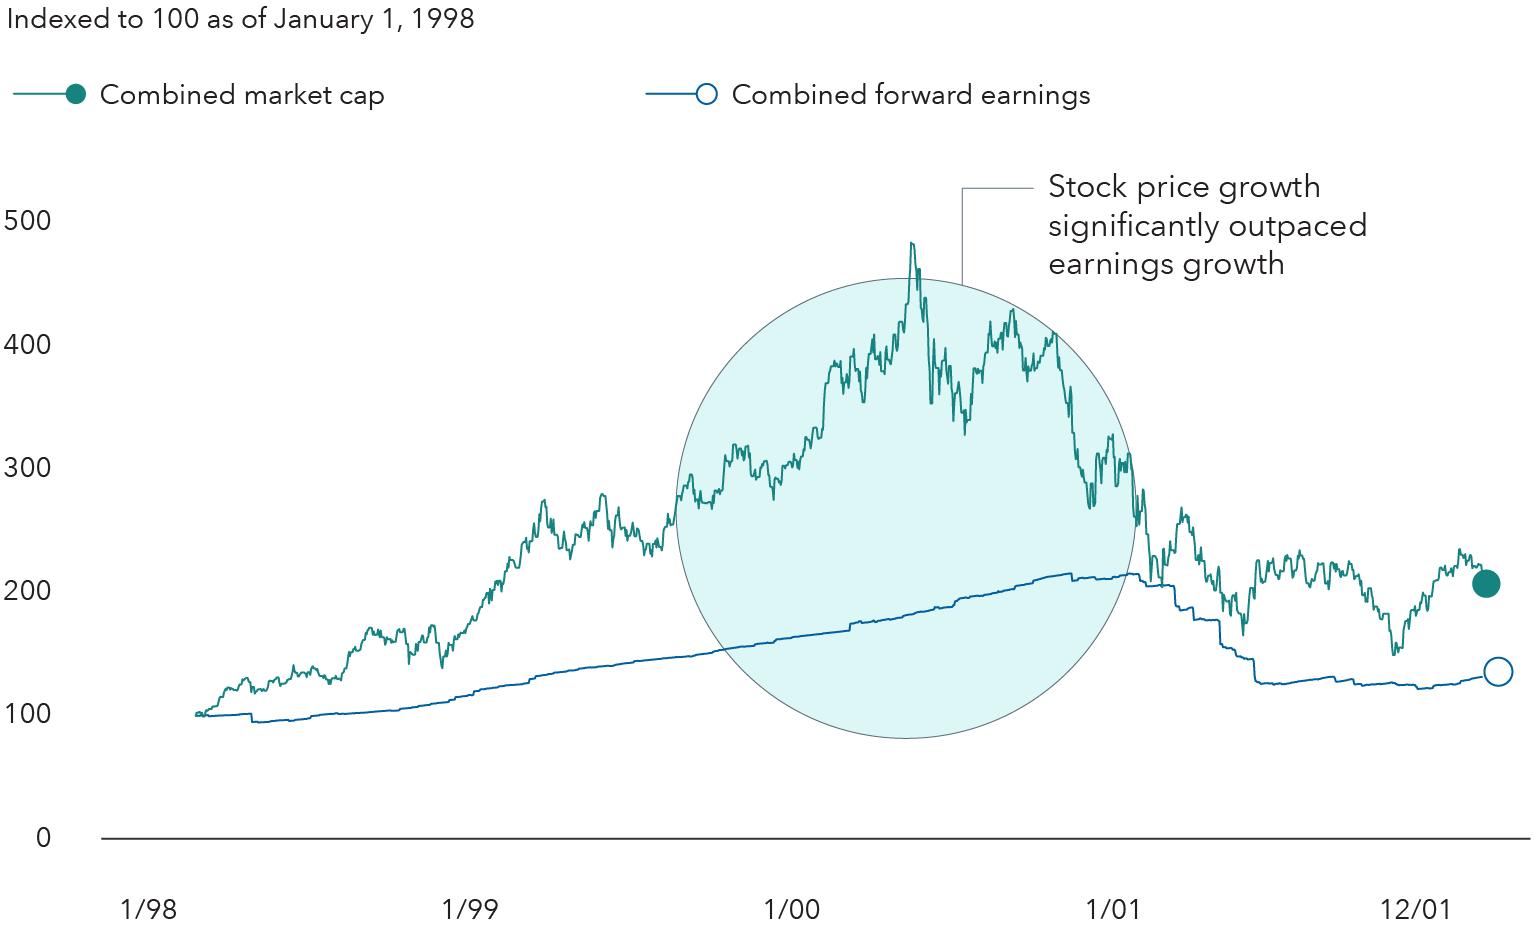
Sources: Capital Group, Bloomberg. Data aggregates forward 12-month net income (“forward earnings”) and market capitalization (“market cap”) for Microsoft, Cisco, Intel and Dell, four of the largest and best performing companies of that period. As of December 31, 2001.
AI era: Price vs. earnings (2020-present)
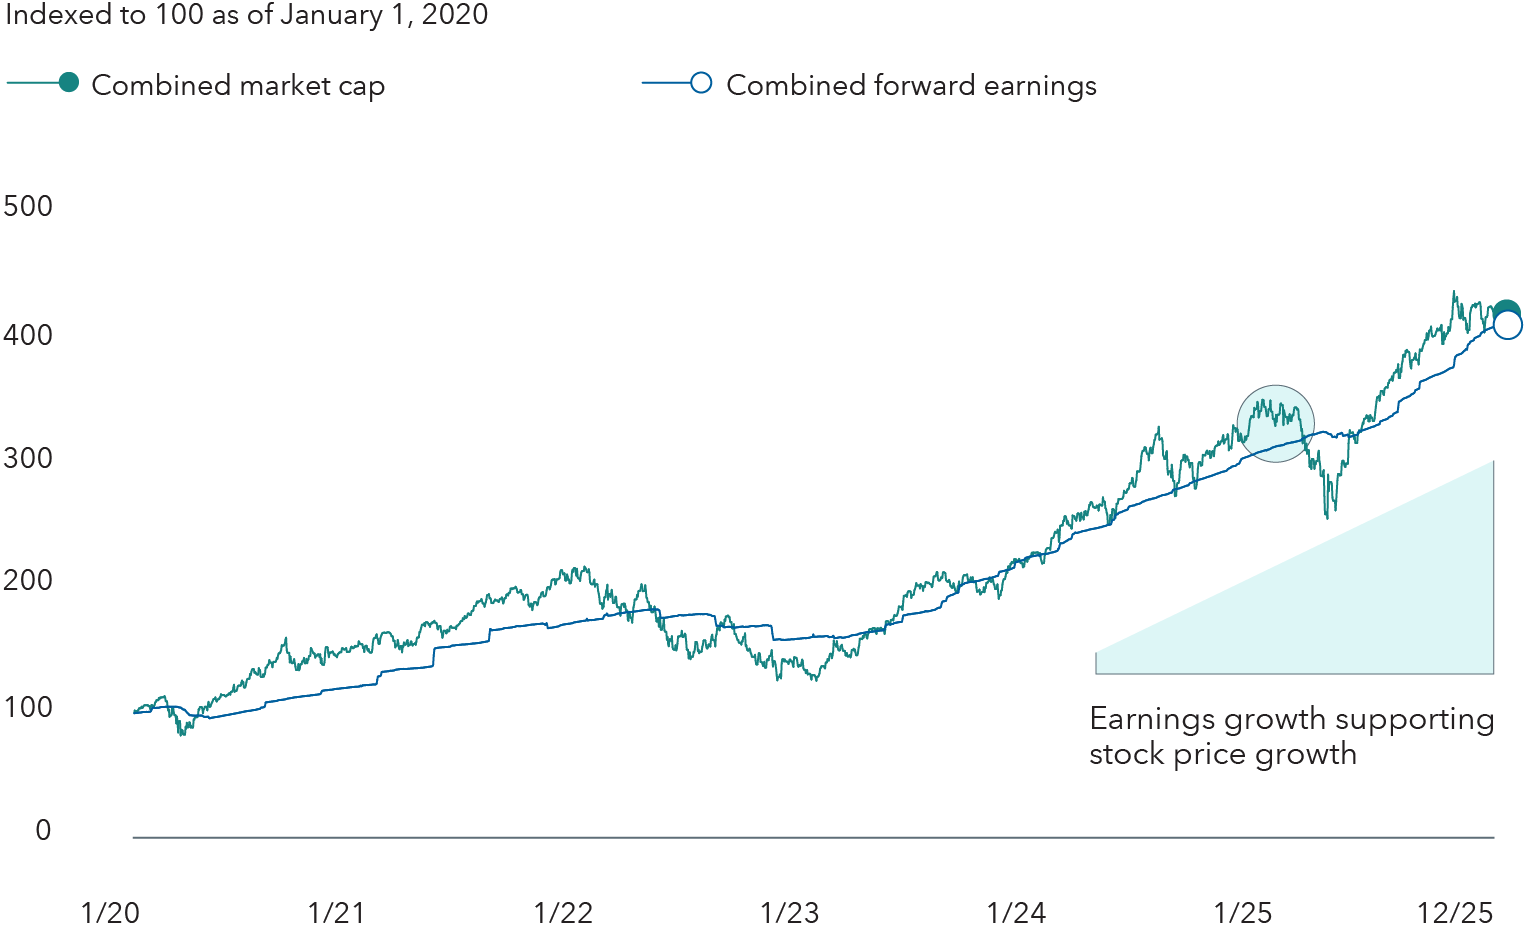
Sources: Capital Group, Bloomberg. Data aggregates forward 12-month net income (“forward earnings”) and market capitalization (“market cap”) for NVIDIA, Microsoft, Apple, Amazon, Meta, Broadcom and Alphabet, seven of the largest AI-exposed companies. As of December 31, 2025.
Are we in an AI bubble? Investors have been struggling with that question for more than two years. With AI-related stocks rallying like it’s 1999, comparisons to the days of “irrational exuberance” are everywhere. If there is a bubble in the making, it’s important to determine where we might be on that late 1990s timeline. Is the year 2000 the appropriate analogy, which would imply a bubble is about to pop, or is it 1998, indicating that AI stocks still have room to run?
“I think we are closer to 1998 than 2000,” says Chris Buchbinder, a Capital Group equity portfolio manager. As a former telecom analyst, he’s experienced dot-com euphoria. “It’s possible we will see an AI bubble at some point, but I don’t think we’re there yet.”
Today, stock prices for AI leaders are generally supported by solid earnings growth. What’s more, companies making aggressive AI-related investments — Alphabet, Amazon, Broadcom, Meta, Microsoft and NVIDIA, among others — can support their massive capital spending far better than the upstarts of the late 1990s.
“In my view,” Buchbinder adds, “it’s too early to let the risk of a bubble overcome the compelling opportunities presented by this formidable technology.”
5. There are always reasons not to invest
A pandemic, wars, inflation and high tariffs have sent shock waves through the global economy in recent years. For many investors, sitting on the sidelines as these events unfolded seemed like the most sensible response. Yet, time after time, financial markets pushed through turbulence and reached new highs.
Take the sweeping tariffs President Trump levied on nearly all major U.S. trading partners in the spring of 2025. The S&P 500 Index plunged as much as 18.7% from its peak in February as investors feared the global economy would enter a deep downturn. But trade deals and continued economic resilience helped calm those anxieties. By year’s end, the S&P 500 Index recovered and finished up 17.9%.
“Looking ahead in 2026, I’m both excited and uneasy,” Romo says. “We’re living through a tech revolution driven by artificial intelligence, and the world is undergoing structural shifts both in trade and the international order we’ve known for decades. But I’m reminded of what our past American Funds Distributors President and Chairman Graham Holloway said in 1981: ‘I have never known a good time to invest.’”
The lesson is not new. There have always been reasons to wait. It was true in 1981, 2020, and today. But markets have been resilient over time. History shows that investors who look beyond short-term uncertainty and remain committed to their long-term goals have often been rewarded, though there have been times when markets declined.
The stock market has climbed past several crises
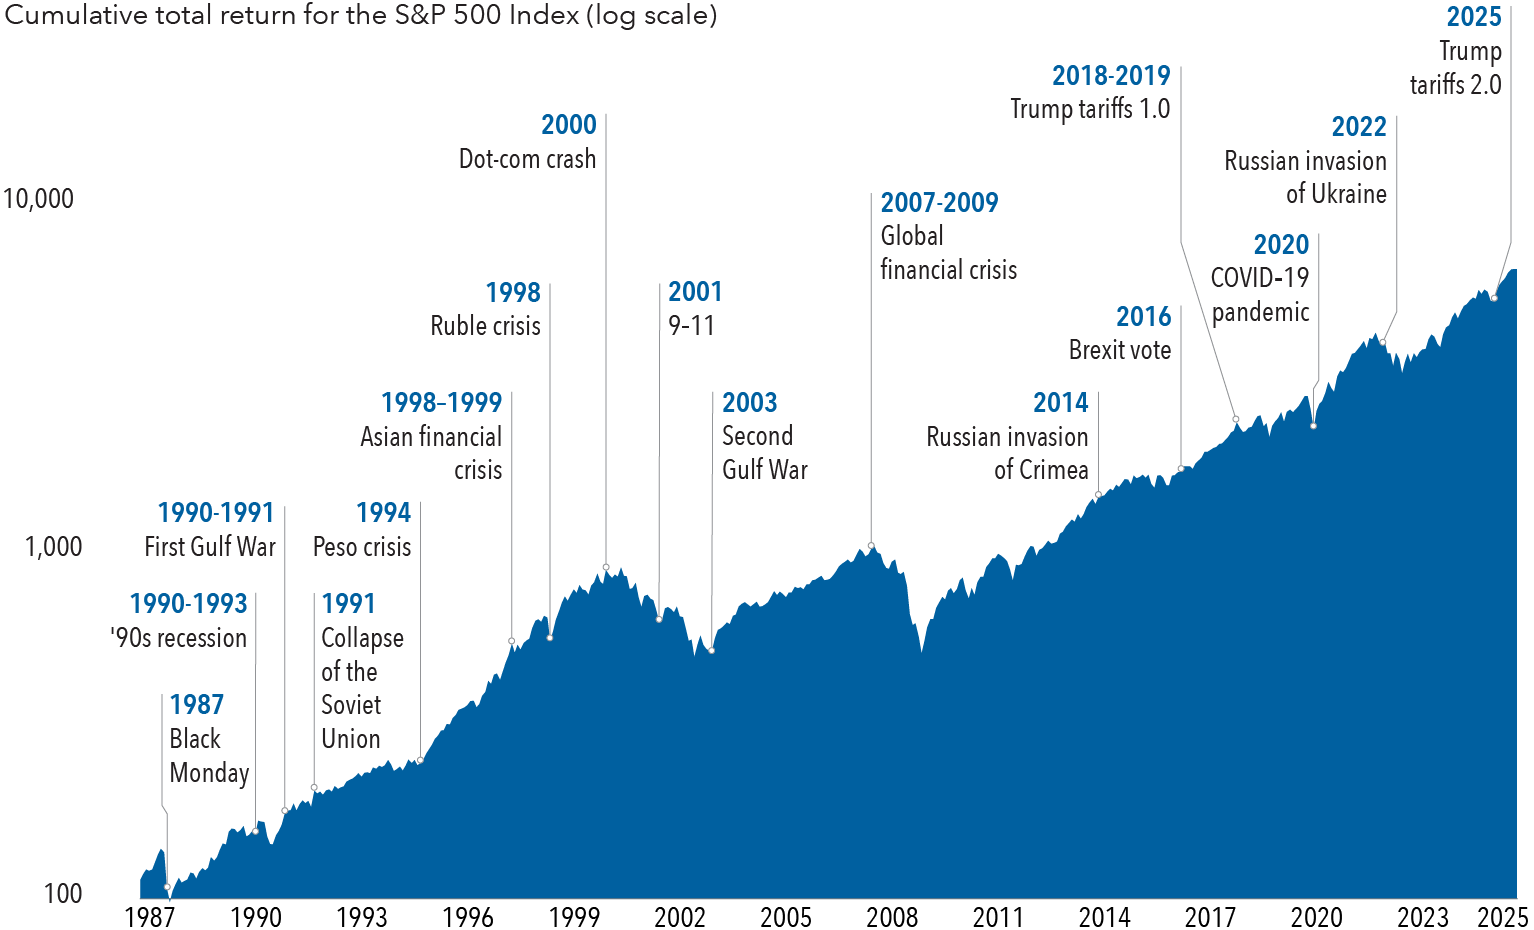
Sources: Capital Group, Standard & Poor's. As of December 31, 2025. Data is indexed to 100 as of January 1, 1987, based on cumulative total returns for the S&P 500 Index.
Explore topics
Past results are not predictive of results in future periods.
The market indexes are unmanaged and, therefore, have no expenses. Investors cannot invest directly in an index.
Gross domestic product (GDP) is the market value of the goods and services produced by labor and property located in the United States for one year.
The Magnificent Seven are a group of stocks consisting of Alphabet, Amazon, Apple, Meta, Microsoft, NVIDIA and Tesla.
Bloomberg U.S. Aggregate Index represents the U.S. investment-grade fixed-rate bond market.
Bloomberg U.S. Treasury Bill 1-3 Months Index tracks the market for Treasury bills with 1 to 3 months to maturity issued by the U.S. government.
MSCI World ex USA Index is designed to measure equity market results of developed markets. The index consists of more than 20 developed market country indexes, excluding the United States.
MSCI China Index captures large- and mid-cap representation across China A shares, H shares, B shares, Red chips, P chips and foreign listings (e.g. ADRs).
MSCI Emerging Markets Index captures large- and mid-cap representation across 27 emerging markets (EM) countries.
MSCI Europe Index is designed to measure developed equity market results across 15 developed countries in Europe.
MSCI Japan Index is a free float-adjusted market capitalization-weighted index designed to measure the equity market results of Japan.
S&P 500 Index is a market capitalization-weighted index based on the results of approximately 500 widely held common stocks.
BLOOMBERG® is a trademark and service mark of Bloomberg Finance L.P. and its affiliates (collectively “Bloomberg”). Bloomberg or Bloomberg’s licensors own all proprietary rights in the Bloomberg Indices. Neither Bloomberg nor Bloomberg’s licensors approves or endorses this material, or guarantees the accuracy or completeness of any information herein, or makes any warranty, express or implied, as to the results to be obtained therefrom and, to the maximum extent allowed by law, neither shall have any liability or responsibility for injury or damages arising in connection therewith.
©2025 Morningstar, Inc. All rights reserved. The information contained herein: (1) is proprietary to Morningstar and/or its content providers; (2) may not be copied or distributed; and (3) is not warranted to be accurate, complete or timely. Neither Morningstar nor its content providers are responsible for any damages or losses arising from any use of this information. Past performance is no guarantee of future results.
Source: MSCI. The MSCI information may only be used for your internal use, may not be reproduced or redisseminated in any form and may not be used as a basis for or a component of any financial instruments or products or indices. None of the MSCI information is intended to constitute investment advice or a recommendation to make (or refrain from making) any kind of investment decision and may not be relied on as such. Historical data and analysis should not be taken as an indication or guarantee of any future performance analysis, forecast or prediction. The MSCI information is provided on an “as is” basis and the user of this information assumes the entire risk of any use made of this information. MSCI, each of its affiliates and each other person involved in or related to compiling, computing or creating any MSCI information (collectively, the “MSCI Parties”) expressly disclaims all warranties (including, without limitation, any warranties of originality, accuracy, completeness, timeliness, non-infringement, merchantability and fitness for a particular purpose) with respect to this information. Without limiting any of the foregoing, in no event shall any MSCI Party have any liability for any direct, indirect, special, incidental, punitive, consequential (including, without limitation, lost profits) or any other damages. (www.msci.com)
The S&P 500 Index is a product of S&P Dow Jones Indices LLC and/or its affiliates and has been licensed for use by Capital Group. Copyright © 2025 S&P Dow Jones Indices LLC, a division of S&P Global, and/or its affiliates. All rights reserved. Redistribution or reproduction in whole or in part is prohibited without written permission of S&P Dow Jones Indices LLC.
Related insights
-
-
U.S. Federal Reserve
-
Economic Indicators