Capital IdeasTM
Investment insights from Capital Group
Economic Indicators
 Jared Franz
 Robert Lind
 Pramod Atluri
Get the Outlook
2024 report
Under the weight of elevated inflation and high interest rates, the world’s major economies are diverging. Surprising resilience in the United States, Japan and India is helping to boost the global economic outlook for 2024, while ongoing signs of weakness in Europe and China are tempering expectations for the new year.
International Monetary Fund forecasts call for global growth to average 2.9% in 2024, down slightly from 3% in 2023.
US economic strength may boost global growth
“The resilience of the US economy, in particular, really has been remarkable when you consider how much consumer prices have gone up and how aggressively the Federal Reserve has raised interest rates,” says Capital Group US economist Jared Franz.
“It’s a testament to the American consumer and labour market durability,” Franz adds. “It has certainly helped alleviate some of the worries about an impending recession. That could still happen, but I think the risk has declined substantially.”
Expect mixed results for global economic growth in 2024
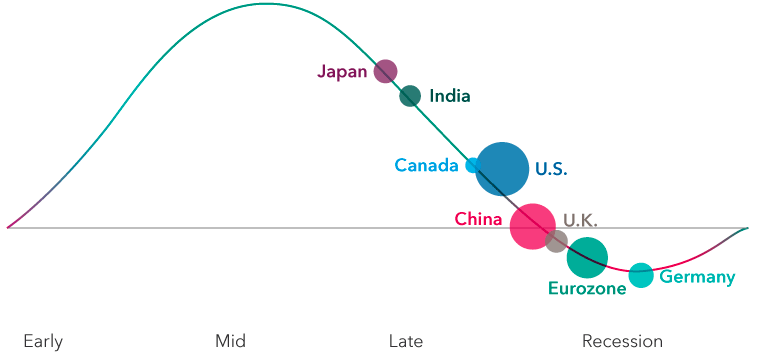
Source: Capital Group. Country positions within the business cycle are forward-looking estimates by Capital Group economists as of October 2023. The size of the bubbles represents the approximate relative size of each economy and are for illustrative purposes only.
The world’s two other largest economies, Europe and China, are expected to weigh on global growth as both struggle with an increasingly difficult environment for trade and rising geopolitical tensions.
Germany, the biggest economy in Europe, is already contracting due to a sharp slowdown in manufacturing activity and waning demand from China, its largest trading partner. Meanwhile, the full 20-member eurozone and the UK are flatlining and could have a more difficult time if energy prices continue to rise as drastically as they have over the past two years.
“The energy shock and higher interest rates are feeding through to weaker industrial activity,” says Robert Lind, Capital Group’s Europe economist. “That’s been made worse by a continuing slowdown in China’s economy. As a result, many European companies are sitting on large inventories.”
While Lind expects the European economy to pick up in 2024, he believes it could be a shallow recovery.
Interest rate outlook: Back to the “old normal”
While high interest rates are impacting economies in different ways, the chances of a sharp decline in rates are diminishing. That means a return to the era of near-zero rates is not likely to happen any time soon, says Pramod Atluri, a fixed income portfolio manager.
“I’m optimistic that consumers will continue to carry the economy, even as rates remain higher for an extended period,” Atluri explains. That’s partly because wages and home values remain above pre-pandemic levels, which has helped support consumer spending. A federal spending spree, especially on US infrastructure projects, has also supported economic growth.
Interest rates today are within the range of historical norms
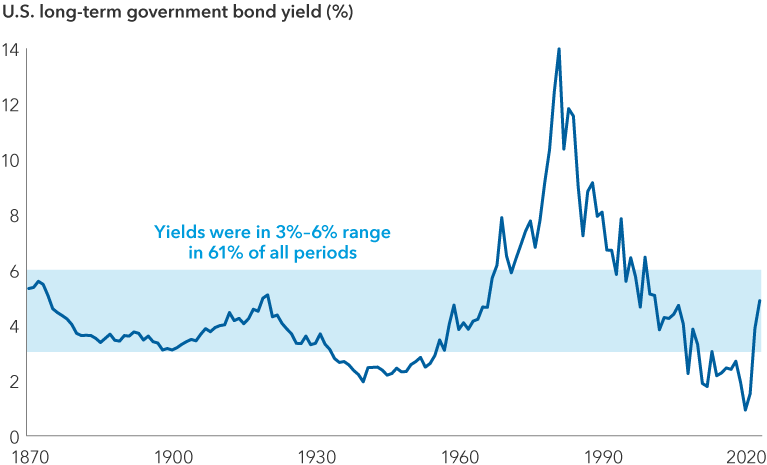
Sources: Federal Reserve, Robert Shiller. Data for 1871–1961 represents average monthly U.S. long-term government bond yields compiled by Robert Shiller. Data for 1962–2022 represents 10-year Treasury yields, as of 31 December each year within the period.
Looking to 2024, Atluri believes 10-year US Treasury yields may remain at levels considered normal prior to the global financial crisis and hover in a range of 3.5% to 5.5%. Call it the “old normal.” Going all the way back to 1870 — or roughly 61% of the time — rates have stayed mostly in the range of 3.0% to 6.0%.
While the run-up in rates could weigh on financial markets, investors will likely adjust to that environment, Atluri adds. When 10-year rates were 4.0% to 6.0%, the average annual return since 1976 for the S&P 500 Index was 10.38%, while the Bloomberg US Aggregate Bond Index returned 6.59%. (Data is from 31 December, 1976 to 31 October, 2023.)
Window of opportunity to move cash off the sidelines
Assuming most central banks are done — or nearly done — raising rates, that presents an opportunity for investors to get off the sidelines. The exodus from stock and bond markets into cash over the past few years was understandable, but those who remain uninvested may miss out on an opportunity to position their portfolios for long-term success.
Historically speaking, the time between the end of a rate-hiking cycle and the initial rate cut has signaled a crucial opportunity for investors to redeploy cash into stocks and bonds. In the past, that “window” has lasted an average of 10 months.
Following the last four Fed tightening cycles, stocks and bonds greatly outpaced US 3-month Treasury-bill returns in the first year after the last Fed hike. Conversely, the 3-month Treasury yield, a benchmark Treasury security with a yield similar to cash-like investments, fell rapidly — declining by an average of 2.5% in the 18 months after the last Fed hike.
“I believe we’re on the cusp of a major transition where long-term investors can find attractive investment opportunities in stocks and bonds,” says Mike Gitlin, president and chief executive officer of Capital Group.
After Fed hikes ended, stocks and bonds have outpaced cash
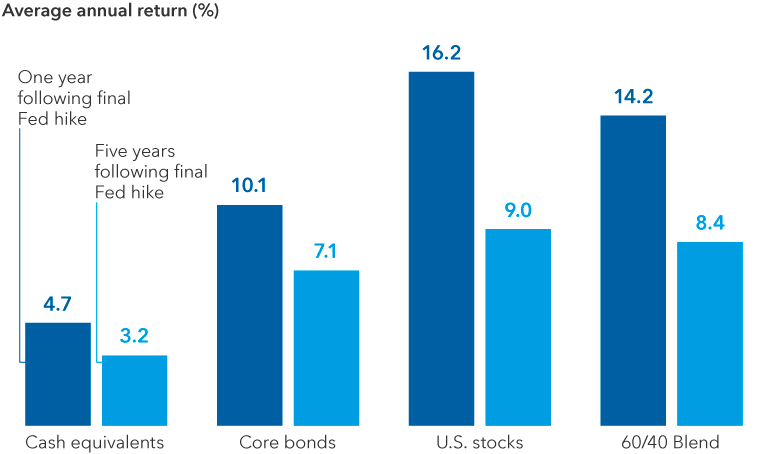
Sources: Capital Group, Morningstar. Chart represents the average returns across respective sector proxies in a forward extending window starting in the month of the last Fed hike in the last four transition cycles from 1995 to 2018 with data through 30 June, 2023. Benchmarks represent US 3-month Treasury-bill (cash equivalents), Bloomberg US Aggregate Index (core bonds), S&P 500 Index (U. stocks) and a blend of the 60% S&P 500 Index and 40% Bloomberg US Aggregate Index (60/40 blend). Long-term averages represented by the average five-year annualized rolling returns from 1995. Past results are not predictive of results in future periods.
History has favored patient investors in election years
2024 will be a pivotal election year, not only in the United States but in many other countries, including India, Russia, South Africa, Taiwan and the UK Globally speaking, it could be one of the most impactful election years in history.
The US presidential election will take center stage. And while it is still nearly a year away, investors may be feeling anxious about how markets will react to a potentially volatile campaign season and the possibility of a close vote, not unlike the 2020 election.
“Several key issues will certainly be top of mind for voters, including international policy, the impact of inflation and numerous key social issues," says Capital Group political economist Matt Miller. “But a lot can change between now and November. That’s a lifetime in politics.”
Although markets can be volatile in election years, for long-term investors the political party that wins the White House has had little impact on returns. Since 1936, the 10-year annualised return of US stocks (as measured by the S&P 500 Index) made at the start of an election year was 11.2% when a Democrat won and 10.5% in years when a Republican prevailed.
Red, blue and you: Party doesn't matter much for investors
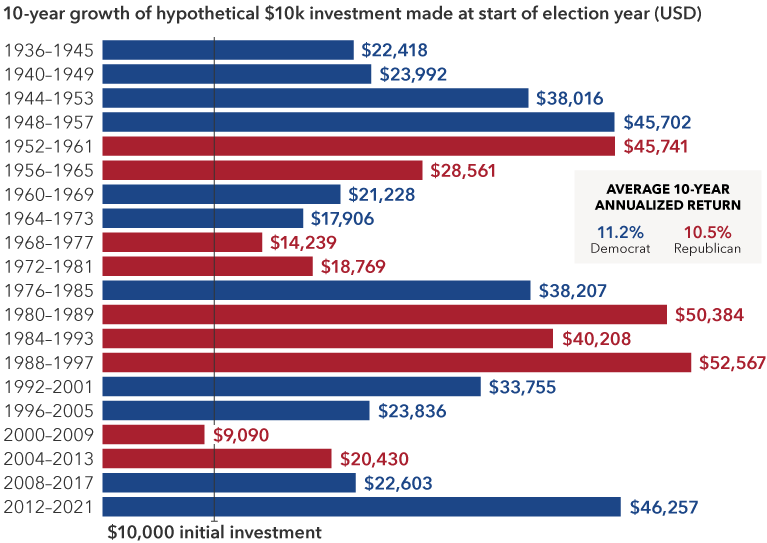
Sources: Capital Group, Standard & Poor’s. Each 10-year period begins on January 1 of the first year shown and ends on 31 December of the tenth year. For example, the first period covers 1 January, 1936 through 31 December, 1945. Figures shown are past results and are not predictive of results in future periods.
Capital Group portfolio manager Rob Lovelace, who has invested through many election cycles in his 37-year career, says the added political uncertainty can provide attractive investment opportunities at times.
“When everyone is worried that a new government policy is going to hurt a sector, that concern is usually overblown,” says Lovelace. “High-quality companies often get caught in the political crosshairs, which can create a buying opportunity. But I aim for a long average holding period in my portfolios, so I typically try to look beyond the election cycle.”
Outlook 2024 Webinar
Our latest insights
RELATED INSIGHTS
-
Portfolio Construction
-
-
Fixed Income
Hear from our investment team.
Sign up now to get industry-leading insights and timely articles delivered to your inbox.
Past results are not predictive of results in future periods. It is not possible to invest directly in an index, which is unmanaged. The value of investments and income from them can go down as well as up and you may lose some or all of your initial investment. This information is not intended to provide investment, tax or other advice, or to be a solicitation to buy or sell any securities.
Statements attributed to an individual represent the opinions of that individual as of the date published and do not necessarily reflect the opinions of Capital Group or its affiliates. All information is as at the date indicated unless otherwise stated. Some information may have been obtained from third parties, and as such the reliability of that information is not guaranteed.
Capital Group manages equity assets through three investment groups. These groups make investment and proxy voting decisions independently. Fixed income investment professionals provide fixed income research and investment management across the Capital organisation; however, for securities with equity characteristics, they act solely on behalf of one of the three equity investment groups.