Categories
Long-Term Investing
Capital market assumptions: Diverse opportunities amid elevated valuations
 Raj Paramaguru
 Eswarie Balan
 Michele Mazzoleni
 Darrell Spence
 Tryggvi Gudmundsson
February 3, 2026
With elevated valuations, there are modest changes to our 2026 capital market assumptions (CMAs), bringing expectations for both stocks and bonds slightly lower. Even so, the long-term picture remains fairly balanced, with expected returns for equities and fixed income settling in the mid-single-digit range. The assumptions now expect return opportunities in fixed income over the coming two decades to be higher than realized over the prior 20 years, while our expectations for global equities are lower relative to the returns of the prior two decades.
Trade tensions, policy uncertainty and the rapid rise of artificial intelligence (AI) have shaped much of the market conversation. U.S. tariffs have impacted growth and inflation, though not enough to disrupt the broader global economy. Conversely, the boom in AI and the buildout of related infrastructure could become a powerful long-term engine for productivity and economic expansion.
Capital Group’s CMAs are built on a 20-year investment horizon, reflecting a long-term, structural approach to investing. This perspective underpins key solutions, including target date funds, model portfolios, long-horizon portfolios and liability-driven strategies. With this perspective in mind, below are key elements of our 2026 CMAs.
Macro view: AI is offsetting economic headwinds
Growth assumptions over the next 20 years remain broadly similar relative to last year and lower compared to prior decades. The U.S. long-term real GDP growth forecast has been revised slightly higher to 2.4%, driven by expectations that AI-powered productivity gains and increased capital investment could offset demographic headwinds.
The estimate for Japan’s long-term GDP is relatively unchanged at 0.7%, but slightly lower than last year. This reflects a structural decline in the size of Japan’s labor force, making significant expansion of the economy difficult.
Our global inflation assumptions are also steady and generally aligned with central bank targets. These long horizon views smooth short-term volatility and reflect counteracting economic forces.
Our outlook for U.S. inflation, as measured by the Consumer Price Index (CPI), remains unchanged at 2.3%. We continue to expect the Federal Reserve will be successful in keeping inflation in line with its target. Tariffs and supply chain adjustments may push near-term inflation higher, though technological progress should help contain unit labor costs and stabilize prices over the forecast horizon.
U.S. economic growth continues to outpace peers
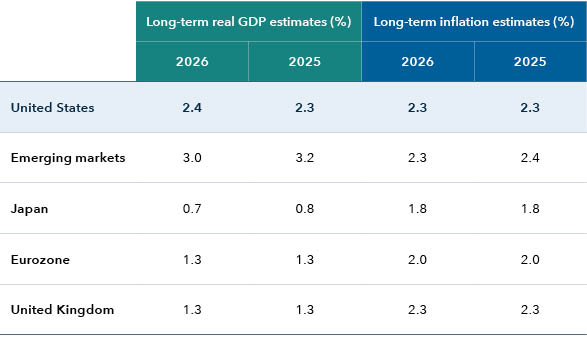
Source: Capital Group. Data represents 20-year forecasts. Estimates as of September 30, 2025.
Rising investment in AI presents an opportunity for meaningful long-term productivity gains, although demographic trends may offset some of these benefits. Investments in AI extend beyond Big Tech, with utilities, telecom and industrial sectors all playing a key role. For example, power use is expected to grow, while industrial firms are providing parts to build physical infrastructure such as data centers.
Although optimism around AI is widespread, it is prudent to remain mindful of the potential downside risks. Such headwinds may include implementation challenges, cost overruns, regulatory restrictions, labor market disruptions and cybersecurity issues.
Potential productivity trajectories under different AI scenarios
Sources: Capital Strategy Research, National Bureau of Economic Research, Ping Wang — Washington University in St Louis, Tsz-Nga Wong — Federal Reserve Bank of Richmond. Data as of May 2025. The percentages for each category represent hypothetical labor productivity growth attributable to AI. No AI: Represents a hypothetical scenario in which AI fails to take hold. Some AI: Represents a hypothetical scenario where AI takes off but stops at a limited capability. Unbounded AI: Represents a hypothetical scenario where AI sustains endogenous growth in the long run. Capital Strategy Research: Represents an AI adoption forecast from Capital Group economists.
Equities: Heightened valuations push our returns outlook a touch lower
Our return expectations for equities are slightly lower after another strong year of double-digit gains across most regions. Despite support from robust GDP growth and benign interest rate expectations, we believe returns over the coming two decades will be lower than what has been realized over the prior 20 years.
In the long run, emerging markets returns are expected to exceed that of the U.S., which is in turn expected to have higher returns than developed market economies outside the U.S. The table below highlights the relative attractiveness of emerging markets versus the U.S. over the 20-year period. Emerging markets GDP, and therefore earnings growth, is higher relative to developed markets outside the U.S., and valuations in emerging markets are expected to remain relatively supportive. Nevertheless, several structural challenges in emerging economies, such as weak corporate governance and less mature capital markets, require vigilance.
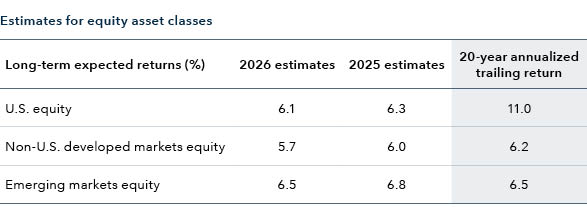
Source: Capital Group. The 2026 estimates are as of December 31, 2025, with valuations as of September 30, 2025. The 2025 estimates are as of December 31, 2024, with valuations as of September 30, 2024. The long-term expected returns are trailing geometric returns, which are compounded average rates of return over multiple periods.
Zooming out, the focus remains on U.S. equities given significant concentration on mega-cap technology stocks. Although the region remains a beneficiary of strong corporate fundamentals and earnings growth, stretched valuations temper our return expectations.
Fixed income: Long-term optimism
We anticipate fixed income returns over the 20-year horizon to be higher than what they were in the prior 20 years.
Diving into our new assumptions, on aggregate, our expectations for fixed income are slightly lower compared to last year, in part due to lower starting yields.
The expectation for higher terminal rates across the board is largely underpinned by better growth prospects — a function of better productivity and capital deepening. We anticipate yield curves to steepen and revert to historical medians.
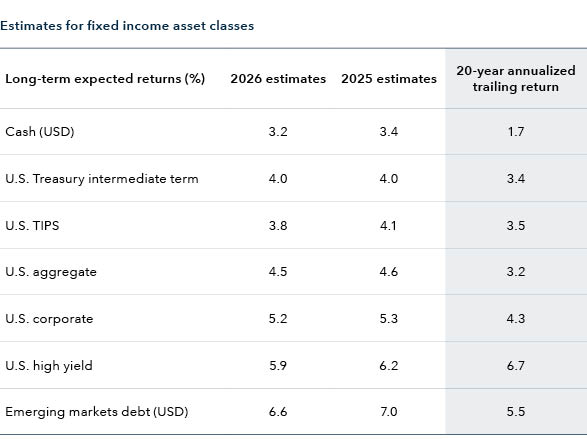
Source: Capital Group. The 2026 estimates are as of December 31, 2025, with valuations as of September 30, 2025. The 2025 estimates are as of December 31, 2024, with valuations as of September 30, 2024. The long-term expected returns are geometric returns, which are compounded average rates of return over multiple periods.
Currencies: Dollar depreciation likely to be gradual
There are some challenges to the dollar’s global dominance, driven by risks to Federal Reserve independence, fiscal vulnerabilities and growing momentum behind de-dollarization. Still, there is no immediate threat to the dollar’s dominant status. It remains the primary currency for trade and capital flows, a cornerstone of official reserves and a historically preferred store of value during periods of economic stress.
We expect that the U.S. dollar will likely depreciate against a broad basket of currencies at a pace of -0.5% annually. Our forecast is unchanged from last year despite marginally higher expectations for U.S. productivity compared to other countries.
Currencies such as the Japanese yen are expected to appreciate relative to last year, while the euro and British pound are expected to depreciate further, balancing out the net impact on the dollar.
Cross-asset implications
The chart below illustrates the returns and volatilities expected across equity and fixed income asset classes available to asset allocators. Across asset classes, our CMAs suggest stable long-run macro conditions but thinner risk premia (or lower compensation for taking risk) and a wider distribution of potential outcomes. Higher expectations for long-term yields and positive term premia (the extra yield that investors require to commit to holding a long-term bond instead of a series of shorter term bonds) make rate-sensitive fixed income assets more attractive than they have been for much of the past decade.
Sources: Capital Strategy Research, National Bureau of Economic Research, Ping Wang — Washington University in St Louis, Tsz-Nga Wong — Federal Reserve Bank of Richmond. Data as of May 2025. The percentages for each category represent hypothetical labor productivity growth attributable to AI. No AI: Represents a hypothetical scenario in which AI fails to take hold. Some AI: Represents a hypothetical scenario where AI takes off but stops at a limited capability. Unbounded AI: Represents a hypothetical scenario where AI sustains endogenous growth in the long run. Capital Strategy Research: Represents an AI adoption forecast from Capital Group economists.
Looking ahead, portfolio construction in the current economic environment is likely to call for greater emphasis on diversification, active security selection and fundamental research across asset classes and regions.
Learn more about
This analysis represents the views of a small group of investment professionals based on their individual research and are approved by the Capital Market Assumptions Oversight Committee. They should not be interpreted as the view of Capital Group as a whole. As Capital Group employs The Capital System™, the views of other individual analysts and portfolio managers may differ from those presented here. They are provided for informational purposes only and are not intended to provide any assurance or promise of actual returns. They reflect long term projections of asset class returns and are based on the respective benchmark indices, or other proxies, and therefore do not include any outperformance gain or loss that may result from active portfolio management. Note that the actual results will be affected by any adjustments to the mix of asset classes. All market forecasts are subject to a wide margin of error.
Past results are not predictive of results in future periods.
Bond ratings, which typically range from AAA/Aaa (highest) to D (lowest), are assigned by credit rating agencies such as Standard & Poor’s, Moody’s and/or Fitch, as an indication of an issuer’s creditworthiness. If agency ratings differ, the security will be considered to have received the highest of those ratings, consistent with the fund’s investment policies.
Lower rated bonds are subject to greater fluctuations in value and risk of loss of income and principal than higher rated bonds.
Glossary:
Capital market assumptions (CMAs): Long-term projections of the future performance of asset class returns based on their respective benchmark indexes or other proxies that incorporate analysis and observations.
Consumer Price Index (CPI): A measure of the average change over time in the prices paid by urban consumers for a market basket of consumer goods and services.
Duration: The measurement of the sensitivity of the price of a bond or debt instrument to the change in interest rates. The higher the duration, the more a bond’s price will drop as interest rates rise, and the greater the interest rate risk.
Geometric return: Also known as the compound annual growth rate (CAGR), it is a measure of compound growth rates of investment results over multiple periods.
Multiple: A way of assessing the value of a company by comparing it to peers, usually by a ratio. This helps to quantify a company's health and find investment opportunities.
Terminal yield: The value of a debt asset beyond the forecasted period when future cash flows can be estimated. In our analysis, terminal yield occurs in year 10 and stays the same for years 11 through 20.
Term premium: The additional yield investors require for holding long-term bonds as opposed to owning a series of shorter term bonds.
Volatility: The degree of variation in the price of a financial instrument over time, usually measured by standard deviation or variance.
Yield curve: An illustration of the yields on similar bonds across various maturities. An inverted yield curve occurs when yields on short-term bonds are higher than yields on long-term bonds. Yield curve steepening occurs when long-term rates rise more than short-term rates, or short-term rates fall more than long-term rates.
Index definitions:
All-country world equity: The MSCI All Country World Index (ACWI) is a free-float-adjusted, market-capitalization-weighted index that measures equity market results in global developed and emerging markets, consisting of more than 40 developed and emerging markets country indexes.
All-country world small-cap equity: The MSCI All Country World Small Cap Index is a free-float-adjusted, market-capitalization-weighted index that measures equity market results of smaller capitalization companies in both developed and emerging markets. Results reflect dividends net of withholding taxes.
Asset-backed securities (ex AAA): The Bloomberg Asset-Backed Securities Index (ex AAA) covers fixed-rated investment-grade (Baa3/BBB or higher, excluding Aaa/AAA) asset-backed securities included in the Bloomberg U.S. Aggregate Index. The index has three subsectors: credit and charge cards, autos and utilities.
Cash (USD): The FTSE 3-Month U.S. T-Bill Index Series tracks the daily performance of 3-month U.S. Treasury bills and serves as a reference rate for a series of funds.
Developed markets equity: The MSCI World Index is a free-float-adjusted, market-capitalization-weighted index that measures equity market results in global developed markets, consisting of 23 developed market country indexes.
Emerging markets debt (USD): The J.P. Morgan Emerging Markets Bond Index (EMBI) Global Diversified is a weighted emerging markets debt benchmark tracking total returns for USD-denominated bonds issued by emerging markets sovereign and quasi-sovereign entities.
Emerging markets debt (local): The J.P. Morgan Government Bond Index — Emerging Markets (GBIEM) Global Diversified covers regularly traded, liquid, fixed-rate, domestic-currency emerging markets government bonds accessible to international investors.
Emerging markets equity: The MSCI Emerging Markets Index is a free-float-adjusted, market-capitalization index measuring equity performance of emerging markets.
Global aggregate: The Bloomberg Global Aggregate Bond Index measures global investment-grade bonds, including Treasury, government-related, corporate and securitized fixed-rate bonds from both developed and emerging markets issuers.
Municipal bonds: The Bloomberg Municipal Bond Index is a market-value-weighted index representing the long-term investment-grade tax-exempt bond market.
Nikkei 225: A price-weighted index covering 225 large Japan-based companies.
Non-U.S. developed markets equity: The MSCI World ex USA Index is a free-float-adjusted, market-capitalization-weighted index measuring equity results in developed markets excluding the U.S., consisting of 22 of 23 developed markets country indexes.
Non-U.S. global aggregate: The Bloomberg Global Aggregate ex-USD Index measures global investment-grade bonds excluding the U.S., spanning Treasury, government-related, corporate and securitized fixed-rate bonds from developed and emerging markets issuers.
The S&P 500 Index: A market-capitalization-weighted index based on the results of approximately 500 widely held U.S. common stocks.
U.S. agency mortgage-backed securities: The Bloomberg U.S. Mortgage-Backed Securities Index is a market-value-weighted index covering fixed-rate, publicly issued, dollar-denominated obligations from U.S. Treasury, agencies, quasi-federal corporations, and mortgage-backed pass-through securities of Fannie Mae, Freddie Mac and Ginnie Mae.
U.S. aggregate: The Bloomberg U.S. Aggregate Bond Index represents the U.S. investment-grade fixed-rate bond market.
U.S. commercial mortgage-backed securities non-agency (ex AAA): The Bloomberg U.S. CMBS Non-Agency Ex-AAA Index measures the non-agency U.S. commercial mortgage-backed fixed income market, excluding AAA-rated issues.
U.S. corporate: The Bloomberg U.S. Corporate Investment Grade Index represents investment-grade, publicly issued U.S. corporate and specified international debentures and secured notes meeting defined maturity, liquidity and quality standards.
U.S. corporate long duration: The Bloomberg U.S. Long Corporate A or Better Index (1% Issuer Cap) tracks high-quality, long-maturity U.S. corporate bonds rated A or better, with no single issuer exceeding 1% of the index.
U.S. equity: The MSCI USA Index is a free-float-adjusted, market-capitalization-weighted index measuring the U.S. portion of the global equity market. Results reflect dividends gross of withholding taxes.
U.S. high yield: The Bloomberg U.S. Corporate High Yield Index 2% Issuer Cap covers fixed-rate, non-investment-grade debt, capping exposure to any single issuer at 2%.
U.S. small-cap equity: The MSCI USA Small Cap Index is a free-float-adjusted, market-capitalization-weighted index measuring the small-cap segment of the U.S. market.
U.S. TIPS: The Bloomberg U.S. Treasury Inflation-Protected Securities (TIPS) Index includes investment-grade, fixed-rate, USD-denominated, non-convertible inflation-protected securities issued by the U.S. Treasury with at least one year to maturity and $250 million minimum par outstanding.
U.S. Treasury short term: The Bloomberg 1-5 Year U.S. Treasury Index measures USD-denominated, fixed-rate, nominal U.S. Treasury debt with maturities from one to five years.
U.S. Treasury intermediate term: The Bloomberg 5-10 Year U.S. Treasury Index measures USD-denominated, fixed-rate, nominal U.S. Treasury debt with maturities from five to ten years.
U.S. Treasury long term: The Bloomberg 10–20 Year U.S. Treasury Index measures USD-denominated, fixed-rate, nominal U.S. Treasury debt with maturities of 10 to 20 years. The Bloomberg 20+ Year U.S. Treasury Index measures USD-denominated, fixed-rate, nominal U.S. Treasury debt with maturities of 20 years or more.
Don't miss our latest insights.
Our latest insights
RELATED INSIGHTS
Don’t miss out
Get the Capital Ideas newsletter in your inbox every other week
Investments are not FDIC-insured, nor are they deposits of or guaranteed by a bank or any other entity, so they may lose value.
There have been periods when the results lagged the index(es) and/or average(s).
The indexes are unmanaged and, therefore, have no expenses. Investors cannot invest directly in an index.
The MSCI information may only be used for your internal use, may not be reproduced or redisseminated in any form and may not be used as a basis for or a component of any financial instruments or products or indices. None of the MSCI information is intended to constitute investment advice or a recommendation to make (or refrain from making) any kind of investment decision and may not be relied on as such. Historical data and analysis should not be taken as an indication or guarantee of any future performance analysis, forecast or prediction. The MSCI information is provided on an “as is” basis and the user of this information assumes the entire risk of any use made of this information. MSCI, each of its affiliates and each other person involved in or related to compiling, computing or creating any MSCI information (collectively, the “MSCI Parties”) expressly disclaims all warranties (including, without limitation, any warranties of originality, accuracy, completeness, timeliness, non-infringement, merchantability and fitness for a particular purpose) with respect to this information. Without limiting any of the foregoing, in no event shall any MSCI Party have any liability for any direct, indirect, special, incidental, punitive, consequential (including, without limitation, lost profits) or any other damages. Please visit the data provider's website for more information.
Information has been obtained from sources believed to be reliable, but J.P. Morgan does not warrant its completeness or accuracy. The Index is used with permission. The Index may not be copied, used, or distributed without J.P. Morgan's prior written approval. Copyright 2026, JPMorgan Chase & Co. All rights reserved.
Source: Bloomberg Index Services Limited. BLOOMBERG® is a trademark and service mark of Bloomberg Finance L.P. and its affiliates (collectively "Bloomberg"). Bloomberg or Bloomberg's licensors own all proprietary rights in the Bloomberg Indices. Neither Bloomberg nor Bloomberg's licensors approves or endorses this material, or guarantees the accuracy or completeness of any information herein, or makes any warranty, express or implied, as to the results to be obtained therefrom and, to the maximum extent allowed by law, neither shall have any liability or responsibility for injury or damages arising in connection therewith.
Each S&P Index ("Index") shown is a product of S&P Dow Jones Indices LLC and/or its affiliates and has been licensed for use by Capital Group. Copyright © 2026 S&P Dow Jones Indices LLC, a division of S&P Global, and/or its affiliates. All rights reserved. Redistribution or reproduction in whole or in part is prohibited without written permission of S&P Dow Jones Indices LLC.
Statements attributed to an individual represent the opinions of that individual as of the date published and do not necessarily reflect the opinions of Capital Group or its affiliates. This information is intended to highlight issues and should not be considered advice, an endorsement or a recommendation.
All Capital Group trademarks mentioned are owned by The Capital Group Companies, Inc., an affiliated company or fund. All other company and product names mentioned are the property of their respective companies.
Use of this website is intended for U.S. residents only.
Advisory services offered through Capital Research and Management Company (CRMC) and its RIA affiliates.
This content, developed by Capital Group, home of American Funds, should not be used as a primary basis for investment decisions and is not intended to serve as impartial investment or fiduciary advice.