Inflation
 Julian Abdey
 Pramod Atluri
 Nicholas J. Grace
The last time U.S. and Canadian inflation was in the high single digits, Ronald Reagan was president, Pierre Trudeau was prime minister and stainless-steel DeLorean sports cars were rolling off the production line.
Perhaps that’s why 2022, in some ways, feels like taking a trip back in time. High inflation, rising interest rates, a bruising bear market and a proxy war with Russia seem all too familiar to anyone who lived through the early 1980s.
Today’s market environment, however, has been shaped by an entirely different event. The COVID-19 pandemic and, crucially, the response to the pandemic have created large distortions in the economy and markets — from sky-high inflation to chronic labour shortages to broken supply chains.
Which of these COVID distortions will fade over time and which will remain long term? That is a key question for investors.
“There are some aspects of the pandemic that are fleeting and some that will persist,” says portfolio manager Alan Wilson. “That’s the issue we are grappling with today. We need to get the answer right because it will likely determine which companies thrive in a post-COVID world and which fall behind.”
Why is inflation so high?
With elevated inflation representing the most impactful distortion, a team of Capital Group portfolio managers, analysts and economists decided to study consumer price levels in 22 countries in relation to the growth of the money supply, or M2. (M2 is a broad measure of money that includes currency, coins, checking and savings deposits, as well as shares in money market funds.)
The team looked at many other COVID-related distortions, as well, some of which are covered in more detail below. But since inflation touches virtually all parts of the economy, it makes sense to start there.
Growth in the money supply has contributed to high inflation
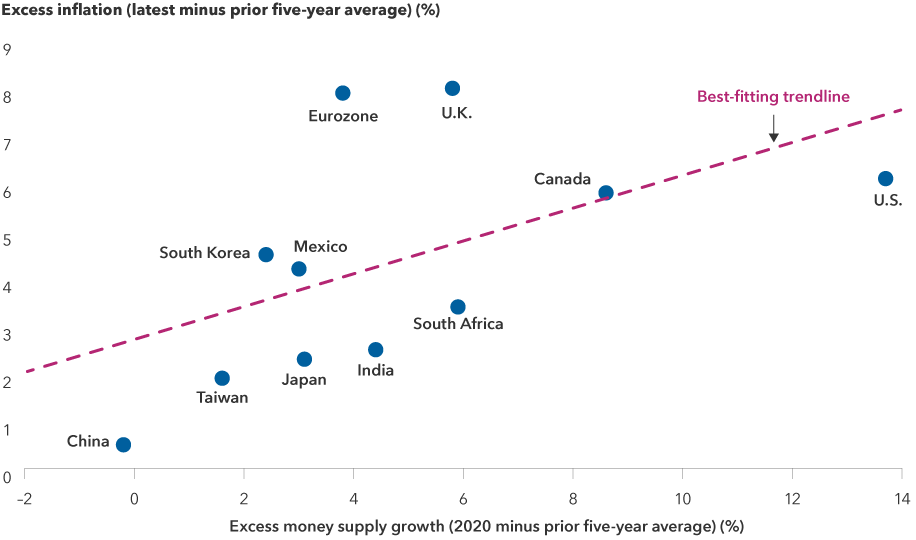
Sources: Capital Group, Refinitiv Datastream. Money supply growth above is represented by the annual change in M2 (encompassing currency and coins held by the non-bank public, checkable deposits and travelers' checks, plus savings deposits, including money market deposit accounts, small time deposits and shares in retail money market mutual funds). Inflation figures above refer to the change in the consumer price index across selected countries. The original Capital Group analysis of this data included 22 countries or regions; some were removed from the chart for ease of reading. Inflation figures are current as of August or July of 2022, reflecting the latest available data as of September 14, 2022.
As it turns out, the basic laws of economics proved correct.
A rapidly growing money supply — boosted by pandemic-era government stimulus measures, aggressive bank lending and ultra-low interest rates — coincided with drastically higher inflation. In other words, the countries that stimulated the most during the pandemic generally wound up with the highest rates of inflation.
In fact, one could argue that today’s high inflation is not the biggest distortion, but rather it was the unprecedented monetary and fiscal stimulus undertaken by the United States, Canada and Europe, among others, says portfolio manager Julian Abdey.
“I am reminded of the famous Milton Friedman quote: ‘Inflation is always and everywhere a monetary phenomenon,’” Abdey notes. “In other words, inflation is caused by too much money chasing after too few goods, and that is exactly what we are seeing today.”
Has inflation peaked?
In June, Canada’s headline annual inflation rate was 8.1%, a 39-year high while U.S. inflation hit 9.1% in June on an annual basis — the highest level since 1981. That may be near the peak for the U.S., Abdey explains, and while there could be lags, what’s important is that the U.S. Federal Reserve, the Bank of Canada (BoC) and many other central banks are now moving fast to tighten monetary policy. That should eventually bring inflation down. In addition, most governments are no longer sending pandemic support payments to businesses and individuals.
Does this mean inflation could return to the 2% level that has long been the Fed’s and other central bankers’ target?
“That is highly dependent on the Fed’s response going forward,” Abdey adds. “I can see different scenarios, including a more inflationary one, as well as the possibility of a return to deflation. If the Fed remains hawkish and tightens too much, that could result in a nasty recession. On the other hand, if it reverses course, then high inflationary expectations could become embedded into the real economy.”
Embedded high inflation expectations is a primary worry for the BoC, as it may lead firms to set prices even higher. Similarly, in response to higher expected inflation, workers may bargain for persistently higher wage growth to protect against anticipated losses in purchasing power. The resulting stronger wage growth feeds into production costs and prompts firms to raise prices even further. This boosts inflation expectations, perpetuating the spiral. In its Monetary Policy Report released in July, the Bank of Canada detailed the risks of de-anchored inflation expectations, stating it may require interest rates to rise higher and longer than currently projected, which significantly elevates the risk of recession in 2023.
The hawkish stance is evident in recent central bank actions north and south of the border. In September, the Fed and BoC announced interest rate hikes of 75 basis points, bringing the U.S. federal funds rate to a target range of 3.00% to 3.25% and the BoC’s policy rate to 3.25%.
There are signs inflation is starting to retreat. In the U.S., the August inflation reading declined to 8.3% – still a high number historically speaking, but significantly below the 9.1% reading in June. Inflation has also come down over the summer in Canada. Canada’s headline consumer price index fell from 8.1% in June to 7.6% in July and 7.0% in August.
Volatile energy prices, a main contributor to inflation in both countries, appear to have peaked over the summer and have moved lower. U.S. and Canadian gasoline prices, for example, have declined by roughly 25% over the past three months. Food prices, however, continue to rise sharply.
Energy price increases are moderating, easing inflationary pressures
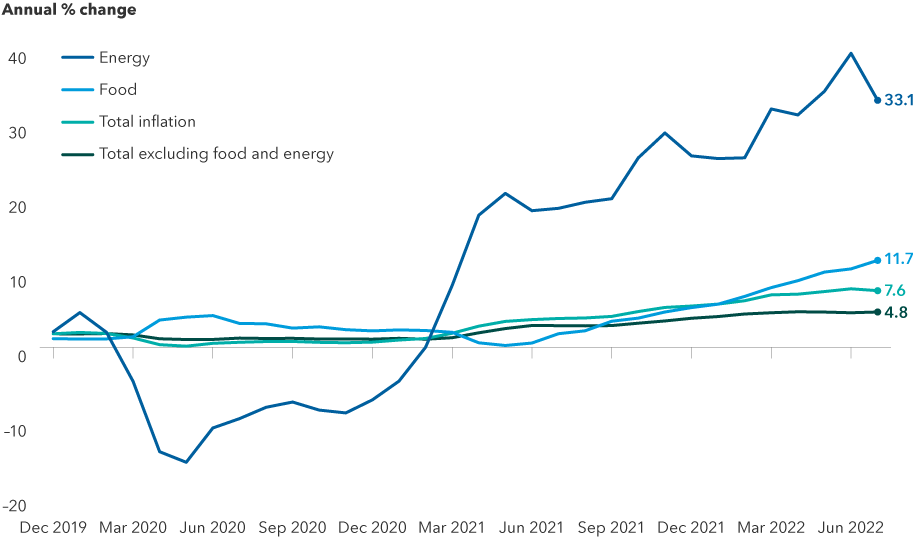
Sources: Capital Group, The Organisation for Economic Co-operation and Development (OECD). Inflation above reflects the OECD's consumer price index for G-7 countries, including Canada, France, Germany, Italy, Japan, the United Kingdom and the United States. Inflation is measured in terms of the annual growth rate in the index, using 2015 as the base year with a breakdown for food, energy and total excluding food and energy. As of July 2022.
The great resignation
Another COVID distortion that remains entrenched is the severe labour shortage. In 2021, a popular media narrative developed around the idea of “the great resignation,” inspired by U.S. government data showing that roughly 47 million people voluntarily quit their jobs that year and seemed to disappear from the workforce.
Further data and myriad surveys helped shed light on the reasons. Many quit to ultimately take better paying jobs. Some older workers opted for early retirement. And roughly 600,000 Americans decided to start their own small businesses, a trend which is hard to track through monthly employment data.
So why is the labour market still extremely tight, with the unemployment rate near a record low of 3.7% in the U.S. and 5.4% in Canada? That’s because the U.S. economy — and many other developed economies around the world — have not kept up with pre-pandemic growth trends, says Capital Group economist Jared Franz.
“Given the average annual growth in the labour force pre-COVID, we should have four to five million more workers than we have today,” Franz estimates.
Labour crunch: Where did the employees go?
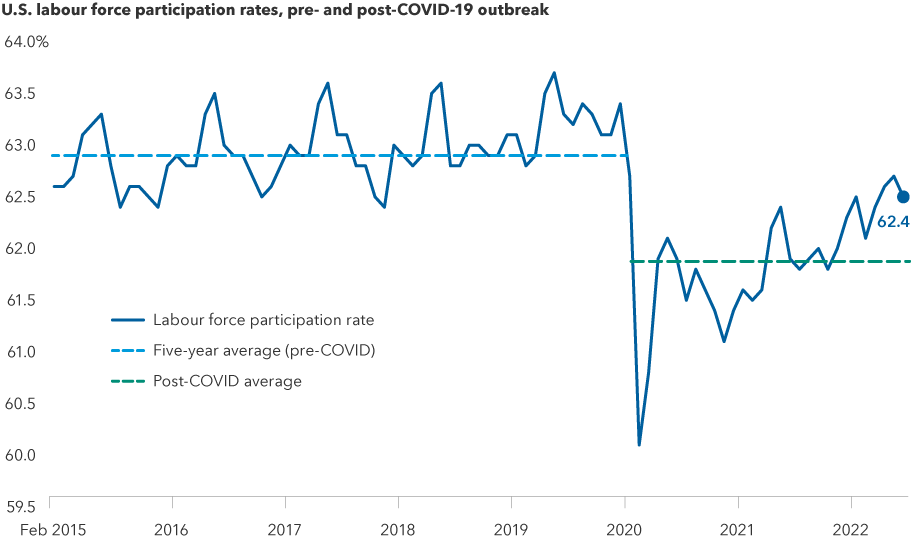
Sources: Capital Group, U.S. Bureau of Labor Statistics, Refinitiv Datastream, U.S. Department of Labor. Labour force participation rate above reflects the monthly total U.S. civilian labour force participation rate; the five-year average includes the average monthly participation rate between February 2015–February 2020; the post-Covid average reflects the average monthly participation rate between March 2020–August 2022.
This imbalance in the labour force hit some industries harder than others, particularly those most affected by the pandemic-era lockdowns. Those include travel, hospitality, manufacturing and education. The labour imbalance also has significant implications for the Fed and BoC’s rate-hiking path, given the central banks’ desire to cool down the red-hot job market, which adds to inflation through wage increases.
“If these shifts in the labour force persist,” Franz notes, “it would require more rate hikes than the market has priced in today — and for a longer period of time — to realign labour supply and demand.”
Over the long term, Franz believes the labour crunch will ease, especially if the U.S. and Canadian economies falls into recession over the next year or two. But that’s a painful way to solve the problem, he concedes.
“Unfortunately, it does sometimes take a significant downturn to resolve imbalances in the economy,” Franz says.
Stocks and bonds falling
Among all the major distortions in the economy and markets today, this one strikes at the heart of portfolio diversification.
Simply put, when stocks zig, bonds are supposed to zag. Yet that has yet to happen in 2022. Both major asset classes are coming under pressure as high inflation and rising interest rates hurt growth-oriented stocks as well as many types of corporate and government bonds.
As of August 31, the S&P 500 Index has lost about 16% on a year-to-date basis, while the Bloomberg U.S. Bond Aggregate Index, which represents the U.S. investment-grade (rated BBB/Baa and above) bond market, has declined more than 11%. On a total return basis, that hasn’t happened in more than 45 years — a period that includes the 1994 bond market meltdown, the early 2000s dot-com implosion and the 2007–09 global financial crisis.
U.S. stocks and bonds rarely decline in tandem
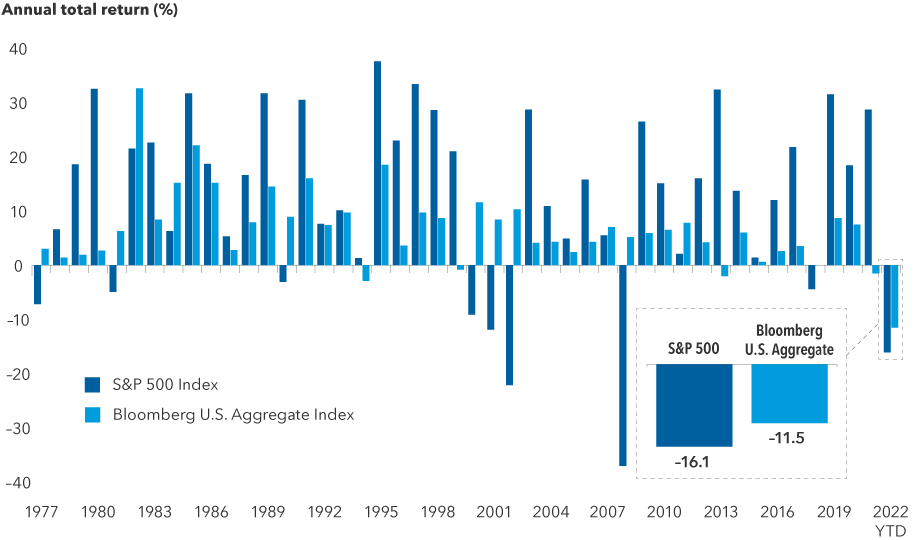
Sources: Capital Group, Bloomberg Index Services Ltd., Standard & Poor's. Returns above reflect annual total returns for all years except 2022, which reflects the year-to-date total return for both indices. As of August 31, 2022. Returns are in USD.
The entire relationship hinges on inflation.
If the Fed can get consumer prices under control, the historically negative correlation between stocks and bonds should return, explains fixed income portfolio manager Pramod Atluri.
“That is the trillion-dollar question,” Atluri says. “Are we in a new higher inflation regime or not? I don’t think we are. In my view, we are likely to see inflation come down as the Fed and other central banks continue to raise interest rates and reduce their balance sheets.”
This painful experience, however, could have a long-term impact on the markets by affecting the willingness of governments and central banks to intervene during future times of crisis, Atluri adds.
“In my view, there will be less monetary and fiscal support over the next decade as policymakers assess what went wrong,” he adds. “That would be a big shift from what we’ve experienced over the past decade, which was largely defined by government intervention. Less intervention will likely result in more volatile markets than investors have been accustomed to.”
Silver-lining distortions
Not all COVID distortions necessarily carry a negative connotation. In the equity markets, post-pandemic opportunities are emerging in a number of areas, says portfolio manager Nick Grace.
Those areas include what Grace likes to call “structural changes,” including the transition from traditional energy sources to more sustainable sources; years of underinvestment in commodities, which could lead to a new commodities super cycle; and big industrial shifts, such as the increasing adoption of automation, resulting in greater demand for semiconductors.
He is also watching certain badly bruised tech and consumer-tech companies, including some of the darlings of the COVID lockdowns that have since sharply sold off. The remarkable pull-forward in demand that we saw during the lockdowns has proven to be a fleeting moment in time, rather than a new paradigm, and share prices are starting to reflect that reality.
“A lot of the price distortions we saw in 2020 and 2021 are being unwound,” Grace says, “which doesn’t mean they can’t fall further. But there’s already been a great deal of price destruction, and I think a lot of the excesses have been wrung out of the market.”
Over the next few years, Grace stresses, this is where traditional stock-picking skills will make all the difference.
“Many of these companies won’t survive,” he explains, “but a handful will come out of this downturn stronger and more profitable. It’s our job to identify them through fundamental bottom-up research, and I feel confident about our ability to do it.”
S&P 500 Index is a market capitalization-weighted index based on the results of approximately 500 widely held common stocks.
The Bloomberg U.S. Aggregate Bond Index represents the U.S. investment-grade fixed-rate bond market.
Our latest insights
-
-
Currencies
-
Market Volatility
-
Market Volatility
-
Markets & Economy
RELATED INSIGHTS
-
Market Volatility
-
Market Volatility
-
Commissions, trailing commissions, management fees and expenses all may be associated with investments in investment funds. Please read the prospectus before investing. Investment funds are not guaranteed or covered by the Canada Deposit Insurance Corporation or by any other government deposit insurer. For investment funds other than money market funds, their values change frequently. For money market funds, there can be no assurances that the fund will be able to maintain its net asset value per security at a constant amount or that the full amount of your investment in the fund will be returned to you. Past performance may not be repeated.
Unless otherwise indicated, the investment professionals featured do not manage Capital Group‘s Canadian investment funds.
References to particular companies or securities, if any, are included for informational or illustrative purposes only and should not be considered as an endorsement by Capital Group. Views expressed regarding a particular company, security, industry or market sector should not be considered an indication of trading intent of any investment funds or current holdings of any investment funds. These views should not be considered as investment advice nor should they be considered a recommendation to buy or sell.
Statements attributed to an individual represent the opinions of that individual as of the date published and do not necessarily reflect the opinions of Capital Group or its affiliates. This information is intended to highlight issues and not be comprehensive or to provide advice. For informational purposes only; not intended to provide tax, legal or financial advice. Capital Group funds are available in Canada through registered dealers. For more information, please consult your financial and tax advisors for your individual situation.
Forward-looking statements are not guarantees of future performance, and actual events and results could differ materially from those expressed or implied in any forward-looking statements made herein. We encourage you to consider these and other factors carefully before making any investment decisions and we urge you to avoid placing undue reliance on forward-looking statements.
The S&P 500 Composite Index (“Index”) is a product of S&P Dow Jones Indices LLC and/or its affiliates and has been licensed for use by Capital Group. Copyright © 2025 S&P Dow Jones Indices LLC, a division of S&P Global, and/or its affiliates. All rights reserved. Redistribution or reproduction in whole or in part are prohibited without written permission of S&P Dow Jones Indices LLC.
FTSE source: London Stock Exchange Group plc and its group undertakings (collectively, the "LSE Group"). © LSE Group 2025. FTSE Russell is a trading name of certain of the LSE Group companies. "FTSE®" is a trade mark of the relevant LSE Group companies and is used by any other LSE Group company under licence. All rights in the FTSE Russell indices or data vest in the relevant LSE Group company which owns the index or the data. Neither LSE Group nor its licensors accept any liability for any errors or omissions in the indices or data and no party may rely on any indices or data contained in this communication. No further distribution of data from the LSE Group is permitted without the relevant LSE Group company's express written consent. The LSE Group does not promote, sponsor or endorse the content of this communication. The index is unmanaged and cannot be invested in directly.
BLOOMBERG® is a trademark and service mark of Bloomberg Finance L.P. and its affiliates (collectively “Bloomberg”). Bloomberg or Bloomberg’s licensors own all proprietary rights in the Bloomberg Indices. Neither Bloomberg nor Bloomberg’s licensors approves or endorses this material, or guarantees the accuracy or completeness of any information herein, or makes any warranty, express or implied, as to the results to be obtained therefrom and, to the maximum extent allowed by law, neither shall have any liability or responsibility for injury or damages arising in connection therewith.
MSCI does not approve, review or produce reports published on this site, makes no express or implied warranties or representations and is not liable whatsoever for any data represented. You may not redistribute MSCI data or use it as a basis for other indices or investment products.
Capital believes the software and information from FactSet to be reliable. However, Capital cannot be responsible for inaccuracies, incomplete information or updating of the information furnished by FactSet. The information provided in this report is meant to give you an approximate account of the fund/manager's characteristics for the specified date. This information is not indicative of future Capital investment decisions and is not used as part of our investment decision-making process.
Indices are unmanaged and cannot be invested in directly. Returns represent past performance, are not a guarantee of future performance, and are not indicative of any specific investment.
All Capital Group trademarks are owned by The Capital Group Companies, Inc. or an affiliated company in Canada, the U.S. and other countries. All other company names mentioned are the property of their respective companies.
Capital Group funds are offered in Canada by Capital International Asset Management (Canada), Inc., part of Capital Group, a global investment management firm originating in Los Angeles, California in 1931. Capital Group manages equity assets through three investment groups. These groups make investment and proxy voting decisions independently. Fixed income investment professionals provide fixed income research and investment management across the Capital organization; however, for securities with equity characteristics, they act solely on behalf of one of the three equity investment groups.
The Capital Group funds offered on this website are available only to Canadian residents.