Capital Group Funds (Canada)
- Summary
- Global Solutions Committee
- Distributions
Investment Objective
Seeks to generate income, along with conservation of capital and long-term growth of capital. The fund invests primarily in equity and debt securities issued by companies and governments around the world, primarily through investments in underlying funds.
Fund Description
A focus on monthly income
A managed portfolio of funds that invest in a flexible mix of fixed-income, dividend-paying equities and growth-oriented equities on a global basis.
A managed portfolio of funds that invest in a flexible mix of fixed-income, dividend-paying equities and growth-oriented equities on a global basis.
Fee update
Effective July 1, 2026, this fund’s management fee will be reduced. The MER shown does not reflect this change yet. MERs, which include management fees, will fully reflect the reduction in June 2027.
Returns
Growth of $10,000 since inception (Series F)
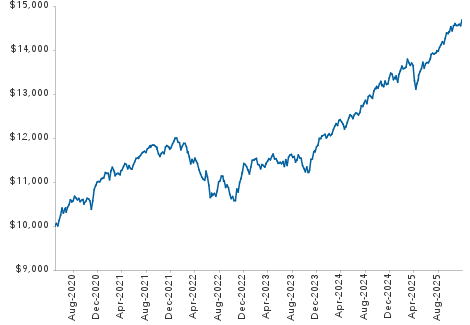
Returns include reinvestment of all distributions and do not reflect the effect of a sales charge. Past returns are not predictive of future returns.
| Returns (%) | Series F | Series F4 | |
| 1 month | 1.69 | 1.69 | |
| YTD | 5.65 | 5.65 | |
| 1 year* | 10.53 | 10.52 | |
| 3 years* | 10.15 | 10.15 | |
| 5 years* | 5.81 | 5.81 | |
| Lifetime* | 7.17 | 7.17 | |
| Lifetime (cumulative) | 53.30 | 53.28 | |
| 2025 | 9.07 | 9.06 | |
| 2024 | 10.83 | 10.83 |
*Annualized compound returns.
Portfolio information
| Fund assets ($mil) combined series | $94.2 | |
| Dividend yield (equity)1 | 2.63% | |
| Yield to worst (bonds)2 | 5.73% | |
| Effective duration (years)3 | 6.4 | |
| Portfolio turnover (2025) | 26% | |
| Trading expense ratio4 | 0.05% | |
Sector diversification
| Equity | 30.0% |
| Financials | 6.2% |
| Information Technology | 5.5% |
| Industrials | 3.4% |
| Consumer Staples | 2.7% |
| Health Care | 2.3% |
| Consumer Discretionary | 2.2% |
| Energy | 2.2% |
| Materials | 1.8% |
| Utilities | 1.7% |
| Communication Services | 1.5% |
| Real Estate | 0.5% |
| Bonds | 62.9% |
| Corporate | 28.8% |
| Government | 28.3% |
| Securitized5 | 5.8% |
| Cash and cash equivalents & other assets less liabilities |
7.1% |
Portfolio characteristics
| Series F | Series F4 | |
| FundSERV | CIF 520 | CIF 8520 |
| MER6 | 0.79% | 0.80% |
| Fund inception | Apr 30, 2020 | Apr 30, 2020 |
| Minimum initial investment | $500 | $5,000 |
| Income distributions paid | Monthly | December |
| Return of capital paid7 | — | Monthly |
| Capital gains paid | December | December |
| 12-month distribution rate8 | 3.1% | — |
| Trade settlement | T+19 | T+19 |
Global Solutions Committee
| Years with Capital / Years in profession | |
| Patricio Ciarfaglia | 17 / 24 |
| Luis Freitas De Oliveira | 32 / 37 |
| Samir Mathur | 13 / 33 |
| Raj Paramaguru | 13 / 21 |
| Wesley Phoa | 27 / 33 |
| Steve Watson | 36 / 38 |
Top equity holdings
| % of Portfolio | |
| TSMC | 1.9 |
| Broadcom | 1.0 |
| Philip Morris International | 1.0 |
| Canadian Natural Resources | 0.5 |
| SK hynix | 0.5 |
| British American Tobacco | 0.4 |
| AbbVie | 0.4 |
| BAE Systems | 0.4 |
| Toronto-Dominion Bank | 0.3 |
| Restaurant Brands International | 0.3 |
| Total top equity holdings | 6.7 |
Quarterly holdings (XLSX)
Top fixed-income issuers
| % of Portfolio | Yield % | |
| U.S. Treasury | 4.1 | 4.6 |
| Mexico (United Mexican States) (Government) | 1.8 | 6.7 |
| Province of Ontario | 1.5 | 4.1 |
| Canada Housing Trust No.1 | 1.3 | 3.0 |
| Brazil, Federal Government of | 1.3 | 13.9 |
| Japan, Government of | 1.2 | 3.4 |
| Colombia, Republic of | 1.1 | 8.7 |
| Canada, Government of | 1.0 | 3.7 |
| Fannie Mae | 0.9 | 4.9 |
| Quebec, Province of | 0.8 | 4.1 |
| Total top fixed-income issuers | 15.0 | |
Bond quality summary
| % of Bonds | |
| AAA/Aaa | 7.2 |
| AA/Aa | 21.7 |
| A | 16.4 |
| BBB/Baa | 21.6 |
| BB/Ba | 18.1 |
| B | 10.5 |
| CCC/Caa & below | 3.3 |
| Unrated | 1.2 |
| Investment grade | 66.9 |
| Below investment grade | 31.9 |
Geographic diversification
| Equity | Bonds | Portfolio | ||
| United States | 11.8% | 28.4% | 40.2% | |
| Emerging Markets | 5.6% | 14.3% | 19.9% | |
| Canada | 4.7% | 11.0% | 15.7% | |
| Europe ex-UK | 3.8% | 3.4% | 7.2% | |
| United Kingdom | 2.1% | 1.2% | 3.3% | |
| Other | 0.2% | 2.7% | 2.9% | |
| Japan | 1.0% | 1.4% | 2.4% | |
| Pacific Basin ex-Japan | 0.8% | 0.5% | 1.3% | |
| Cash and cash equivalents & other assets less liabilities |
7.1% | |||
| Cash and cash equivalents includes short-term investments. | |
| 1 | Reflects dividend yield for the equity portion of the portfolio. Income generated by portfolio securities, before expenses; does not reflect unitholder distributions. |
| 2 | Yield to worst reflects the lowest yield that can be realized by either calling or putting on one of the available call/put dates, or holding a bond to maturity. |
| 3 | Includes the impact of callable bonds. Duration is a measure of the approximate sensitivity of a bond portfolio's value to interest rate changes. |
| 4 | As of December 31, 2025. |
| 5 | Includes asset-backed securities, commercial mortgage-backed securities, covered, and mortgage-backed securities. |
| 6 |
Capital Group, at its discretion, currently waives some of its management fees or absorbs some expenses of certain Capital Group funds. Such waivers and absorptions may be terminated at any time, but can be expected to continue for certain portfolios until such time as such funds are of sufficient size to reasonably absorb all management fees and expenses incurred in their operations.
The management expense ratios for the portfolios are based on audited total expenses for the 12-month period ended December 31, 2025, and are expressed as an annualized percentage of daily average net assets during the period. Actual MERs may vary. For the 12-month period ended December 31, 2025, the total net asset values of the series were of sufficient size to reasonably absorb all management fees and expenses incurred in the operations of the funds attributable to the series, and therefore there were no waivers or absorptions during this period.
|
| 7 | Payable on Series T4 and F4 only. |
| 8 | Reflects the sum of income distributions over the trailing 12 months, divided by the sum of the previous month's ending NAV plus any capital gains distributed over the 12-month period. |
| 9 | Prior to May 27, 2024, the trade settlement cycle for Capital Group Funds (Canada) was trade date (T) + 2. |
| Not available to U.S. residents. | |
| Updated on a monthly basis. | |
| Totals may not reconcile due to rounding. | |
| Commissions, trailing commissions, management fees and expenses all may be associated with investments in investment funds. Please read the prospectus before investing. The indicated rates of return are the historical annual compounded total returns including changes in unit value and reinvestment of all distributions and do not take into account sales, redemption, distribution or optional charges or income taxes payable by any unitholder that would have reduced returns. Investment funds are not guaranteed or covered by the Canada Deposit Insurance Corporation or by any other government deposit insurer. For investment funds other than money market funds, their values change frequently. For money market funds, there can be no assurances that the fund will be able to maintain its net asset value per security at a constant amount or that the full amount of your investment in the fund will be returned to you. Past performance may not be repeated. | |

Patricio Ciarfaglia
Years at Capital: 17
Years in profession: 24
Based in London
Patricio Ciarfaglia is a portfolio manager at Capital Group. As an equity investment analyst he covers global insurers, excluding North America. Earlier in his career at Capital, he covered European hotels. Prior to joining Capital, he worked at Merrill Lynch in Argentina. He holds an MBA from Harvard Business School and a bachelor’s degree with honours in accounting from the Universidad Cat�lica Argentina. He also holds the Chartered Financial Analyst� designation.

Luis Freitas De Oliveira
Years at Capital: 32
Years in profession: 37
Based in Geneva
Luis Freitas de Oliveira is a portfolio manager at Capital Group. He is chair of Capital International S�rl. Earlier in his career, as an equity investment analyst at Capital, Luis covered financial institutions in emerging markets. Before joining Capital, he was a corporate banker for Citibank N.A. in Brazil. He holds a master's degree in business administration from INSEAD, France, and a bachelor's degree in economics from the Federal University of Minas Gerais, Brazil.

Samir Mathur
Years at Capital: 13
Years in profession: 33
Based in New York
Samir Mathur is a solutions portfolio manager at Capital Group. His focus is on fund-of-funds and multi-asset solutions. Samir serves on the Global Solutions Committee, Portfolio Solutions Committee and Target Date Solutions Committee. During his tenure at Capital, Samir has led the development of fund-of-funds solutions and several model portfolios, including tax-aware portfolio models, portfolio sleeves and model portfolios for our insurance series of funds. Prior to joining Capital, Samir was a managing director for the multi-asset trading and solutions group at Citigroup. Before that, he worked at Hewlett-Packard. He holds an MBA from University of California, Berkeley, a master’s degree in computer science from University of Southern California and a bachelor’s of technology degree from the Indian Institute of Technology, Delhi.

Raj Paramaguru
Years at Capital: 13
Years in profession: 21
Based in Los Angeles
Raj Paramaguru is a research director at Capital Group. Raj serves on the Custom Solutions Committee. Prior to his time in the investment industry, Raj spent eight years building computer simulation models that were used by leading aerospace companies and NASA for analyzing aerodynamic surfaces. At Capital, Raj has been involved in the development of several fund-of-funds solutions and has led research on our target date retirement series and retirement income portfolio series and risk analysis on our equity funds. Prior to joining Capital, Raj founded and managed a quantitative hedge fund in New York, and before that he was at Barclays Capital managing quantitative strategies for institutional clients. Prior to Barclays, Raj held several positions including derivatives trading at Lehman Brothers. He holds an MBA with honors from the University of Chicago’s Booth School of Business, a master’s degree in industrial engineering from the University of Cincinnati and a bachelor’s degree in mechanical engineering from Anna University, India. He also holds the Chartered Financial Analyst� designation.

Wesley Phoa
Years at Capital: 27
Years in profession: 33
Based in Los Angeles
Wesley K. Phoa is a solutions portfolio manager at Capital Group. His focus is on fund-of-funds and multi-asset solutions. Wesley serves on the Global Solutions Committee, Portfolio Solutions Committee and Target Date Solutions Committee. Earlier in his career at Capital, Wesley served as a fixed income portfolio manager with a focus on rates-driven and long duration strategies. His areas of research responsibility included interest rates, monetary policy and financial economics. He has also been involved in the development of several fund-of-funds strategies and custom solutions for institutional clients. Prior to joining Capital, he was director of research with Capital Management Sciences and a quantitative analyst with Deutsche Bank in Australia. He holds a PhD in pure mathematics from Trinity College at the University of Cambridge and a bachelor’s degree with honours from the Australian National University. He is an elected member of the Conference of Business Economists and the International Conference of Commercial Bank Economists. He sits on the editorial board of The Journal of Portfolio Management.

Steve Watson
Years at Capital: 36
Years in profession: 38
Based in Hong Kong
Steven T. Watson is an equity portfolio manager at Capital Group. Earlier in his career, as an equity investment analyst at Capital, he covered Asian property and transportation, as well as European transportation and utilities companies. Before joining Capital, Steve was a buy-side research analyst for Sanford C. Bernstein & Co. in New York. He holds an MBA in finance from New York University Graduate School of Business Administration, a master's degree in French studies from New York University Institute of French Studies and a bachelor's degree in French from the University of Massachusetts graduating cum laude. He also studied Mandarin Chinese at Wuhan University and the Shanghai Foreign Language Institute in China.
| Capital Group funds and Capital International Asset Management (Canada), Inc., are part of Capital Group, a global investment management firm originating in Los Angeles, California in 1931. Capital Group manages equity assets through three investment groups. These groups make investment and proxy voting decisions independently. Fixed-income investment professionals provide fixed-income research and investment management across the Capital organization; however, for securities with equity characteristics, they act solely on behalf of one of the three equity investment groups. |
| Commissions, trailing commissions, management fees and expenses all may be associated with investments in investment funds. Please read the prospectus before investing. Investment funds are not guaranteed or covered by the Canada Deposit Insurance Corporation or by any other government deposit insurer. For investment funds other than money market funds, their values change frequently. For money market funds, there can be no assurances that the fund will be able to maintain its net asset value per security at a constant amount or that the full amount of your investment in the fund will be returned to you. Past performance may not be repeated. |
Distributions
|
Historical Prices & Distributions
Select Dates
From:
To:
| Commissions, trailing commissions, management fees and expenses all may be associated with investments in investment funds. Please read the prospectus before investing. Investment funds are not guaranteed or covered by the Canada Deposit Insurance Corporation or by any other government deposit insurer. For investment funds other than money market funds, their values change frequently. For money market funds, there can be no assurances that the fund will be able to maintain its net asset value per security at a constant amount or that the full amount of your investment in the fund will be returned to you. Past performance may not be repeated. |