Capital Group Funds (Canada)
- Summary
- Portfolio managers
- Distributions
Investment Objective
Seeks long-term growth and preservation of capital by investing primarily in a broad range of equity and debt securities of emerging markets issuers. The fund seeks to achieve this objective with lower volatility of returns than emerging markets equities.
Fund Description
A lower volatility approach to emerging markets
Invests in stocks and bonds with a well-defined process for managing volatility.
Invests in stocks and bonds with a well-defined process for managing volatility.
The monthly distribution series can help provide investors with a sustainable cash flow, tax efficiency and growth potential.

Returns
Growth of $10,000 since inception (Series F)
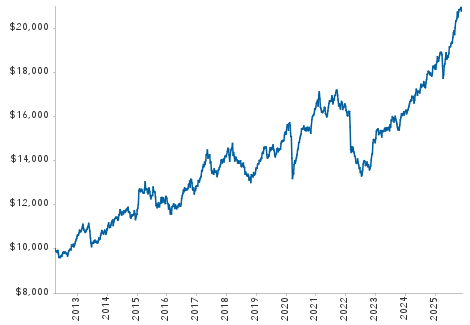
Returns include reinvestment of all distributions and do not reflect the effect of a sales charge. Past returns are not predictive of future returns.
| Returns (%) | Series F | Series F4 | |
| 1 month | 2.97 | 2.97 | |
| YTD | 7.54 | 7.53 | |
| 1 year* | 16.81 | 16.79 | |
| 3 years* | 12.56 | 12.54 | |
| 5 years* | 5.78 | 5.77 | |
| 10 years* | 6.14 | — | |
| Lifetime* | 5.78 | 5.82 | |
| Lifetime (cumulative) | 122.79 | 65.55 | |
| 2025 | 14.10 | 14.08 | |
| 2024 | 12.07 | 12.06 | |
| 2023 | 9.38 | 9.37 | |
| 2022 | -9.98 | -9.99 | |
| 2021 | 0.29 | 0.33 |
*Annualized compound returns.
Portfolio information
| Fund assets ($mil) combined series | $168.4 | |
| Dividend yield (equity)1 | 2.00% | |
| Yield to worst (bonds)2 | 7.67% | |
| Companies / issuers | 230 | |
| Portfolio turnover (2025) | 48% | |
| Trading expense ratio3 | 0.09% | |
Sector diversification
| Equity | 38.1% |
| Information Technology | 9.8% |
| Financials | 8.7% |
| Communication Services | 4.0% |
| Consumer Staples | 3.7% |
| Consumer Discretionary | 3.3% |
| Industrials | 2.8% |
| Materials | 2.4% |
| Health Care | 1.6% |
| Energy | 1.3% |
| Real Estate | 0.4% |
| Utilities | 0.1% |
| Bonds | 52.8% |
| Hard currency government4 | 19.4% |
| Corporate | 15.4% |
| Local currency government | 15.3% |
| Inflation-linked | 2.7% |
| Cash and cash equivalents & other assets less liabilities |
9.1% |
Portfolio characteristics
| Series F | Series F4 | |
| FundSERV | CIF 822 | CIF 8822 |
| MER5 | 0.92% | 0.94% |
| Fund inception | Mar 30, 2012 | Jul 31, 2017 |
| Minimum initial investment | $500 | $5,000 |
| Income distributions paid | Mar, Jun, Sep, Dec | December |
| Return of capital paid6 | — | Monthly |
| Capital gains paid | December | December |
| 12-month distribution rate7 | 3.7% | — |
| Trade settlement | T+18 | T+18 |
Portfolio managers
| Years with Capital / Years in profession | |
| Arthur Caye | 21 / 29 |
| Patricio Ciarfaglia | 17 / 24 |
| Luis Freitas De Oliveira | 32 / 37 |
| Holger Siebrecht | 10 / 18 |
Top equity holdings
| % of Portfolio | |
| TSMC | 4.0 |
| SK hynix | 1.8 |
| ASML | 1.7 |
| Tencent | 1.6 |
| NetEase | 1.3 |
| Danone | 0.9 |
| AIA Group | 0.9 |
| MediaTek | 0.8 |
| Halyk Bank | 0.8 |
| Royal Gold | 0.8 |
| Total top equity holdings | 14.6 |
Quarterly holdings (XLSX)
Top fixed-income issuers
| % of Portfolio | Yield % | |
| Brazil, Federal Government of | 4.5 | 14.3 |
| Colombia, Republic of | 3.5 | 8.5 |
| Mexico (United Mexican States) (Government) | 3.1 | 7.0 |
| Pemex | 2.9 | 7.0 |
| U.S. Treasury | 2.9 | 4.8 |
| South Africa, Republic of | 2.8 | 7.3 |
| Peru, Republic of | 1.4 | 5.1 |
| Dominican Republic | 1.3 | 4.9 |
| Romania (Republic of) | 1.2 | 5.1 |
| Poland, Republic of | 1.1 | 4.9 |
| Total top fixed-income issuers | 24.7 | |
Bond quality summary
| % of Bonds | |
| AAA/Aaa | 0.5 |
| AA/Aa | 10.3 |
| A | 9.6 |
| BBB/Baa | 29.1 |
| BB/Ba | 35.3 |
| B | 10.7 |
| CCC/Caa & below | 4.1 |
| Unrated | 0.5 |
Geographic diversification
| Equity | Bonds | Portfolio | ||
| Asia | 19.3% | 8.6% | 27.9% | |
| Latin America | 1.5% | 21.2% | 22.7% | |
| Europe | 7.8% | 8.3% | 16.1% | |
| Africa | 1.9% | 7.1% | 9.0% | |
| North America | 3.0% | 3.5% | 6.5% | |
| Middle East | 1.4% | 3.6% | 5.0% | |
| Pacific Basin | 3.2% | 0.3% | 3.5% | |
| Other | 0.0% | 0.2% | 0.2% | |
| Cash and cash equivalents & other assets less liabilities |
9.1% | |||
| 1 | Reflects dividend yield for the equity portion of the portfolio. Income generated by portfolio securities, before expenses; does not reflect unitholder distributions. |
| 2 | Yield to worst reflects the lowest yield that can be realized by either calling or putting on one of the available call/put dates, or holding a bond to maturity. |
| 3 | As of December 31, 2025. |
| 4 | Hard currency government bonds may include government bonds denominated in multiple currencies. Additional currency denomination information is available in the fund's financial statements. |
| 5 |
Capital Group, at its discretion, currently waives some of its management fees or absorbs some expenses of certain Capital Group funds. Such waivers and absorptions may be terminated at any time, but can be expected to continue for certain portfolios until such time as such funds are of sufficient size to reasonably absorb all management fees and expenses incurred in their operations.
The management expense ratios for the portfolios are based on audited total expenses for the 12-month period ended December 31, 2025, and are expressed as an annualized percentage of daily average net assets during the period. Actual MERs may vary. For the 12-month period ended December 31, 2025, the total net asset values of the series were of sufficient size to reasonably absorb all management fees and expenses incurred in the operations of the funds attributable to the series, and therefore there were no waivers or absorptions during this period.
|
| 6 | Payable on Series T4 and F4 only. |
| 7 | Reflects the sum of income distributions over the trailing 12 months, divided by the sum of the previous month's ending NAV plus any capital gains distributed over the 12-month period. |
| 8 | Prior to May 27, 2024, the trade settlement cycle for Capital Group Funds (Canada) was trade date (T) + 2. |
| Not available to U.S. residents. | |
| Updated on a monthly basis. | |
| Totals may not reconcile due to rounding. | |
| Commissions, trailing commissions, management fees and expenses all may be associated with investments in investment funds. Please read the prospectus before investing. The indicated rates of return are the historical annual compounded total returns including changes in unit value and reinvestment of all distributions and do not take into account sales, redemption, distribution or optional charges or income taxes payable by any unitholder that would have reduced returns. Investment funds are not guaranteed or covered by the Canada Deposit Insurance Corporation or by any other government deposit insurer. For investment funds other than money market funds, their values change frequently. For money market funds, there can be no assurances that the fund will be able to maintain its net asset value per security at a constant amount or that the full amount of your investment in the fund will be returned to you. Past performance may not be repeated. | |

Arthur Caye
Years at Capital: 21
Years in profession: 29
Based in Geneva
Arthur Caye is a portfolio manager at Capital Group. As an equity investment analyst he covers banks in Latin America, the Middle East, Eastern Europe and Africa. He rejoined Capital after resuming an earlier role as a European analyst. Prior to rejoining Capital, Arthur was a managing partner at Lombard Odier, a privately owned Swiss bank. Before his career at Capital, he was an equity analyst at Cazenove and a project finance officer at BNP Paribas. He holds an MBA from Stanford Graduate School of Business, a master’s degree in computer science from �cole Centrale Paris and an engineering diploma from �cole Polytechnique F�d�rale de Lausanne.

Patricio Ciarfaglia
Years at Capital: 17
Years in profession: 24
Based in London
Patricio Ciarfaglia is a portfolio manager at Capital Group. As an equity investment analyst he covers global insurers, excluding North America. Earlier in his career at Capital, he covered European hotels. Prior to joining Capital, he worked at Merrill Lynch in Argentina. He holds an MBA from Harvard Business School and a bachelor’s degree with honours in accounting from the Universidad Cat�lica Argentina. He also holds the Chartered Financial Analyst� designation.

Luis Freitas De Oliveira
Years at Capital: 32
Years in profession: 37
Based in Geneva
Luis Freitas de Oliveira is a portfolio manager at Capital Group. He is chair of Capital International S�rl. Earlier in his career, as an equity investment analyst at Capital, Luis covered financial institutions in emerging markets. Before joining Capital, he was a corporate banker for Citibank N.A. in Brazil. He holds a master's degree in business administration from INSEAD, France, and a bachelor's degree in economics from the Federal University of Minas Gerais, Brazil.
Holger Siebrecht
Years at Capital: 10
Years in profession: 18
Based in London
Holger Siebrecht is a fixed income portfolio manager at Capital Group. As a fixed income investment analyst, he has research responsibility for Africa, excluding Egypt, and Sri Lanka. Prior to joining Capital, Holger worked as an assistant portfolio manager at Acadian Asset Management. Before that, he was an analyst at Macquarie Capital Investment Management. He holds a master's degree in international development economics from Harvard University and a bachelor's degree in economics from Duke University. He also holds the Chartered Financial Analyst® designation.
| Capital Group funds and Capital International Asset Management (Canada), Inc., are part of Capital Group, a global investment management firm originating in Los Angeles, California in 1931. Capital Group manages equity assets through three investment groups. These groups make investment and proxy voting decisions independently. Fixed-income investment professionals provide fixed-income research and investment management across the Capital organization; however, for securities with equity characteristics, they act solely on behalf of one of the three equity investment groups. |
| Commissions, trailing commissions, management fees and expenses all may be associated with investments in investment funds. Please read the prospectus before investing. Investment funds are not guaranteed or covered by the Canada Deposit Insurance Corporation or by any other government deposit insurer. For investment funds other than money market funds, their values change frequently. For money market funds, there can be no assurances that the fund will be able to maintain its net asset value per security at a constant amount or that the full amount of your investment in the fund will be returned to you. Past performance may not be repeated. |
Distributions
|
Historical Prices & Distributions
Select Dates
From:
To:
| Commissions, trailing commissions, management fees and expenses all may be associated with investments in investment funds. Please read the prospectus before investing. Investment funds are not guaranteed or covered by the Canada Deposit Insurance Corporation or by any other government deposit insurer. For investment funds other than money market funds, their values change frequently. For money market funds, there can be no assurances that the fund will be able to maintain its net asset value per security at a constant amount or that the full amount of your investment in the fund will be returned to you. Past performance may not be repeated. |