Capital Group Funds (Canada)
- Summary
- Portfolio managers
- Distributions
Investment Objective
Seeks the balanced accomplishment of three objectives: Long term growth of capital, conservation of principal, and current income through investments primarily in equity and debt securities issued by companies and governments around the world.
Fund Description
A truly global multi-asset portfolio
Emphasis on dividend-paying stocks and investment grade bonds from around the world.
Emphasis on dividend-paying stocks and investment grade bonds from around the world.
Fee update
Effective July 1, 2026, this fund’s management fee will be reduced. The MER shown does not reflect this change yet. MERs, which include management fees, will fully reflect the reduction in June 2027.
Returns
Growth of $10,000 since inception (Series F)
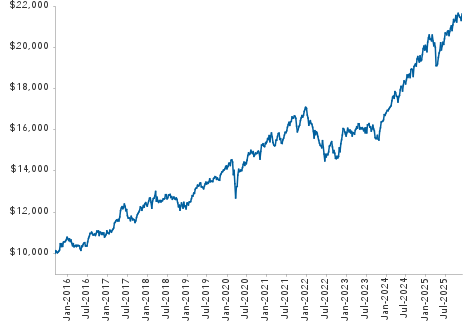
Returns include reinvestment of all distributions and do not reflect the effect of a sales charge. Past returns are not predictive of future returns.
| Returns (%) | Series F | Series F4 | |
| 1 month | 2.66 | 2.66 | |
| YTD | 8.75 | 8.75 | |
| 1 year* | 12.13 | 12.14 | |
| 3 years* | 12.90 | 12.90 | |
| 5 years* | 7.73 | 7.74 | |
| Lifetime* | 7.98 | 7.99 | |
| Lifetime (cumulative) | 129.67 | 129.82 | |
| 2025 | 7.06 | 7.06 | |
| 2024 | 18.46 | 18.47 | |
| 2023 | 7.01 | 7.01 | |
| 2022 | -7.88 | -7.87 | |
| 2021 | 10.55 | 10.55 |
*Annualized compound returns.
Portfolio information
| Fund assets ($mil) combined series | $2,199.7 | |
| Dividend yield (equity)1 | 2.20% | |
| Yield to worst (bonds)2 | 4.37% | |
| Companies / issuers | 296 | |
| Income distributions paid | December | |
| Capital gains paid | December | |
| Return of capital paid3 | Monthly | |
| Portfolio turnover (2025) | 72% | |
| Trading expense ratio4 | 0.04% | |
Sector diversification
| Equity | 63.8% |
| Information Technology | 12.3% |
| Financials | 11.4% |
| Industrials | 9.8% |
| Consumer Discretionary | 6.5% |
| Health Care | 5.8% |
| Consumer Staples | 5.5% |
| Energy | 3.4% |
| Utilities | 3.3% |
| Communication Services | 3.2% |
| Materials | 2.6% |
| Real Estate | 0.0% |
| Bonds | 31.5% |
| Hard currency government5 | 15.2% |
| Corporate | 7.6% |
| Mortgage backed | 3.9% |
| Local currency government | 3.4% |
| Asset backed | 0.7% |
| Inflation-linked | 0.7% |
| Cash and cash equivalents & other assets less liabilities |
4.7% |
Portfolio characteristics
| Series F | Series F4 | |
| FundSERV | CIF 820 | CIF 8820 |
| MER6 | 0.77% | 0.77% |
| Fund inception | Aug 31, 2015 | Aug 31, 2015 |
| Minimum initial investment | $500 | $5,000 |
| 12-month distribution rate7 | 1.9% | — |
| Trade settlement | T+18 | T+18 |
Portfolio managers
| Years with Capital / Years in profession | |
| Hilda Applbaum | 31 / 42 |
| Philip Chitty | 22 / 31 |
| Anirudh Samsi | 21 / 25 |
| Tomonori Tani | 21 / 27 |
Top equity holdings
| % of Portfolio | |
| TSMC | 5.2 |
| Philip Morris International | 3.2 |
| Alphabet | 2.5 |
| BAE Systems | 2.4 |
| Broadcom | 2.2 |
| KLA | 2.1 |
| UnitedHealth Group | 1.6 |
| JPMorgan Chase | 1.6 |
| BAWAG Group | 1.6 |
| Starbucks | 1.5 |
| Total top equity holdings | 23.9 |
Quarterly holdings (XLSX)
Top fixed-income issuers
| % of Portfolio | Yield % | |
| U.S. Treasury | 8.0 | 4.4 |
| Japan, Government of | 2.3 | 2.8 |
| Germany, Federal Republic of | 1.8 | 2.7 |
| UK Government | 1.0 | 4.9 |
| UMBS | 1.0 | 5.2 |
| Fannie Mae | 0.9 | 4.8 |
| Federal Home Loan Mortgage | 0.8 | 5.1 |
| France, Republic of | 0.6 | 3.1 |
| Peru, Republic of | 0.6 | 6.8 |
| Brazil, Federal Government of | 0.6 | 14.3 |
| Total top fixed-income issuers | 17.6 | |
Bond quality summary
| % of Bonds | |
| AAA/Aaa | 11.4 |
| AA/Aa | 42.3 |
| A | 19.2 |
| BBB/Baa | 18.0 |
| BB/Ba | 6.1 |
| B | 1.3 |
| CCC/Caa & below | 0.3 |
| Unrated | 1.4 |
| Investment grade | 90.9 |
| Below investment grade | 7.7 |
Geographic diversification
| Equity | Bonds | Portfolio | ||
| United States | 35.7% | 15.7% | 51.4% | |
| Emerging Markets | 7.6% | 4.5% | 12.1% | |
| Europe ex-UK | 6.0% | 5.5% | 11.5% | |
| United Kingdom | 6.0% | 1.7% | 7.7% | |
| Japan | 3.2% | 2.3% | 5.5% | |
| Canada | 4.2% | 0.3% | 4.5% | |
| Pacific Basin ex-Japan | 1.1% | 0.6% | 1.7% | |
| Other | 0.0% | 0.9% | 0.9% | |
| Cash and cash equivalents & other assets less liabilities |
4.7% | |||
| 1 | Reflects dividend yield for the equity portion of the portfolio. Income generated by portfolio securities, before expenses; does not reflect unitholder distributions. |
| 2 | Yield to worst reflects the lowest yield that can be realized by either calling or putting on one of the available call/put dates, or holding a bond to maturity. |
| 3 | Payable on Series T4 and F4 only. |
| 4 | As of December 31, 2025. |
| 5 | Hard currency government bonds may include government bonds denominated in multiple currencies. Additional currency denomination information is available in the fund's financial statements. |
| 6 |
Capital Group, at its discretion, currently waives some of its management fees or absorbs some expenses of certain Capital Group funds. Such waivers and absorptions may be terminated at any time, but can be expected to continue for certain portfolios until such time as such funds are of sufficient size to reasonably absorb all management fees and expenses incurred in their operations.
The management expense ratios for the portfolios are based on audited total expenses for the 12-month period ended December 31, 2025, and are expressed as an annualized percentage of daily average net assets during the period. Actual MERs may vary. For the 12-month period ended December 31, 2025, the total net asset values of the series were of sufficient size to reasonably absorb all management fees and expenses incurred in the operations of the funds attributable to the series, and therefore there were no waivers or absorptions during this period.
|
| 7 | Reflects the sum of income distributions over the trailing 12 months, divided by the sum of the previous month's ending NAV plus any capital gains distributed over the 12-month period. |
| 8 | Prior to May 27, 2024, the trade settlement cycle for Capital Group Funds (Canada) was trade date (T) + 2. |
| Not available to U.S. residents. | |
| Updated on a monthly basis. | |
| Totals may not reconcile due to rounding. | |
| Commissions, trailing commissions, management fees and expenses all may be associated with investments in investment funds. Please read the prospectus before investing. The indicated rates of return are the historical annual compounded total returns including changes in unit value and reinvestment of all distributions and do not take into account sales, redemption, distribution or optional charges or income taxes payable by any unitholder that would have reduced returns. Investment funds are not guaranteed or covered by the Canada Deposit Insurance Corporation or by any other government deposit insurer. For investment funds other than money market funds, their values change frequently. For money market funds, there can be no assurances that the fund will be able to maintain its net asset value per security at a constant amount or that the full amount of your investment in the fund will be returned to you. Past performance may not be repeated. | |

Hilda Applbaum
Years at Capital: 31
Years in profession: 42
Based in San Francisco
Hilda L. Applbaum is a portfolio manager at Capital Group. Earlier in her career, as an equity investment analyst at Capital, Hilda covered global convertible securities. Before joining Capital, she was a principal investment officer and director of research for the California Public Employees Retirement System, and a research analyst and economist at Federal Farm Credit Banks Funding Corp. in New York. Hilda holds a master's degree in economics from New York University and a bachelor's degree in economics from Barnard College of Columbia University graduating magna cum laude. She also holds the Chartered Financial Analyst� designation.

Philip Chitty
Years at Capital: 22
Years in profession: 31
Based in London
Philip Chitty is a fixed income portfolio manager at Capital Group. As a fixed income investment analyst, he covers Western Europe and the U.K. He also serves on the Global Solutions Committee. Earlier in his career at Capital, Philip had macroeconomic responsibility for Europe and Japan. Prior to joining Capital, Philip was a senior European economist with ABN AMRO. Before that, he was an economist with HM Treasury. He holds a master’s degree in economics from Birkbeck College, University of London.

Anirudh Samsi
Years at Capital: 21
Years in profession: 25
Based in San Francisco
Anirudh Samsi is an equity portfolio manager at Capital Group. Earlier in his career at Capital, he was an equity investment analyst covering U.S. money centres, investment banks and global IT services, the U.S. insurance industry, as well as asset managers. Prior to joining Capital, Anirudh was an investment analyst for Franklin Templeton Investments. He holds an MBA from the Indian Institute of Management and a bachelor's degree in commerce from the University of Mumbai. He also holds the Chartered Accountant� and Chartered Financial Analyst� designations.

Tomonori Tani
Years at Capital: 21
Years in profession: 27
Based in San Francisco
Tomonori Tani is a portfolio manager at Capital Group. Earlier in his career at Capital, he was an equity investment analyst covering Asian (excluding Australia and India) banks and financials. Prior to joining Capital, he was an analyst and team leader for the Japanese financial sector with Fidelity Investments Japan and a portfolio manager of Fidelity Select Financial Service Fund. Before that, he was engaged in macroeconomic research with Merrill Lynch Investment Managers Japan and the Profit Research Center Ltd. He holds a bachelor's degree in international economics from the Faculty of Comparative Culture at Sophia University.
| Capital Group funds and Capital International Asset Management (Canada), Inc., are part of Capital Group, a global investment management firm originating in Los Angeles, California in 1931. Capital Group manages equity assets through three investment groups. These groups make investment and proxy voting decisions independently. Fixed-income investment professionals provide fixed-income research and investment management across the Capital organization; however, for securities with equity characteristics, they act solely on behalf of one of the three equity investment groups. |
| Commissions, trailing commissions, management fees and expenses all may be associated with investments in investment funds. Please read the prospectus before investing. Investment funds are not guaranteed or covered by the Canada Deposit Insurance Corporation or by any other government deposit insurer. For investment funds other than money market funds, their values change frequently. For money market funds, there can be no assurances that the fund will be able to maintain its net asset value per security at a constant amount or that the full amount of your investment in the fund will be returned to you. Past performance may not be repeated. |
Distributions
|
Historical Prices & Distributions
Select Dates
From:
To:
| Commissions, trailing commissions, management fees and expenses all may be associated with investments in investment funds. Please read the prospectus before investing. Investment funds are not guaranteed or covered by the Canada Deposit Insurance Corporation or by any other government deposit insurer. For investment funds other than money market funds, their values change frequently. For money market funds, there can be no assurances that the fund will be able to maintain its net asset value per security at a constant amount or that the full amount of your investment in the fund will be returned to you. Past performance may not be repeated. |