Market Volatility
Categories
China
My investment lessons from 40 years in China
 Steve Watson
April 7, 2022
Steve Watson was a young student when he and his wife, Barbara, first arrived in Wuhan, China, to spend the summer of 1981 studying Chinese.
“The China we encountered on that first visit would be unrecognizable to a traveler today,” recalls Watson, a portfolio manager on Capital Group Capital Income BuilderTM (Canada) and Capital Group Monthly Income PortfolioTM (Canada). “We traveled on unairconditioned trains powered by coal-fired locomotives belching smoke that burned your eyes and blackened your clothes.”
There were no private automobiles; bicycles and buses were the primary means of transportation. The city had no subway system. Telephones and air conditioners were out of reach for most people — Wuhan University had only one air-conditioned room at the time — and refrigeration was scarce. The city, a central trading hub in China, had a single bridge spanning the Yangtze River.

Steve Watson and his wife Barbara visiting the Great Wall of China in 1981
Today the city of more than 12 million boasts 11 bridges crossing the Yangtze and a subway with nine lines and 228 stations. Air conditioners, TVs and cars are in abundance.
“Even after decades of closely following China, I am often surprised by its capacity for change and willingness to adapt,” says Watson, who has lived and worked in Hong Kong since 2000.
Watson recently marked the 40th anniversary of that first trip to China. Here he shares how his perceptions of the country changed over the years, lessons learned as a professional investor there and how he is thinking about the investment environment today.
40 years of explosive growth
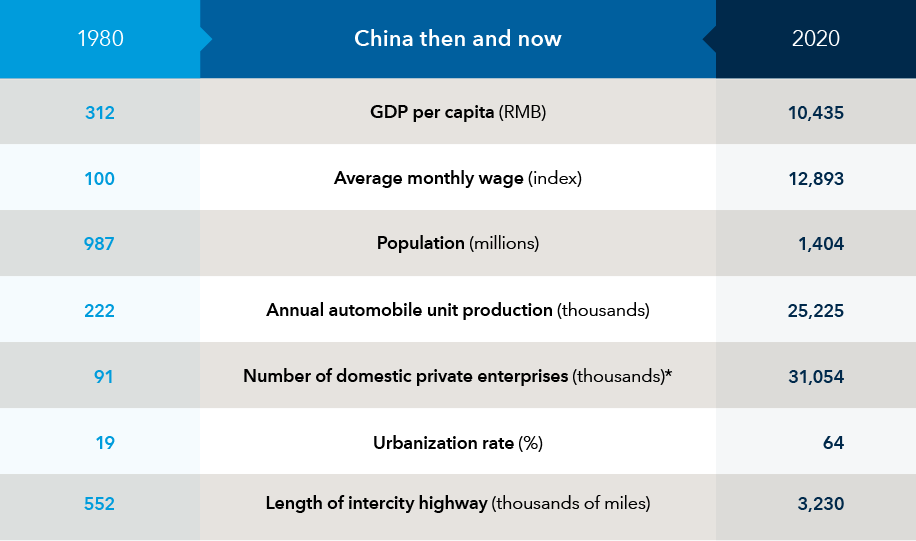
Sources: Capital Group, CEIC Data, IMF, The World Bank. *Data for number of private enterprises as of 1988 and 2018. RMB represents Chinese renminbi.
China produces great entrepreneurs
At Capital Group, we have always believed that the quality of a company’s management is critical to the success or failure of the business. So we place a great deal of emphasis on investing with great business leaders, and China has produced some great entrepreneurs.
One example is Wu Yajun, co-founder of Longfor Properties, whom I met on one of my first trips as the new Hong Kong property analyst in 2000 when the company was still nine years from its Hong Kong IPO. I was struck by Madame Wu’s integrity, determination and dedication to her customers and employees. That assessment proved to be accurate in my view, and Wu is among the property developers who transformed the face of China over decades of explosive growth.
I also had the privilege of meeting the founders of what are now some of the country’s digital giants, though I didn’t always immediately recognize the extent to which some would become change agents.
More than 21 years ago I met Pony Ma, founder of a startup Shenzhen-based tech firm called Tencent. The company primarily offered an instant messaging service. Its name was derived from the price of an individual message at the time: ten (yuan) cents.
At the time Tencent consisted of Ma and a dozen or so young employees busily tapping away on keyboards in a dim basement. I was intrigued but didn’t have an adequate sense of what it might become.
China’s manufacturing engine climbs the value chain
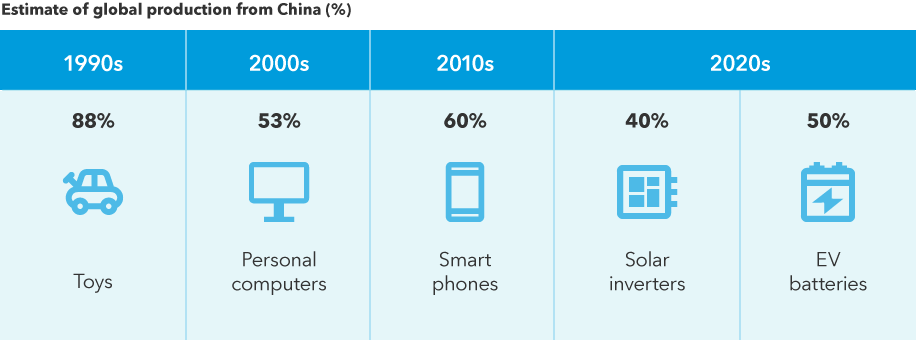
Source: Capital Group, based on reports from Euromonitor, SNE Research and company filings. Data is as of May 2021 and reflects approximate figures.
Identifying a great CEO is more art than science, and not every business has a strong leader. Years ago I invested in Sino-Forest, a Toronto-listed Chinese company that purported to acquire and manage forest lands and sell them to other investors. In reality, management misled investors by inventing phony transactions, among other things. In 2017, a Canadian regulator ruled that CEO Allen Chan and several other directors had committed fraud.
While this situation was not unique, there are nevertheless many Chinese companies that recognize the importance of transparency and are taking steps to align with the standards of other countries.
I'm on the council of the Asian Corporate Governance Association, a Hong Kong-based organization which meets with many Chinese companies interested in becoming members and learning about corporate best practices in very practical areas.
In any country we must be sure that what we are hearing is the truth. We need to keep the lines of communication open with company management. We also need to be skeptical and thorough in our research.
China is vast, with many risks and opportunities
For years pundits have predicted China’s imminent economic demise. As early as 2001, in his book, The Coming Collapse of China, author Gordon Chang described how the grip of the Communist Party, bad debt in the banking system, capital misallocation, corruption and property bubbles would conspire to end the Chinese economic miracle.
Contrary to the expectations of Chang and many others, the country resisted collapse. While many of these problems are real, in my experience its leaders were — and remain — focused on avoiding decline. We can watch with concern the danger zones, especially debt buildup and the misallocation of capital, but we should remember that China’s policymakers focus on those same issues.
Indeed, China’s stratospheric growth has often confounded close observers expecting collapse or stagnation. Consider China’s property market, which early in my career I covered as an analyst. The fear of an imminent property collapse has been with us at least since the early 2000s. In 2003, a colleague of mine, reflecting on a trip to Shanghai wrote that he had witnessed mile after mile of new apartments, offices and factories, many of which appeared unoccupied. “I think I am witnessing a bubble of major proportions,” he wrote at the time.
Chinese property prices instead rose dramatically over the years, stubbornly refusing to collapse. It was difficult for many to comprehend the transformative effect of urbanization, alongside a general need for upgrades to the national property stock. Arguably, the country remains under-urbanized today.
Urbanization is on the rise in China’s workforce and markets
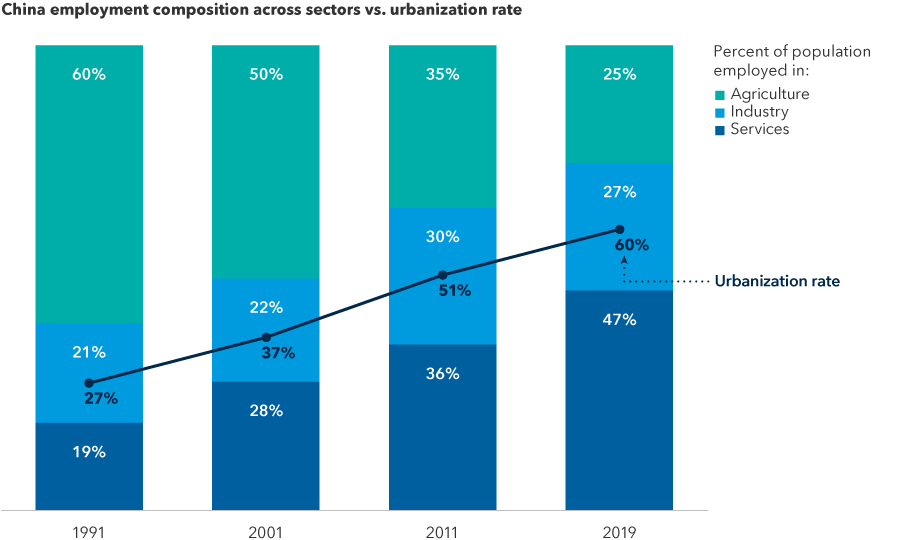
Sources: Capital Group, The World Bank. Most recent population employment data is as of 2019.
The vast size of China’s market presents significant opportunity, but it is important to remember that China is no monolith that thinks and acts with a single voice. In fact, with a population of 1.4 billion (as of 2020) spread across 23 provinces, five autonomous regions, four municipalities under direct control of the central government and two special administrative regions, China is a complex and often opaque entity that doesn’t necessarily head in one direction without internal conflict along the way. And the result of that heterogeneity can be outcomes that confound expectations.
Investing in China requires firsthand knowledge
Living in Hong Kong for more than 22 years helps me appreciate China’s many complexities. Our office there opened in 1983 and was located in the apartment of the company’s first employee, Sin-Ming Shaw. That same year, former chairman Jon B. Lovelace spoke before the State Council of the People’s Republic of China in Beijing. Capital made its first equity investments in China in 1994 and formed our China Group in 2001.

Watson with members of Capital’s China group on a visit to Shanghai in 2015
Today we have eight China industry specialists. I consider them essential to our understanding of the investment risks and opportunities the country provides.
For example, recent research into the electric vehicle battery supply chain, in which China is a leader, helped some of my colleagues make informed decisions on the manufacturers there.
Our Shanghai industry specialists, working with colleagues in other offices, are currently interviewing hundreds of individuals who live in the largest, most-developed cities as well as the smaller cities to gain deeper insight into China’s property market. Respondents reply to questions about their financial situation, buying attitudes, real estate portfolios, property concerns and financing ability, among others.

Watson and a colleague visiting a steel plant in Tangshan in 2016
China’s government wields significant power in markets
When investing in China it’s wise to remember that the government is a powerful actor whose influence cannot be underestimated. Recently, Chinese authorities imposed tight regulations on internet platform companies they felt were out of line with the government’s common prosperity agenda. In some cases these businesses were deemed too profitable or conducting business at odds with the public interest.
The shifts in government policy surprised many, including me, and shares of the platform companies tumbled. The government also intervenes in other areas of the private sector like education and gaming.
As investors, we must pay close attention to these changes and fully understand the implications of China’s common prosperity agenda. Without a doubt, political risk is higher than in other markets, but China wants a growing and dynamic economy, characterized by a significant degree of innovation. I believe its leaders know this cannot be accomplished solely by state-owned enterprises.
Today many companies are nervous about appearing too profitable — and showing too much growth. But I think they will reach an equilibrium in which business leaders figure out how they can thrive and be appreciated by the government and the government can determine how best to use private enterprise to achieve its long-term economic goals.
Swift growth has reshaped China’s market
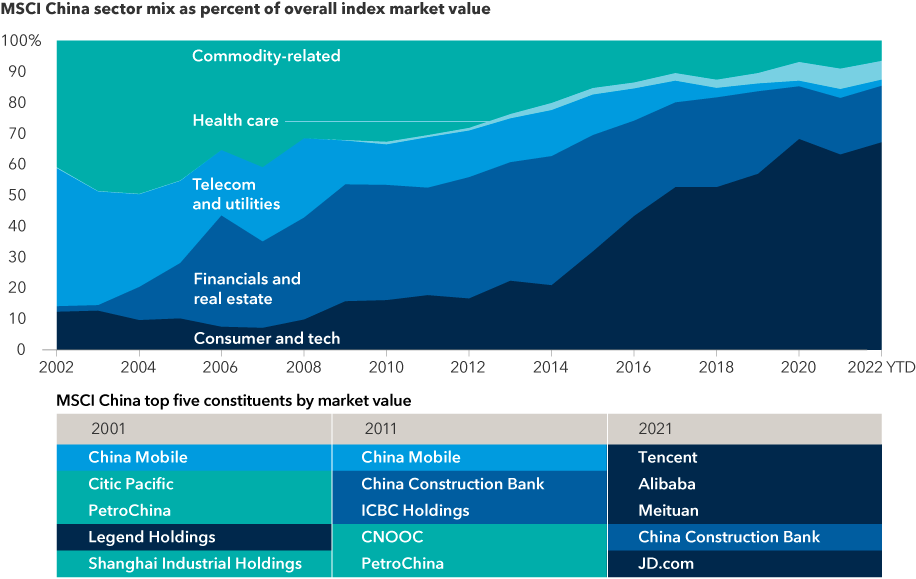
Sources: Capital Group, MSCI, RIMES. Sector composition as of March 24, 2022. Top companies as of December 31, 2021. The telecom and utilities category includes telecommunications services sector prior to 2018, at which point it was reclassified as communication services and its composition was materially changed. The consumer and tech category includes consumer discretionary, consumer staples, information technology and communication services. The commodity-related category includes industrials, materials and energy. Colour legend reflects sector classification as of the end of each respective year.
Contrarian investing in China today
I am a contrarian investor by nature and today, when shares of many Chinese companies have dropped significantly and investors are increasingly worried, I think it’s good to remain open-minded to investing in China. Lately I have been looking at a variety of industries, including consumer goods, corporate services and even internet platforms. But I caution: It is not an easy market to understand. Deep fundamental research by experienced industry specialists locally is essential.
Investors in China can look for the same things they seek in other markets, such as companies with strong management teams willing to reward shareholders, good products, attention to quality, a focus on profitability, an understanding of balance-sheet efficiency and, of course, skill in navigating government relations.
Learn more about
The MSCI China Investable Market Index captures large-, mid- and small-cap representation of approximately 99% of the investable equity universe for mainland China's market. There are 986 constituents as of July 31, 2021.
Our latest insights
-
-
Market Volatility
-
-
Currencies
-
Market Volatility
RELATED INSIGHTS
-
Global Equities
-
U.S. Equities
-
Commissions, trailing commissions, management fees and expenses all may be associated with investments in investment funds. Please read the prospectus before investing. Investment funds are not guaranteed or covered by the Canada Deposit Insurance Corporation or by any other government deposit insurer. For investment funds other than money market funds, their values change frequently. For money market funds, there can be no assurances that the fund will be able to maintain its net asset value per security at a constant amount or that the full amount of your investment in the fund will be returned to you. Past performance may not be repeated.
Unless otherwise indicated, the investment professionals featured do not manage Capital Group‘s Canadian investment funds.
References to particular companies or securities, if any, are included for informational or illustrative purposes only and should not be considered as an endorsement by Capital Group. Views expressed regarding a particular company, security, industry or market sector should not be considered an indication of trading intent of any investment funds or current holdings of any investment funds. These views should not be considered as investment advice nor should they be considered a recommendation to buy or sell.
Statements attributed to an individual represent the opinions of that individual as of the date published and do not necessarily reflect the opinions of Capital Group or its affiliates. This information is intended to highlight issues and not be comprehensive or to provide advice. For informational purposes only; not intended to provide tax, legal or financial advice. Capital Group funds are available in Canada through registered dealers. For more information, please consult your financial and tax advisors for your individual situation.
Forward-looking statements are not guarantees of future performance, and actual events and results could differ materially from those expressed or implied in any forward-looking statements made herein. We encourage you to consider these and other factors carefully before making any investment decisions and we urge you to avoid placing undue reliance on forward-looking statements.
The S&P 500 Composite Index (“Index”) is a product of S&P Dow Jones Indices LLC and/or its affiliates and has been licensed for use by Capital Group. Copyright © 2026 S&P Dow Jones Indices LLC, a division of S&P Global, and/or its affiliates. All rights reserved. Redistribution or reproduction in whole or in part are prohibited without written permission of S&P Dow Jones Indices LLC.
FTSE source: London Stock Exchange Group plc and its group undertakings (collectively, the "LSE Group"). © LSE Group 2026. FTSE Russell is a trading name of certain of the LSE Group companies. "FTSE®" is a trade mark of the relevant LSE Group companies and is used by any other LSE Group company under licence. All rights in the FTSE Russell indices or data vest in the relevant LSE Group company which owns the index or the data. Neither LSE Group nor its licensors accept any liability for any errors or omissions in the indices or data and no party may rely on any indices or data contained in this communication. No further distribution of data from the LSE Group is permitted without the relevant LSE Group company's express written consent. The LSE Group does not promote, sponsor or endorse the content of this communication. The index is unmanaged and cannot be invested in directly.
BLOOMBERG® is a trademark and service mark of Bloomberg Finance L.P. and its affiliates (collectively “Bloomberg”). Bloomberg or Bloomberg’s licensors own all proprietary rights in the Bloomberg Indices. Neither Bloomberg nor Bloomberg’s licensors approves or endorses this material, or guarantees the accuracy or completeness of any information herein, or makes any warranty, express or implied, as to the results to be obtained therefrom and, to the maximum extent allowed by law, neither shall have any liability or responsibility for injury or damages arising in connection therewith.
The MSCI information may only be used for your internal use, may not be reproduced or redisseminated in any form and may not be used as a basis for or a component of any financial instruments or products or indices. None of the MSCI information is intended to constitute investment advice or a recommendation to make (or refrain from making) any kind of investment decision and may not be relied on as such. Historical data and analysis should not be taken as an indication or guarantee of any future performance analysis, forecast or prediction. The MSCI information is provided on an “as is” basis and the user of this information assumes the entire risk of any use made of this information. MSCI, each of its affiliates and each other person involved in or related to compiling, computing or creating any MSCI information (collectively, the “MSCI Parties”) expressly disclaims all warranties (including, without limitation, any warranties of originality, accuracy, completeness, timeliness, non-infringement, merchantability and fitness for a particular purpose) with respect to this information. Without limiting any of the foregoing, in no event shall any MSCI Party have any liability for any direct, indirect, special, incidental, punitive, consequential (including, without limitation, lost profits) or any other damages. (www.msci.com)
Capital believes the software and information from FactSet to be reliable. However, Capital cannot be responsible for inaccuracies, incomplete information or updating of the information furnished by FactSet. The information provided in this report is meant to give you an approximate account of the fund/manager's characteristics for the specified date. This information is not indicative of future Capital investment decisions and is not used as part of our investment decision-making process.
Indices are unmanaged and cannot be invested in directly. Returns represent past performance, are not a guarantee of future performance, and are not indicative of any specific investment.
All Capital Group trademarks are owned by The Capital Group Companies, Inc. or an affiliated company in Canada, the U.S. and other countries. All other company names mentioned are the property of their respective companies.
Capital Group funds are offered in Canada by Capital International Asset Management (Canada), Inc., part of Capital Group, a global investment management firm originating in Los Angeles, California in 1931. Capital Group manages equity assets through three investment groups. These groups make investment and proxy voting decisions independently. Fixed income investment professionals provide fixed income research and investment management across the Capital organization; however, for securities with equity characteristics, they act solely on behalf of one of the three equity investment groups.
The Capital Group funds offered on this website are available only to Canadian residents.