Portfolio Construction
Categories
U.S. Equities
How AI is reshaping U.S. equity markets
 Martin Romo
 Greg Miliotes
 David Polak
 Victoria Quach
May 5, 2026
Signs of transformation are emerging in U.S. equity markets amid a torrent of AI-related spending. The shift comes after more than a decade of concentrated gains for market-cap-weighted indices, which thanks to a narrow group of megacap technology stocks, pushed valuations to historic extremes.
Investors are increasingly moving into sectors and individual stocks underrepresented in these indices. Dispersion among the stocks that constitute the S&P 500 Index is near multidecade highs. Previously lagging sectors, such as industrials, and style factors, including value and yield, are reasserting leadership amid expectations that AI hyperscalers could drive top-line growth.
In this environment, deep fundamental research and careful security selection have become increasingly important. Here are the key themes our team is following.
AI revolution gets physical as earnings surge
Although investors have focused on semiconductor manufacturers and hyperscalers to capitalize on the AI boom, focus has since shifted to AI-adjacent beneficiaries. These companies stand to benefit from a surge of tech-driven capital expenditure amid an arms race to train AI models, deploy them at scale and integrate them into virtual and physical workspaces.
Free cash flow in the tech sector has empowered a substantial increase in earnings expectations over the past few months. But the market appears to see through this dynamic, realizing instead of driving dividends, share buybacks or mergers and acquisitions as in the past, earnings could turn into top-line growth for AI-adjacent sectors. As a result, forward price-to-earnings (P/E) ratios of non-tech sectors are perking up.
Outside of the energy rally driven by the Iran conflict, industrials, utilities and materials have been among the better performing sectors year-to-date through March. These sectors drive the picks-and-shovels enablement of the AI boom, powering steel- and concrete-intensive data centres built with plumbing, HVAC machinery and electrical — some of which are back-ordered for years.
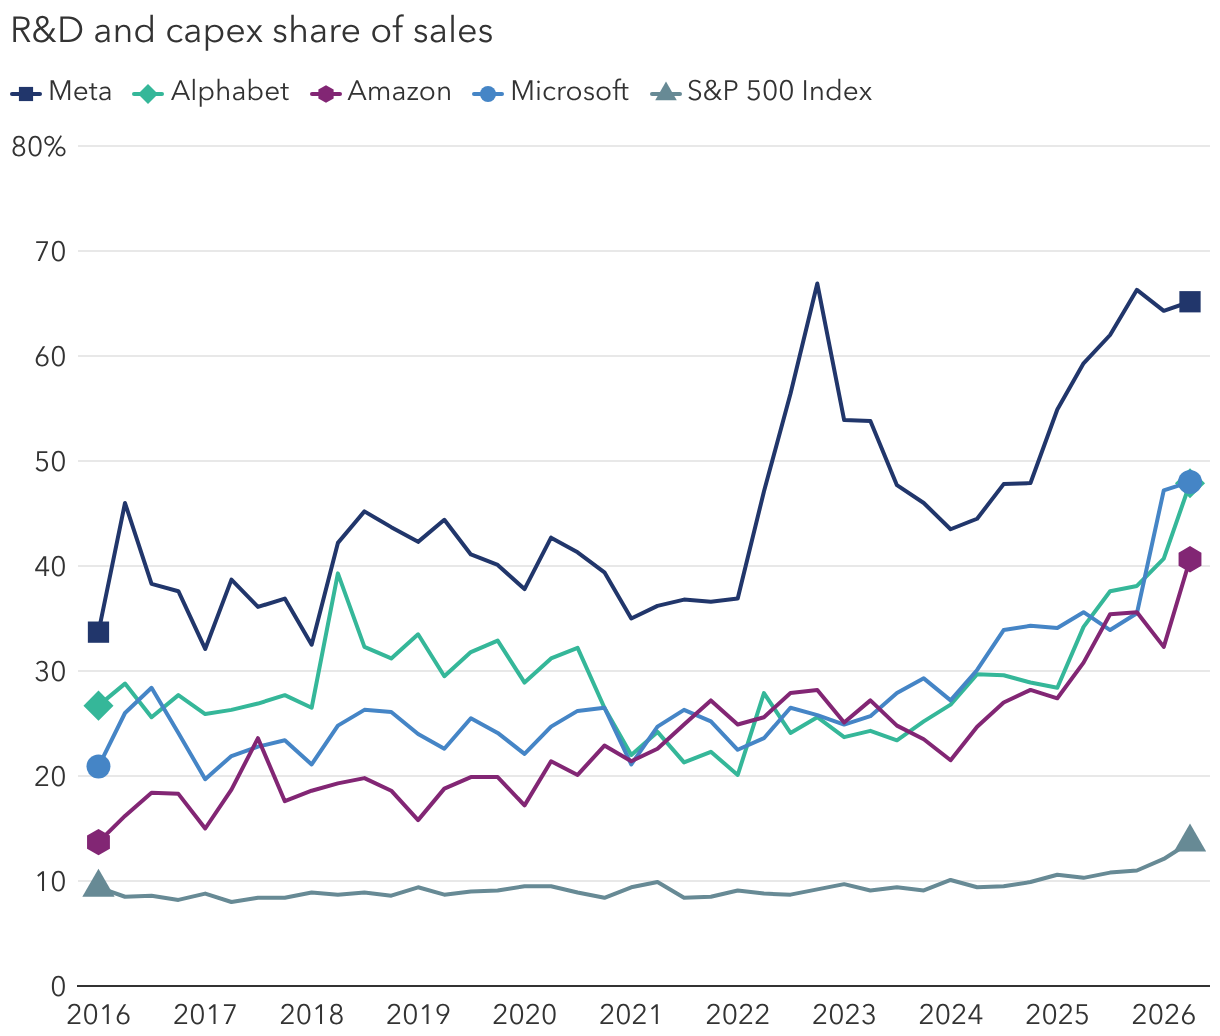
AI spending surge puts hyperscalers atop broader market
Sources: Capital Group, FactSet. As of March 31, 2026. R&D: Research and development costs. Capex: Capital expenditure.
Magnificent Seven introduces concentration risk
The Magnificent Seven stocks have been moving in ways that challenge portfolio diversification. There are two dimensions to this:
- How correlated are these seven stocks to each other?
- How correlated are they to the rest of the S&P 500?
When correlations are high, the benefits of diversification fall, because these stocks increasingly trade as a single unit. A 2025 analysis by S&P Global Market Intelligence found the average rolling 2-year correlation among this cohort hit nearly 60% in 2024, with the highest correlations between Microsoft and both Alphabet and Amazon.
Relative to the S&P 500 Equal Weight Index, the Magnificent Seven’s correlation hit almost 100% in the second half of 2025 before reversing into negative territory, as these stocks have significantly underperformed the average S&P 500 stock as of March 31, 2026.
This correlation trend shows that owning all seven is no longer providing independent streams of return but rather one giant concentrated tech position.
Gap widens between winners and losers
Cross-sectional volatility within the S&P 500 is returning to COVID-era highs. This indicates the gap between winners and losers is widening.
A 2025 analysis by Goldman Sachs found that roughly 73% of the variance in the typical S&P 500 stock’s trailing 6-month return in USD was driven by company-specific factors, versus an average of 58% from 2002 through the first two months of 2025. Separately, a 2024 analysis by Morningstar found a correlation between higher return dispersion and higher active manager success rates against their benchmarks during the period studied from 1999 to 2023.
S&P 500 cross-sectional volatility rises
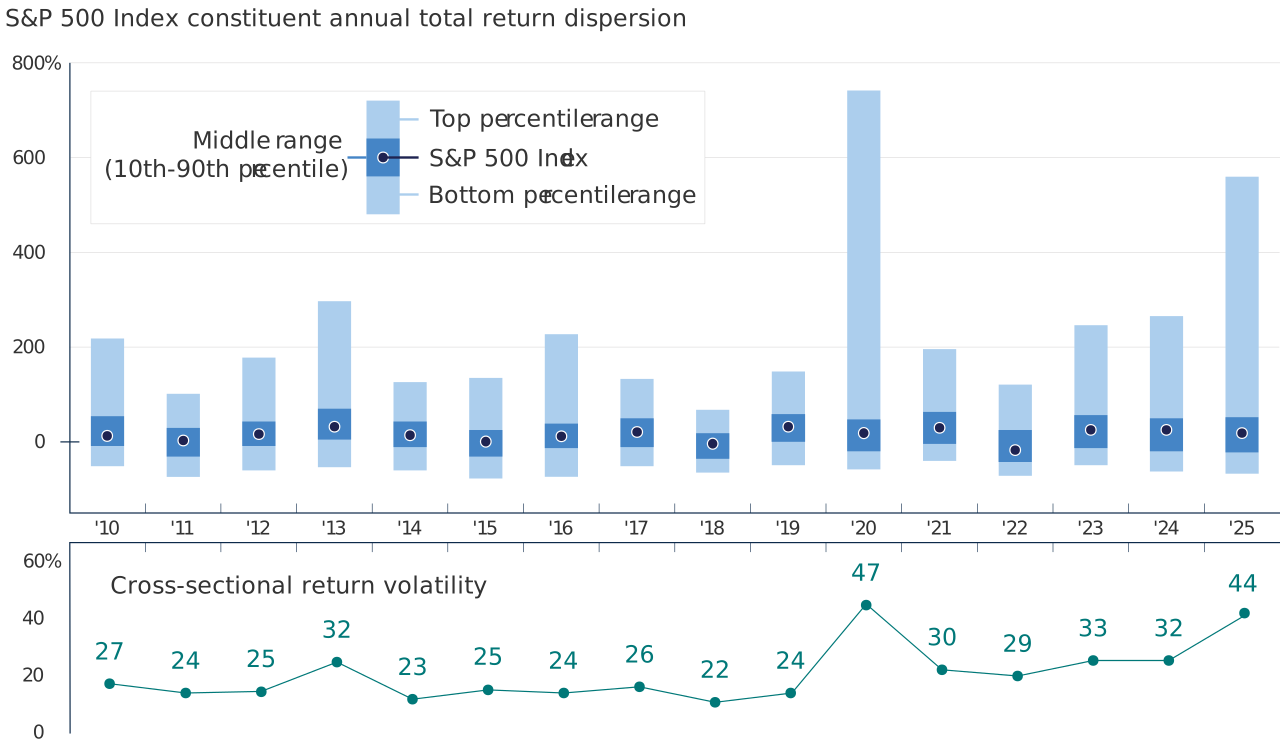
Source: Capital Group. As of December 31, 2025. Based on Bloomberg total return data in USD for S&P 500 constituents. Return volatility is expressed through standard deviation.
Smaller, cheaper and rising fast
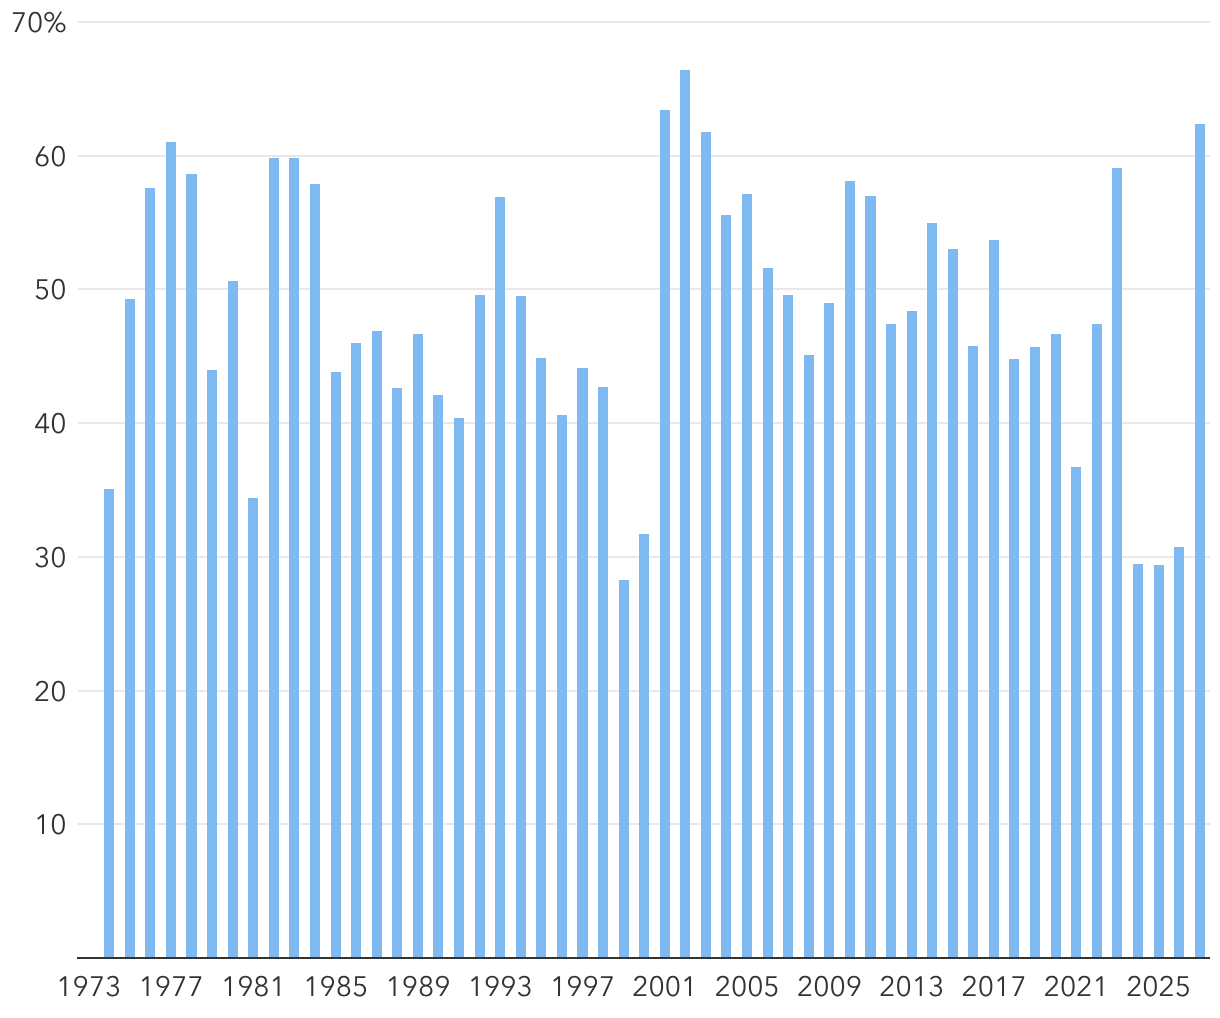
Finally, 2026 started with 62.4% of S&P 500 constituents outperforming the index itself — the highest level in more than two decades and a marked reversal from the lows seen in recent years.
Share of individual stocks outperforming hits multidecade high
Source: Ned Davis Research, Inc. Based on year-end data from 1973 to 2026 (year-to-date as of February 16, 2026).
Returns are no longer concentrated in a handful of megacap, growth-oriented stocks. For example, value has outpaced growth. The Russell 1000 Value Index beat the Russell 1000 Growth Index by 12% through the first quarter.
Small-cap stocks represent another area of opportunity. After years of underperformance, they trade at historical valuation discounts relative to large caps. The Russell 2000 Index, which tracks small-cap stocks, outpaced the S&P 500 by more than 5% as of March 31, 2026.
Bottom line
The capital expenditure fuelling the AI boom is also driving broader dispersion in the market. Success moving forward is likely to depend on discernment — directing capital toward quality businesses, emerging winners and genuine bargains, while avoiding the overhyped and overvalued. A more selective approach could become increasingly important if capital transfer accelerates between sectors in the years ahead — rotating from tech earnings and capex to companies anchored in tangible assets, durable cash flows and disciplined reinvestment.
Learn more about
Martin Romo is a portfolio manager for Capital Group U.S. Equity Fund (Canada).
Greg Miliotes is a portfolio manager for Capital Group U.S. Equity Fund (Canada).
Correlation: A statistical measure of how assets or indexes move in relation to each other, ranging from -1 to 1. A positive correlation close to 1 implies that when one moves either up or down, the other moves in the same direction. A negative correlation approaching -1 indicates the two have moved in opposite directions.
Magnificent Seven: A group of companies (Microsoft, Apple, Alphabet, Amazon, NVIDIA, Meta and Tesla) whose stocks dominated U.S. stock market indexes in 2023.
Passive funds are not striving to outpace their benchmarks; rather, they seek to replicate the benchmark’s return pattern.
Price-to-earnings (P/E) ratio: A company’s price per share of stock divided by the company’s earnings per share. Also known as the earnings multiple, this measure is a common tool in fundamental analysis that helps compare how relatively expensive one stock may be compared to another.
Russell 1000 Growth Index: A market-capitalization-weighted index that represents the large-cap growth segment of the U.S. equity market and includes stocks from the Russell 1000 Index with higher price-to-book ratios and higher expected growth values.
Russell 1000 Value Index: A market capitalization-weighted index that represents the large-cap value segment of the U.S. equity market and includes stocks from the Russell 1000 Index that have lower price-to-book ratios and lower expected growth values. This index is unmanaged, and its results include reinvested dividends and/or distributions but do not reflect the effect of sales charges, commissions, account fees, expenses or U.S. federal income taxes.
Russell 2000 Index: Measures the results of small-cap segment of the U.S. equity universe. The Russell 2000 Index is a subset of the Russell 3000 Index. It includes approximately 2,000 of the smallest securities based on a combination of their market cap and current index membership.
Standard deviation: A statistical measure that quantifies the amount of variation or dispersion of a set of values from their mean.
S&P 500 Equal Weight Index (EWI): The equal-weight version of the widely used S&P 500 Index. The EWI includes the same constituents as the capitalization-weighted S&P 500, but each company in the S&P 500 EWI is allocated a fixed weight, about 0.2% of the index total, at each quarterly rebalance.
S&P 500 Index: A market-capitalization-weighted index based on the results of approximately 500 widely held common stocks. This index is unmanaged, and its results include reinvested dividends and/or distributions but do not reflect the effect of sales charges, commissions, account fees, expenses or U.S. federal income taxes.
Success rate: The percentage by which a portfolio outperforms a benchmark or index over a given period.
Our latest insights
-
-
Technology & Innovation
-
Objective-Based Investing
-
-
Active Management
RELATED INSIGHTS
-
Portfolio Construction
-
-
Commissions, trailing commissions, management fees and expenses all may be associated with investments in investment funds. Please read the prospectus before investing. Investment funds are not guaranteed or covered by the Canada Deposit Insurance Corporation or by any other government deposit insurer. For investment funds other than money market funds, their values change frequently. For money market funds, there can be no assurances that the fund will be able to maintain its net asset value per security at a constant amount or that the full amount of your investment in the fund will be returned to you. Past performance may not be repeated.
Unless otherwise indicated, the investment professionals featured do not manage Capital Group‘s Canadian investment funds.
References to particular companies or securities, if any, are included for informational or illustrative purposes only and should not be considered as an endorsement by Capital Group. Views expressed regarding a particular company, security, industry or market sector should not be considered an indication of trading intent of any investment funds or current holdings of any investment funds. These views should not be considered as investment advice nor should they be considered a recommendation to buy or sell.
Statements attributed to an individual represent the opinions of that individual as of the date published and do not necessarily reflect the opinions of Capital Group or its affiliates. This information is intended to highlight issues and not be comprehensive or to provide advice. For informational purposes only; not intended to provide tax, legal or financial advice. Capital Group funds are available in Canada through registered dealers. For more information, please consult your financial and tax advisors for your individual situation.
Forward-looking statements are not guarantees of future performance, and actual events and results could differ materially from those expressed or implied in any forward-looking statements made herein. We encourage you to consider these and other factors carefully before making any investment decisions and we urge you to avoid placing undue reliance on forward-looking statements.
The S&P 500 Composite Index (“Index”) is a product of S&P Dow Jones Indices LLC and/or its affiliates and has been licensed for use by Capital Group. Copyright © 2026 S&P Dow Jones Indices LLC, a division of S&P Global, and/or its affiliates. All rights reserved. Redistribution or reproduction in whole or in part are prohibited without written permission of S&P Dow Jones Indices LLC.
FTSE source: London Stock Exchange Group plc and its group undertakings (collectively, the "LSE Group"). © LSE Group 2026. FTSE Russell is a trading name of certain of the LSE Group companies. "FTSE®" is a trade mark of the relevant LSE Group companies and is used by any other LSE Group company under licence. All rights in the FTSE Russell indices or data vest in the relevant LSE Group company which owns the index or the data. Neither LSE Group nor its licensors accept any liability for any errors or omissions in the indices or data and no party may rely on any indices or data contained in this communication. No further distribution of data from the LSE Group is permitted without the relevant LSE Group company's express written consent. The LSE Group does not promote, sponsor or endorse the content of this communication. The index is unmanaged and cannot be invested in directly.
BLOOMBERG® is a trademark and service mark of Bloomberg Finance L.P. and its affiliates (collectively “Bloomberg”). Bloomberg or Bloomberg’s licensors own all proprietary rights in the Bloomberg Indices. Neither Bloomberg nor Bloomberg’s licensors approves or endorses this material, or guarantees the accuracy or completeness of any information herein, or makes any warranty, express or implied, as to the results to be obtained therefrom and, to the maximum extent allowed by law, neither shall have any liability or responsibility for injury or damages arising in connection therewith.
The MSCI information may only be used for your internal use, may not be reproduced or redisseminated in any form and may not be used as a basis for or a component of any financial instruments or products or indices. None of the MSCI information is intended to constitute investment advice or a recommendation to make (or refrain from making) any kind of investment decision and may not be relied on as such. Historical data and analysis should not be taken as an indication or guarantee of any future performance analysis, forecast or prediction. The MSCI information is provided on an “as is” basis and the user of this information assumes the entire risk of any use made of this information. MSCI, each of its affiliates and each other person involved in or related to compiling, computing or creating any MSCI information (collectively, the “MSCI Parties”) expressly disclaims all warranties (including, without limitation, any warranties of originality, accuracy, completeness, timeliness, non-infringement, merchantability and fitness for a particular purpose) with respect to this information. Without limiting any of the foregoing, in no event shall any MSCI Party have any liability for any direct, indirect, special, incidental, punitive, consequential (including, without limitation, lost profits) or any other damages. (www.msci.com)
Capital believes the software and information from FactSet to be reliable. However, Capital cannot be responsible for inaccuracies, incomplete information or updating of the information furnished by FactSet. The information provided in this report is meant to give you an approximate account of the fund/manager's characteristics for the specified date. This information is not indicative of future Capital investment decisions and is not used as part of our investment decision-making process.
Indices are unmanaged and cannot be invested in directly. Returns represent past performance, are not a guarantee of future performance, and are not indicative of any specific investment.
All Capital Group trademarks are owned by The Capital Group Companies, Inc. or an affiliated company in Canada, the U.S. and other countries. All other company names mentioned are the property of their respective companies.
Capital Group funds are offered in Canada by Capital International Asset Management (Canada), Inc., part of Capital Group, a global investment management firm originating in Los Angeles, California in 1931. Capital Group manages equity assets through three investment groups. These groups make investment and proxy voting decisions independently. Fixed income investment professionals provide fixed income research and investment management across the Capital organization; however, for securities with equity characteristics, they act solely on behalf of one of the three equity investment groups.
The Capital Group funds offered on this website are available only to Canadian residents.