Active Management
Categories
Economic Indicators
Macro outlook: Growth hinges on Iran war, AI rollout
 Darrell Spence
 Beth Beckett
 Paul Benjamin
 Chitrang Purani
 Chris Buchbinder
 Matt Miller
 Tryggvi Gudmundsson
June 10, 2026
KEY TAKEAWAYS
- AI and the Iran war are pulling the global economy in opposite directions.
- Wars have pushed oil prices higher, but stocks typically recovered quickly.
- Employment data may drive the Fed’s interest rate policy.
- U.S. midterm elections could bring more volatility and muted returns.
Global economic growth is coming under pressure due to the Iran war, rising oil prices and ongoing trade disputes, but one powerful engine is more than making up for it: AI-related investment spending.
The artificial intelligence boom is so massive that even if activity in all other sectors contracted, overall economic growth could remain in positive territory, especially in the United States, says Capital Group economist Darrell Spence.
“I remain on the cautious side when it comes to the outlook for U.S. growth,” Spence explains, “but it is still possible that GDP could be significantly higher than expected — in the range of 2.5% or more. That’s how much the AI arms race is contributing to overall economic growth.”
Iran war and AI are pulling the global economy in opposite directions
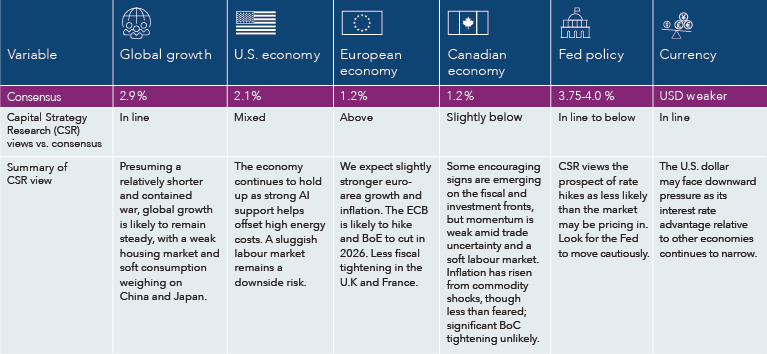
Sources: Capital Group, Bloomberg. As of May 31, 2026. Consensus figures are based on mean Bloomberg consensus estimates for U.S. CPI change in 2026 (“U.S. inflation”) and 2026 year-over-year GDP growth for the world (“global growth”), the United States (“U.S. economy”), the European Union (“European economy”) and Canada (“Canadian economy”). Consensus figures for “Fed policy” are based on the implied federal funds target range based on futures pricing for December 2026. Consensus “currency” figure is based on DXY futures pricing through December 2026. The views of individual portfolio managers and analysts may differ from Capital Strategy Research (CSR) views. Stagflationary: economic environment categorized by high inflation coinciding with slow economic growth (GDP) and high unemployment. ECB: European Central Bank. BoE: Bank of England. BoC: Bank of Canada. DXY: U.S. Dollar Index.
For the U.S. and the rest of the world, much depends on the duration and severity of the Iran war, mounting inflationary pressures, weakening consumer fundamentals, and whether the AI boom marches on or fizzles out.
“There is a tug of war between these global economic forces, and it could be a while before a clear winner emerges,” Spence adds. In the meantime, economic growth driven solely by one sub-sector of the economy may not necessarily be healthy growth.
Elsewhere, Europe is facing a stagflationary shock before year-end, as higher energy prices weigh on activity, according to Capital Group economist Beth Beckett. “I do expect a much smaller shock than we saw in 2022, thanks in part to stronger manufacturing activity and looser fiscal policy in Germany.” Higher defence spending in Europe has already provided a significant boost to the region’s aerospace and defence companies, and that is expected to continue as geopolitical conflicts increasingly shape the global landscape.
In Canada, CUSMA negotiations look like they may get messy, which should keep uncertainty high and deter capex/hiring in trade-sensitive sectors, according to Canada economist Tryggvi Gundmundsson. “Although there’s still debate as to whether the economy is officially in recession after the second-quarter GDP print, there is little doubt Canada is struggling to grow amid U.S. trade tensions,” he says.
In Asia, look for a weak housing market and slowing global trade to weigh on China’s economy while Japan remains sluggish as the conflict in the Middle East impairs export activity. Both countries are dealing with an energy crunch due to the Iran war. As long as the Strait of Hormuz remains closed or partially blocked, restricted oil supplies could further constrain economic growth, particularly once strategic reserves are depleted. Prior to the war, China was by far the largest buyer of Iranian oil.
Oil shock is a risk, but we’ve been here before
The Iran war is a stark reminder that the world still runs on oil. When supply is threatened, the impact of higher oil prices spreads quickly to businesses, consumers and global markets.
About one-fifth of the world’s oil supply moves through the Strait of Hormuz, off the coast of Iran, so any disruption there is almost immediately reflected in fuel prices. Even in the United States, the world’s largest oil producer, the price of gasoline at the pump has jumped nearly 53% since the war started.
“There are very real economic risks, and the costs will only compound as the war drags on,” says equity portfolio manager Paul Benjamin. “A persistent conflict could trigger weaker equities, a stronger U.S. dollar and widening credit spreads.”
The good news is, over the past two decades, stock markets have generally bounced back from geopolitical shocks because they haven’t resulted in prolonged physical supply outages. Across seven oil supply shocks, from the First Gulf War in the 1990s to Russia’s invasion of Ukraine in 2022, U.S. equities fell by an average of 1% two weeks following the disruption, then rose 1.4% a month later, 12% a year later and 32.3% over the next two years. It’s a helpful reminder that markets are forward-looking and may already be anticipating a resolution to the present crisis.Interest rate outlook is murky at best.
Wars have pushed oil prices higher, but stocks have recovered relatively fast

Sources: Capital Group, Bloomberg, S&P Global. Geopolitical shocks include: Gulf War (8/1990), Second Gulf War (3/2003), Niger Delta supply disruptions (2/2006), Arab Spring, Libya Civil War (2/2011), Hormuz closure risk, Iran sanctions (12/2011), drone attack on Saudi installations (9/2019), Russian invasion of Ukraine (2/2022). Event dates are aligned to the nearest observable market price (“T”). If a shock occurs on a non‑trading day, the prior trading day is used as the start date. Horizon returns are measured using the first available trading day on or after the stated calendar horizon (e.g., “T+2 days”). Figures reflect total returns in USD. As of May 31, 2026.
Interest rate outlook is murky at best
With key U.S. Federal Reserve (Fed) meetings on June 16 and 17, all eyes are on new Fed Chair Kevin Warsh for clues about the future direction of interest rates. President Trump has already weighed in, recently telling NBC’s Meet the Press, “There’s no reason to raise interest rates.” That comment followed a strong U.S. jobs report, which has fuelled speculation of a Fed rate hike before the end of the year.
Indeed, U.S. employment data may hold the key to the Fed’s next move, even as war-driven inflation intensifies. Fed officials have indicated in recent months that supporting the labour market may have to take precedence over the fight against inflation.
Inflation has moved sharply higher. The U.S. Consumer Price Index climbed 4.2% in May, the largest jump since April 2023. The increase was primarily driven by higher energy costs, which rose 23.5% compared to a year ago.
Labour markets are weaker than they were a few years ago, but remain steady overall, notes Capital Group fixed income manager Chitrang Purani. “The war is keeping inflation above the Fed’s 2% target and may weigh on non-AI business investment as well as consumer demand. That combination increases the risk of a more pronounced slowdown in growth.”
Purani believes policymakers will remain patient. “The labour market has been stable, with slower job growth offset by slower labour force expansion, but if this balance were to shift toward a rising U.S. unemployment rate the Fed will likely look past near-term inflation risks.”
With the U.S. job market softening, the Fed has room to cut rates

Sources: Capital Group, Bloomberg, U.S. Federal Reserve. Fed funds target rate reflects the upper bound of the Federal Open Markets Committee’s (FOMC) target range for overnight lending among U.S. banks. As of May 31, 2026.
U.S. midterm elections: Volatility, then stocks have rallied
With everything else happening in the world, investors may not be focused on the U.S. midterm elections yet. But this pivotal contest is just a few months away, and it could have a noticeable effect on the stock market, if history is any guide.
To gauge the impact, Capital Group examined more than 90 years of S&P 500 Index data, and it turns out that stocks do exhibit some unique characteristics during midterm years. Market volatility tends to rise, returns tend to be muted and, once the outcome is known, stocks tend to rally.
So far the competing forces of rising corporate earnings, the Iran war and a powerful rally in AI stocks are driving market activity, but that could change as investors turn their attention to what is likely to be a rancorous election season.
U.S. stocks have generally rallied after midterm election volatility

Sources: Capital Group, S&P Global, RIMES. Calculations use Election Day as the starting date in all election years, and November 5 as a proxy for the starting date in other years. Only midterm election years are shown in the chart. Price returns exclude the reinvestment of dividends and capital distributions. As of December 31, 2025. Returns are in USD.
The silver lining is that returns have tended to be strong during the full year following midterm elections, averaging 15.4% in U.S. dollar terms since 1950. Still, for long-term investors, these short-term moves don’t normally mean much. “There may be bumps in the road,” says Chris Buchbinder, portfolio manager for Capital Group U.S. Equity FundTM (Canada), “and investors should brace for short-term volatility, but I don’t expect election results to be a huge driver of investment outcomes one way or the other.”
Plus, at this point, it’s just too close to call.
“We all know that, historically speaking, the party in power tends to face setbacks in the midterms, and so history favours the Democrats,” says Capital Group political economist Matt Miller. “But remember, we are still far from election day. Five months is a lifetime in politics. I think we will see an enormous amount of energy and well-funded advertising campaigns that I think could make this election closer than folks expect. It might just give Republicans a chance to eke out what today would be considered a surprise win.”
Learn more about
S&P 500 Index is a market capitalization-weighted index based on the results of approximately 500 widely held common stocks. The market index is unmanaged and, therefore, has no expenses. Investors cannot invest directly in an index.
U.S. Dollar Index is a measure of the value of the U.S. dollar relative to the value of a basket of currencies of the majority of the U.S.'s most significant trading partners.
Consumer Price Index is a measure of the average change over time in the prices paid by urban consumers for a market basket of consumer goods and services.
Our latest insights
RELATED INSIGHTS
Commissions, trailing commissions, management fees and expenses all may be associated with investments in investment funds. Please read the prospectus before investing. Investment funds are not guaranteed or covered by the Canada Deposit Insurance Corporation or by any other government deposit insurer. For investment funds other than money market funds, their values change frequently. For money market funds, there can be no assurances that the fund will be able to maintain its net asset value per security at a constant amount or that the full amount of your investment in the fund will be returned to you. Past performance may not be repeated.
Unless otherwise indicated, the investment professionals featured do not manage Capital Group‘s Canadian investment funds.
References to particular companies or securities, if any, are included for informational or illustrative purposes only and should not be considered as an endorsement by Capital Group. Views expressed regarding a particular company, security, industry or market sector should not be considered an indication of trading intent of any investment funds or current holdings of any investment funds. These views should not be considered as investment advice nor should they be considered a recommendation to buy or sell.
Statements attributed to an individual represent the opinions of that individual as of the date published and do not necessarily reflect the opinions of Capital Group or its affiliates. This information is intended to highlight issues and not be comprehensive or to provide advice. For informational purposes only; not intended to provide tax, legal or financial advice. Capital Group funds are available in Canada through registered dealers. For more information, please consult your financial and tax advisors for your individual situation.
Forward-looking statements are not guarantees of future performance, and actual events and results could differ materially from those expressed or implied in any forward-looking statements made herein. We encourage you to consider these and other factors carefully before making any investment decisions and we urge you to avoid placing undue reliance on forward-looking statements.
The S&P 500 Composite Index (“Index”) is a product of S&P Dow Jones Indices LLC and/or its affiliates and has been licensed for use by Capital Group. Copyright © 2026 S&P Dow Jones Indices LLC, a division of S&P Global, and/or its affiliates. All rights reserved. Redistribution or reproduction in whole or in part are prohibited without written permission of S&P Dow Jones Indices LLC.
FTSE source: London Stock Exchange Group plc and its group undertakings (collectively, the "LSE Group"). © LSE Group 2026. FTSE Russell is a trading name of certain of the LSE Group companies. "FTSE®" is a trade mark of the relevant LSE Group companies and is used by any other LSE Group company under licence. All rights in the FTSE Russell indices or data vest in the relevant LSE Group company which owns the index or the data. Neither LSE Group nor its licensors accept any liability for any errors or omissions in the indices or data and no party may rely on any indices or data contained in this communication. No further distribution of data from the LSE Group is permitted without the relevant LSE Group company's express written consent. The LSE Group does not promote, sponsor or endorse the content of this communication. The index is unmanaged and cannot be invested in directly.
BLOOMBERG® is a trademark and service mark of Bloomberg Finance L.P. and its affiliates (collectively “Bloomberg”). Bloomberg or Bloomberg’s licensors own all proprietary rights in the Bloomberg Indices. Neither Bloomberg nor Bloomberg’s licensors approves or endorses this material, or guarantees the accuracy or completeness of any information herein, or makes any warranty, express or implied, as to the results to be obtained therefrom and, to the maximum extent allowed by law, neither shall have any liability or responsibility for injury or damages arising in connection therewith.
The MSCI information may only be used for your internal use, may not be reproduced or redisseminated in any form and may not be used as a basis for or a component of any financial instruments or products or indices. None of the MSCI information is intended to constitute investment advice or a recommendation to make (or refrain from making) any kind of investment decision and may not be relied on as such. Historical data and analysis should not be taken as an indication or guarantee of any future performance analysis, forecast or prediction. The MSCI information is provided on an “as is” basis and the user of this information assumes the entire risk of any use made of this information. MSCI, each of its affiliates and each other person involved in or related to compiling, computing or creating any MSCI information (collectively, the “MSCI Parties”) expressly disclaims all warranties (including, without limitation, any warranties of originality, accuracy, completeness, timeliness, non-infringement, merchantability and fitness for a particular purpose) with respect to this information. Without limiting any of the foregoing, in no event shall any MSCI Party have any liability for any direct, indirect, special, incidental, punitive, consequential (including, without limitation, lost profits) or any other damages. (www.msci.com)
Capital believes the software and information from FactSet to be reliable. However, Capital cannot be responsible for inaccuracies, incomplete information or updating of the information furnished by FactSet. The information provided in this report is meant to give you an approximate account of the fund/manager's characteristics for the specified date. This information is not indicative of future Capital investment decisions and is not used as part of our investment decision-making process.
Indices are unmanaged and cannot be invested in directly. Returns represent past performance, are not a guarantee of future performance, and are not indicative of any specific investment.
All Capital Group trademarks are owned by The Capital Group Companies, Inc. or an affiliated company in Canada, the U.S. and other countries. All other company names mentioned are the property of their respective companies.
Capital Group funds are offered in Canada by Capital International Asset Management (Canada), Inc., part of Capital Group, a global investment management firm originating in Los Angeles, California in 1931. Capital Group manages equity assets through three investment groups. These groups make investment and proxy voting decisions independently. Fixed income investment professionals provide fixed income research and investment management across the Capital organization; however, for securities with equity characteristics, they act solely on behalf of one of the three equity investment groups.
The Capital Group funds offered on this website are available only to Canadian residents.