Economic Indicators
Categories
Global Equities
4 trends could power an industrial renaissance
 Gigi Pardasani
 Dominic Phillips
 Andrew Suzman
January 19, 2023
Weighing in at 1.37 million pounds and with tires twice the height of a grown man, Caterpillar’s 797 trucks are a sight to behold.
On a recent research trip, members of Capital Group’s investment team watched firsthand as a 797 hauled tons of material from an oil sand field in northern Alberta, Canada, to be processed into oil.
You won’t likely glimpse one of these massive vehicles on the road. But many more such trucks may soon be rolling off the assembly line amid rising demand for new sources of energy and rare minerals to produce batteries for electric vehicles and power storage operations.

The race to find new energy sources is one of four major trends reshaping the world’s economies and markets: Energy transition in the U.S., energy security in Europe, reshoring supply chains and rising defence spending. These multi-year trends are setting the stage for a capital investment super-cycle that could drive opportunity for a wide range of industrial companies, lower U.S. energy costs and help revive American manufacturing.
“Well-positioned industrial companies — from capital equipment suppliers to aerospace and defense companies — are enablers of these trends, and leading companies across many of these industries may be poised for a period of sustained growth,” says equity investment analyst Gigi Pardasani, who covers U.S. large-cap industrials.
Here, Pardasani, equity portfolio manager Andrew Suzman and equity analyst Dominic Phillips share their perspective on the potential for a coming industrial renaissance.
1. Powering the U.S. energy transition
Growth in renewable energy has been an investment theme for at least a decade, thanks to the declining cost of renewable power. Last year renewable energy surpassed coal power in the U.S., with wind, solar and hydropower generating 22% of the country’s electricity.
With the Inflation Reduction Act of 2022 and the Infrastructure and Investment Jobs Act enacted in 2021, the U.S. federal government has dedicated hundreds of billions of dollars in tax and fiscal incentives for infrastructure and expansion of a U.S. renewable energy industry.
“We think about renewable energy a lot in terms of the electric car, but power consumption in factories and businesses is a huge piece of that transition,” says Phillips, an equity investment analyst who covers U.S. technology systems, utilities and renewables. “Today, the transition to renewables makes economic sense for energy companies, consumers and the broader U.S. economy. And these incentives provide investors long-term visibility into a declining cost curve and capital expenditure (capex) spending growth.”
The U.S. has committed billions for infrastructure and renewable energy
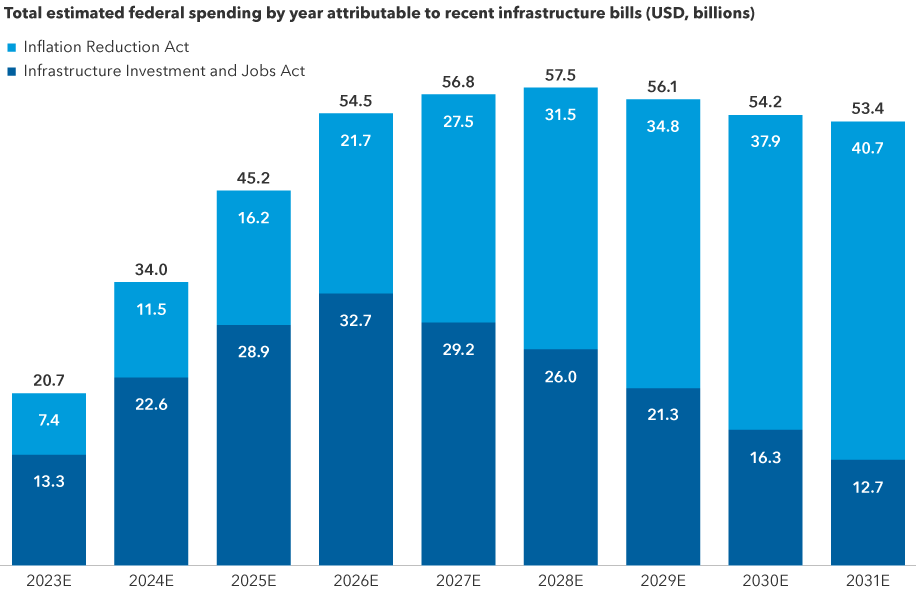
Sources: Capital Group, Congressional Budget Office (CBO). Figures above reflect total estimated federal outlays from the CBO as compiled by Capital Group. Totals may not add up due to rounding. CBO estimates for both bills are as of August 2022.
These laws provide funding to modernize the power grid, build high voltage transmission lines and mine the rare minerals needed to manufacture batteries for storing variable energy sources like wind and solar. “Collectively these steps will generate potential demand for a range of electrical equipment makers, as well as industrial conglomerates that offer a wide range of services and developers of advanced battery energy storage systems,” says Pardasani.
What is still underappreciated, though, is just how transformative this ultimately could be for U.S. manufacturing and the broader economy.
Unlike coal or natural gas, renewables like wind and solar power have essentially zero variable costs. “Once you build out the infrastructure, there's only some small maintenance costs attached to it,” explains Phillips. “This could effectively collapse the price of power in the U.S. and provide a major competitive advantage to a wide range of manufacturers from steel to textiles to consumer goods to chemicals.”
This in turn could have a positive impact on U.S. GDP growth. The potential collapse in power prices represents a huge productivity jump, according to Pardasani. “That’s because power is the number one fixed-cost input to a manufacturer, to oil and gas extraction, and to metals and mining,” she says. “Paying potentially 90% lower power costs will enable massive productivity and margin gains that can be recycled into higher wages and more capital investments. I can see ‘Made in the USA’ becoming a byword for growth again.”
2. Seeking energy security in Europe
Europe has been ahead of the U.S. in transitioning to renewable energy, but now faces the challenge of securing its supply amid the war in Ukraine, as Russia has effectively cut off oil and gas to Europe. “Today, we are in a global energy crisis, and it is most acutely felt in Europe,” says Phillips.
The result has been a renewed focus on energy security. Countries in Europe are seeking to rely less on unstable regimes and seek out other sources.
Liquid natural gas producers could be clear beneficiaries of this sea change — particularly U.S.-based liquefied natural gas (LNG) companies, which are among the lowest cost producers in the world.
Cheniere Energy, for example, recently announced it will spend US$8 billion over the next three years to expand its massive LNG facility in Corpus Christi, Texas. More than 70% of Cheniere’s supplies are now headed for Europe, up from roughly 40% a year ago. “Many countries have come to realize that their national security depends on stable energy streams,” says equity portfolio manager Andrew Suzman, “It’s going to have a lot of implications for the energy sector as well as the industrial companies needed to build the infrastructure.”
For example, Caterpillar makes pipelayers and other materials used to help transport natural gas from its source to a facility and ultimately offshore. “The company offers machinery and vehicles that can help with both energy security needs and the energy transition,” says Pardasani.
3. Reshoring supply chains
Just as many countries are seeking greater security in their energy supply, many companies are improving the security of their supply chains by rebuilding them closer to home and end markets.
Decades of globalization to maximize efficiency and minimize cost left many companies exposed to broken supply chains caused by COVID lockdowns and rising geopolitical tensions between the U.S. and China.
Companies across a range of industrial sectors could participate in an infrastructure build-out
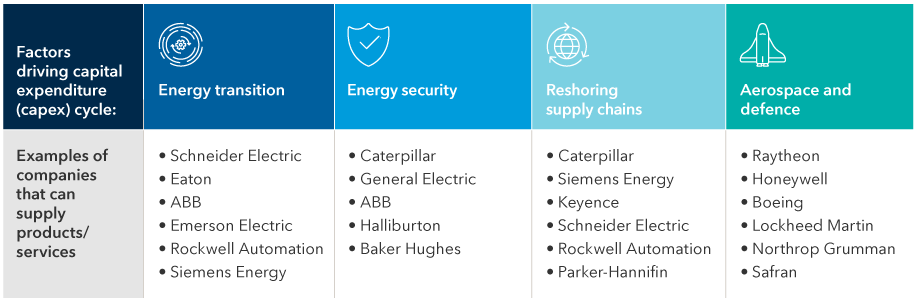
Sources: Capital Group, The Global Industry Classification Standard (GICS), MSCI. Company examples reflect some of the largest constituents (ranked by descending market value) within the MSCI All Country World Index that fall into GICS sub-industries that supply products and/or services aligned with the factors expected to contribute to capital expenditures listed above. As of 1/17/23.
The pandemic served as a wake-up call, as government shutdowns resulted in snarled supply chains that lasted well beyond the reopening of economies. Companies began to recognize the importance of more local suppliers as well as the wisdom of sacrificing maximum efficiency in favor of some redundancy in case of future breakdowns.
“Manufacturers realized that they needed more resilience, which is to say visibility into their supply chain, the flexibility to change over the types of production and remote monitoring,” Pardasani says. “Resilience also means backup plans in case something happens to the facility, a supplier or employees.”
In January, Korean solar panel company Hanwha Q CELLS disclosed plans to construct a US$2.5 billion manufacturing complex in Georgia. And last December Taiwan Semiconductor Manufacturing Company (TSMC) disclosed plans to spend US$12 billion to build a second chip factory in Arizona, scheduled to be in operation in 2024. TSMC is also building a semiconductor plant in Japan and has plans to make infrastructure investments in Europe
Intel is building a research facility near Plateau de Saclay, France. The company had disclosed that France will become its European headquarters for high performance computing and artificial intelligence design. And Europe itself has recently opened LNG terminals on Germany’s north coast to receive imports from the U.S. and elsewhere.
As companies build new factories, they seek to offset some of those costs by adopting the latest and most efficient technology. For example, Japanese industrial company Keyence develops automation sensors, vision systems and measuring instruments for a range of manufacturing operations, and SMC produces pneumatic and electric automation equipment.
In the U.S., Rockwell Automation provides controls, software and automation equipment for a wide range of factories, including many automakers. “Rockwell has a particular presence in solar energy,” Pardasani says. “So they’re seeking to do for solar what they’ve already done for the auto industry.”
4. Rising defence spending
In addition to driving the need for reshoring supply chains, geopolitical tensions are fueling an increase in defence spending around the world. The war in Ukraine underscores a trend that has been growing for years. Several major developed nations, including Germany, Japan and others, have disclosed plans to significantly increase defence budgets.
The U.S. continues to take steps to help its allies in Europe and Asia defend themselves. The Biden administration recently asked Congress for approval to sell US$20 billion in F-16 fighter jets to Turkey and sought approval for a similar deal to sell F-35 fighters to Greece. In December, Raytheon Technologies began supplying Ukraine and other European nations with defence equipment.
“We are living in a world with heightened geopolitical tensions,” says Suzman. “While this is unfortunate, it presents opportunity for well-managed defence contractors. I believe we will see defence budgets rise from here.”
Of course, not all defence companies are equal, nor will all necessarily benefit — the key is to understand which have the most effective innovations, are best positioned to execute on their business plans and overcome challenges like supply chain issues.
Defence spending is on the rise amid growing global tensions
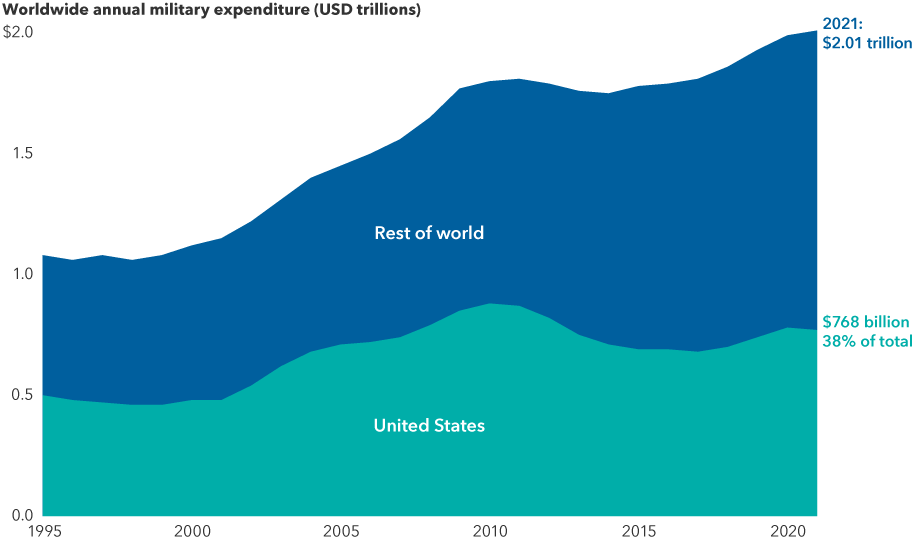
Sources: Capital Group, Stockholm International Peace Research Institute (SIPRI). Worldwide defence spending estimates are from SIPRI and are expressed in constant U.S. dollars, indexed to 2020. As of December 31, 2021.
Bottom line: a rising capex tide could lift many ships
“In stark contrast to a lot of the gloom in news headlines, I view this as a time for optimism and excitement for industrials, even if there is a recession,” says Pardasani.
Arguably, industrials have already been through recession. “While the digital and service sectors thrived post pandemic, companies that produce hard assets have been in crisis with lockdowns, trouble retaining employees, skyrocketing costs and supply chain woes,” adds Pardasani. “Today, many of the best-positioned companies are attractively valued and stand to benefit from a period of strong growth.”
Rising capital spending could spark an industrial renaissance
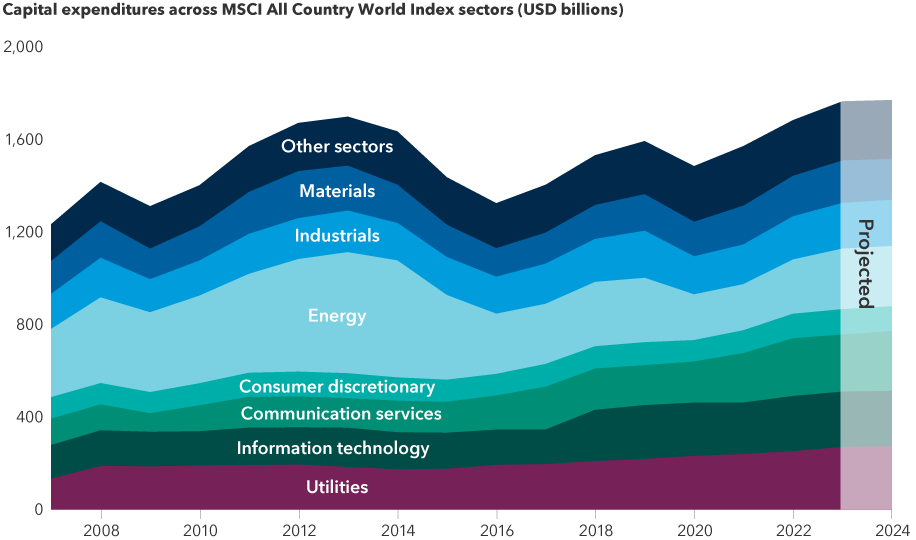
Sources: Capital Group, FactSet, MSCI. In current U.S. dollars. All figures represent estimates from FactSet, including projected figures for 2023–2024, as of January 10, 2023. "Other sectors" above include combined estimated capital expenditures across consumer staples, health care, real estate and financials.
The potential long-term benefits reach beyond the industrials sector. Nimble companies across power generation, metals and mining, energy and manufacturing that make the right investments could enjoy a sustained growth cycle.
“For more than a decade, as investors focused on technology and digital consumer businesses, companies often viewed major capital investment initiatives as a negative, but you can’t build the new economy without old industries,” stresses Pardasani. “Many people may be underestimating the potential of large-scale capital expenditures today to drive profit growth for years to come.”
Learn more about
MSCI All Country World Index (ACWI) is a free float-adjusted market capitalization-weighted index designed to measure equity market results in the global developed and emerging markets, consisting of more than 40 developed and emerging market country indexes. The index is unmanaged and, therefore, has no expenses. Investors cannot invest directly in an index.
Our latest insights
-
-
-
Long-Term Investing
-
Long-Term Investing
-
RELATED INSIGHTS
-
Economic Indicators
-
-
Long-Term Investing
Commissions, trailing commissions, management fees and expenses all may be associated with investments in investment funds. Please read the prospectus before investing. Investment funds are not guaranteed or covered by the Canada Deposit Insurance Corporation or by any other government deposit insurer. For investment funds other than money market funds, their values change frequently. For money market funds, there can be no assurances that the fund will be able to maintain its net asset value per security at a constant amount or that the full amount of your investment in the fund will be returned to you. Past performance may not be repeated.
Unless otherwise indicated, the investment professionals featured do not manage Capital Group‘s Canadian mutual funds.
References to particular companies or securities, if any, are included for informational or illustrative purposes only and should not be considered as an endorsement by Capital Group. Views expressed regarding a particular company, security, industry or market sector should not be considered an indication of trading intent of any investment funds or current holdings of any investment funds. These views should not be considered as investment advice nor should they be considered a recommendation to buy or sell.
Statements attributed to an individual represent the opinions of that individual as of the date published and do not necessarily reflect the opinions of Capital Group or its affiliates. This information is intended to highlight issues and not be comprehensive or to provide advice. For informational purposes only; not intended to provide tax, legal or financial advice. We assume no liability for any inaccurate, delayed or incomplete information, nor for any actions taken in reliance thereon. The information contained herein has been supplied without verification by us and may be subject to change. Capital Group funds are available in Canada through registered dealers. For more information, please consult your financial and tax advisors for your individual situation.
Forward-looking statements are not guarantees of future performance, and actual events and results could differ materially from those expressed or implied in any forward-looking statements made herein. We encourage you to consider these and other factors carefully before making any investment decisions and we urge you to avoid placing undue reliance on forward-looking statements.
The S&P 500 Composite Index (“Index”) is a product of S&P Dow Jones Indices LLC and/or its affiliates and has been licensed for use by Capital Group. Copyright © 2024 S&P Dow Jones Indices LLC, a division of S&P Global, and/or its affiliates. All rights reserved. Redistribution or reproduction in whole or in part are prohibited without written permission of S&P Dow Jones Indices LLC.
FTSE source: London Stock Exchange Group plc and its group undertakings (collectively, the "LSE Group"). © LSE Group 2024. FTSE Russell is a trading name of certain of the LSE Group companies. "FTSE®" is a trade mark of the relevant LSE Group companies and is used by any other LSE Group company under licence. All rights in the FTSE Russell indices or data vest in the relevant LSE Group company which owns the index or the data. Neither LSE Group nor its licensors accept any liability for any errors or omissions in the indices or data and no party may rely on any indices or data contained in this communication. No further distribution of data from the LSE Group is permitted without the relevant LSE Group company's express written consent. The LSE Group does not promote, sponsor or endorse the content of this communication. The index is unmanaged and cannot be invested in directly.
BLOOMBERG® is a trademark and service mark of Bloomberg Finance L.P. and its affiliates (collectively “Bloomberg”). Bloomberg or Bloomberg’s licensors own all proprietary rights in the Bloomberg Indices. Neither Bloomberg nor Bloomberg’s licensors approves or endorses this material, or guarantees the accuracy or completeness of any information herein, or makes any warranty, express or implied, as to the results to be obtained therefrom and, to the maximum extent allowed by law, neither shall have any liability or responsibility for injury or damages arising in connection therewith.
MSCI does not approve, review or produce reports published on this site, makes no express or implied warranties or representations and is not liable whatsoever for any data represented. You may not redistribute MSCI data or use it as a basis for other indices or investment products.
Capital believes the software and information from FactSet to be reliable. However, Capital cannot be responsible for inaccuracies, incomplete information or updating of the information furnished by FactSet. The information provided in this report is meant to give you an approximate account of the fund/manager's characteristics for the specified date. This information is not indicative of future Capital investment decisions and is not used as part of our investment decision-making process.
Indices are unmanaged and cannot be invested in directly. Returns represent past performance, are not a guarantee of future performance, and are not indicative of any specific investment.
All Capital Group trademarks are owned by The Capital Group Companies, Inc. or an affiliated company in Canada, the U.S. and other countries. All other company names mentioned are the property of their respective companies.
Capital Group funds are offered in Canada by Capital International Asset Management (Canada), Inc., part of Capital Group, a global investment management firm originating in Los Angeles, California in 1931. Capital Group manages equity assets through three investment groups. These groups make investment and proxy voting decisions independently. Fixed income investment professionals provide fixed income research and investment management across the Capital organization; however, for securities with equity characteristics, they act solely on behalf of one of the three equity investment groups.
The Capital Group funds offered on this website are available only to Canadian residents.