Artificial Intelligence
Categories
International
International markets outlook for 2023
 Gerald Du Manoir
 Jens Søndergaard
 Lisa Thompson
November 30, 2022
There’s no doubt investors have been frustrated in recent years with the persistent lagging returns of international equities. A strong U.S. dollar, the war in Ukraine, weak economies in Europe and Japan, and various troubles in emerging markets have created a cloudy near-term outlook at best.
That said, avoiding international markets would mean ignoring some of the most successful companies in the world, simply because they lie beyond North America.
Even if you think economies outside Canada and the U.S. are headed for more trouble, there are still important reasons to consider investing in international and emerging markets companies. Here are the top five:
1. International investing is about companies, not economies.
There’s a big difference between top-down macroeconomic conditions and fundamental, bottom-up prospects for individual companies. More than ever, company-specific events are driving returns, placing added importance on deep investment research and individual stock picking.
For many multinational companies headquartered in economically struggling areas, local conditions may have little or no impact on revenues, except when it comes to regulation and taxation, explains Gerald Du Manoir, a portfolio manager with Capital Group International Equity FundTM (Canada).
“In Europe, for example, interest in Airbus has a lot to do with demand for airplanes in the U.S. and China,” Du Manoir says. “Interest in LVMH has a lot to do with U.S. consumer demand for luxury goods.
“In emerging markets,” he adds, “interest in Taiwan Semiconductor Manufacturing Company (TSMC) has a lot to do with global demand for computer chips. Granted, the outlook for some economies doesn’t look too compelling, but I feel confident that we can still find promising companies in Europe, Japan and emerging markets.”
Company-specific factors have had a large and growing impact on returns
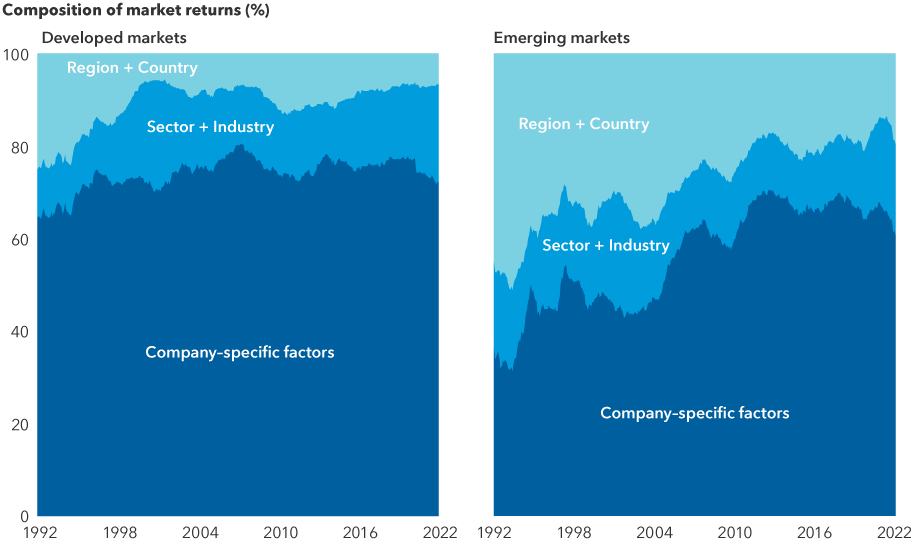
Source: Empirical Research Partners. As of 9/30/22. Analysis provided by Empirical Research Partners using their developed market and emerging market stock universes that approximate the MSCI World Index and MSCI Emerging Markets Index, respectively. Data shows the percentage of market returns (in USD) that can be attributed to various factors over time, using a two-year smoothed average. Past results are not predictive of results in future periods.
For example: France-based Airbus is on track to deliver 700 commercial aircraft this year, about 200 more than U.S. rival Boeing. In October, France’s LVMH reported a 27% increase in third-quarter revenue, largely driven by U.S. tourists buying luxury handbags and jewelry at a discount as the euro fell against the dollar. Taiwan-based TSMC, the world’s largest chip maker, recently announced a multibillion-dollar expansion of its manufacturing capabilities in Arizona, capitalizing on U.S. government grants aimed at bringing the chip industry back to America.
“These are global companies generating revenue all over the world,” Du Manoir says.
2. The strong U.S. dollar won’t last forever.
One of the headwinds to investing overseas has been the strong U.S. dollar, which dampens returns based in other currencies when they are converted into USD. The greenback has soared in recent years due to the relative strength of the U.S. economy, generally higher interest rates in the U.S. and the dollar’s perceived safe-haven status. U.S. dollar strength has accelerated this year as the Federal Reserve has aggressively raised rates in a bid to tame inflation.
These conditions won’t last forever, says Capital Group currencies analyst Jens Søndergaard, who estimates the dollar is overvalued by about 20% compared to a basket of other foreign currencies. While there is no indication yet that the dollar has peaked, all eyes are on the Fed.
“Once the Fed stops raising rates, and perhaps starts cutting again, the stage could be set for a reversal of the dollar dominance we’ve seen over the past decade,” Søndergaard says. “As the global economy picks up steam, procyclical currencies should benefit, and that may also provide a more supportive environment for international equities.”
In the meantime, keep in mind that a strong U.S. dollar isn’t always bad for non-U.S. companies. Many European companies earn a substantial portion of their total revenue in dollars. In the health care sector, for example, French drugmaker Sanofi reported that currency effects boosted its sales by nearly 1 billion euros in the first half of 2022.
Many non-U.S. companies generate substantial USD-based revenue
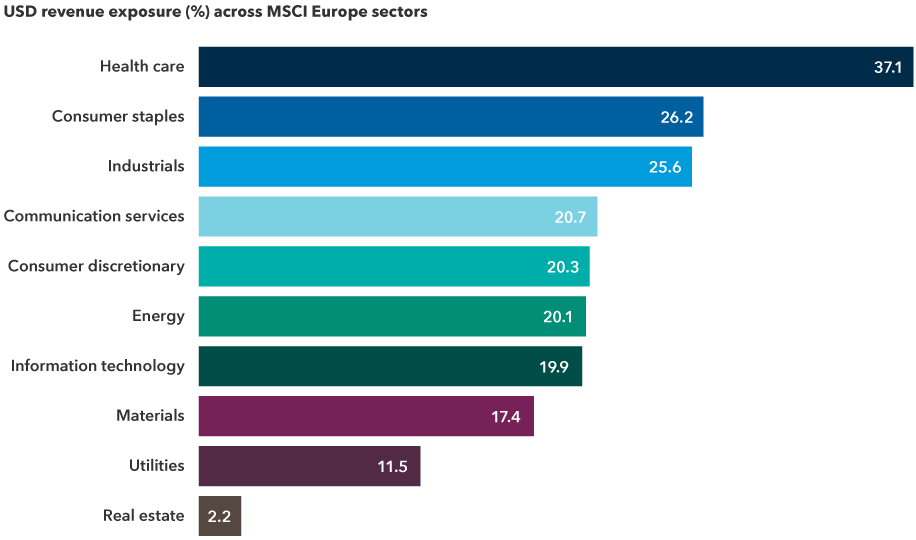
Sources: Capital Group, FactSet, Refinitiv Datastream. Revenue exposure above reflects the weighted average of the percentage of revenue generated in the United States across each index's respective constituents. Constituent lists are current as of August 23, 2022; company-level revenue exposure is estimated by FactSet and is current as of January 2022.
3. Dividend opportunities are greater outside the U.S.
Over the past decade, investors spent little time thinking about dividends. Compared to the darlings of the internet, dividend-paying companies appeared downright boring. Well, in today’s more volatile markets, boring is beautiful, says Caroline Randall, a portfolio manager with Capital Group Capital Income BuilderTM (Canada).
Nowhere is that sentiment more rooted than in markets outside the U.S., where dividends have historically made up a bigger part of the investment landscape. As of November 30, 2022, more than 580 companies headquartered in international and emerging markets offered hefty dividend yields between 3% and 6%, compared to only 110 in the United States (and 34 in Canada).
“With growth slowing, the cost of capital rising and valuations for less profitable tech companies declining, I expect dividends to be a more significant and stable contributor to total returns,” Randall adds. “They may also offer a measure of downside protection when volatility rises.”
Dividend payers multiply in international and emerging markets
.png)
Sources: Capital Group, MSCI, RIMES. As of 11/30/22. Company examples represent the three largest companies in each region with yields between 3% and 6%.
Non-U.S. companies that have paid steady and above-market dividends can be found across sectors, including financials, consumer staples, health care and materials. Examples include Zurich Insurance, British American Tobacco, drug maker Novartis and mining company Rio Tinto.
4. The new economy depends on old industries.
As digitally focused, e-commerce and social media companies struggle in the market downturn, investors are refocusing on old economy companies that are necessary to meet the aspirations of the new economy. Many companies in the materials, financials and industrials sectors are based outside the U.S., while technology and health care sectors are more prevalent inside the U.S.
This has been a key driver of the divergence between U.S. and non-U.S. stock returns over the past decade, fueling the dominance of U.S. tech-related companies. While there may yet be more growth to come in that area, it is certainly more mature than a decade ago.
Old economy companies play a larger role in markets outside the U.S.
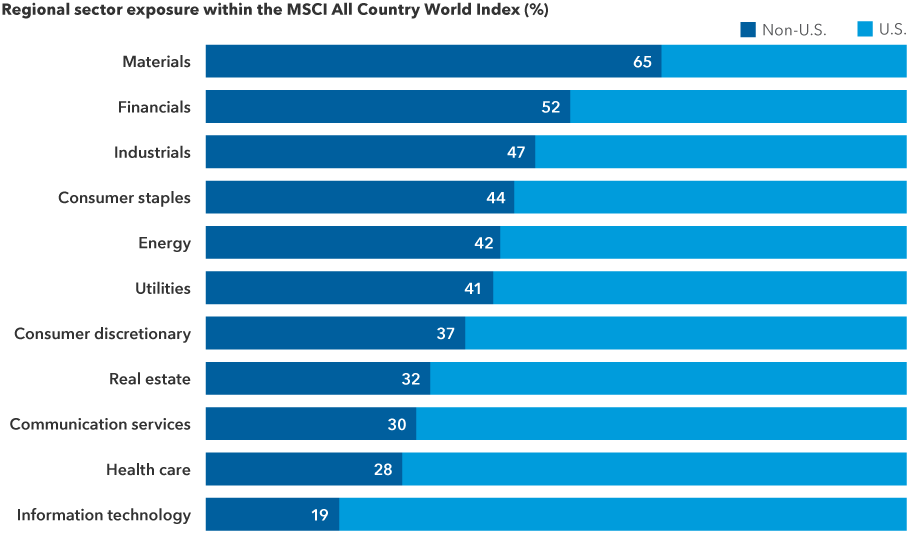
Sources: Capital Group, MSCI, RIMES. As of 10/31/22.
Investors looking to diversify from the areas that led the last bull market may want to consider going outside the U.S., where valuations tend to be lower and solid research can uncover overlooked or long-neglected gems, says equity portfolio manager Lisa Thompson.
“I am generally staying away from the cool kids of the last decade and looking for opportunities among the unpopular kids,” she says, noting that Europe, Japan and Latin America are good places to search for them.
“Many U.S. companies benefited greatly from globalization and a low cost of capital,” Thompson explains. “So — and I believe they are — then I think that bodes well for companies in other markets that haven’t benefited as much, or at all, from the prevailing trends of the past decade.”
5. Not all the best stocks are in the U.S., by a long shot.
Over the past 10 years, at a time when U.S. tech stocks were getting all the attention for their high returns, there was one fact many investors overlooked: The top 50 companies with the best annual returns each year were overwhelmingly based outside the United States.
Don’t believe it? Check out the chart.
77% of the top-returning stocks since 2013 were based outside the U.S.
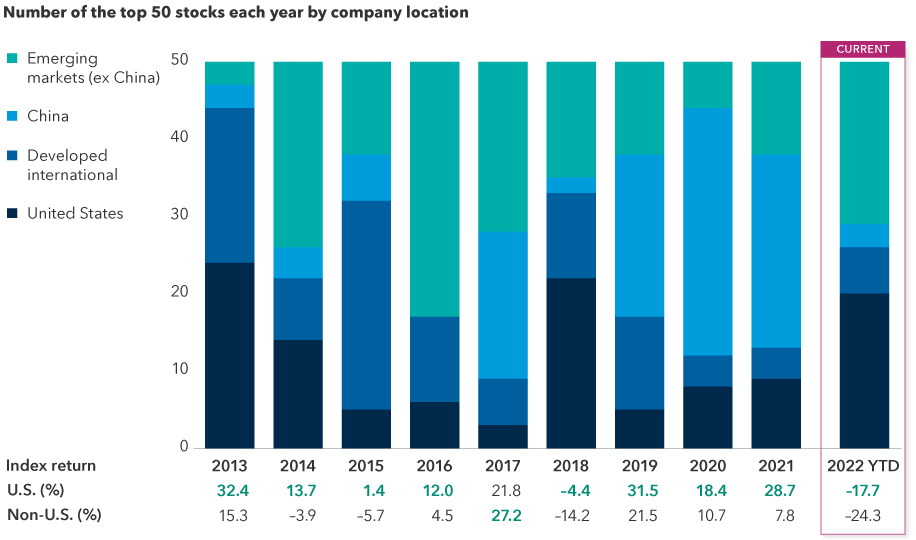
Sources: MSCI, RIMES. 2022 data is year to date as of 10/31/22. Returns are in USD. Top 50 stocks are the companies with the highest total return in the MSCI ACWI each year. Returns table uses S&P 500 and MSCI ACWI ex USA indices for U.S. and non-U.S., respectively.
While it’s true that international equities generally have lagged U.S. markets over that same time period, the index-based returns that most investors follow don’t tell the whole story. On a company-by-company basis, the picture is significantly different. If you had decided to ignore European, Asian and other non-U.S. stocks, you would have missed many of the best opportunities.
Looking at the data in this context provides an important reminder of the benefits of maintaining a balanced, well-diversified portfolio and following a flexible investment approach.
It remains to be seen how the current decade will shape up, but it’s possible that one long-term trend will continue: On a company-by-company basis, the best annual returns each year have primarily been generated by stocks found outside the U.S. — supporting the view that the world is a stock picker’s market that often favours borderless investing.
Learn more about
MSCI ACWI is a free float-adjusted market capitalization-weighted index that is designed to measure equity market results in the global developed and emerging markets, consisting of more than 40 developed and emerging market country indexes.
MSCI ACWI ex USA Index is a free float-adjusted market capitalization-weighted index that is designed to measure equity market results in the global developed and emerging markets, excluding the United States. The index consists of more than 40 developed and emerging market country indexes.
MSCI World Index is a free float-adjusted market capitalization-weighted index designed to measure equity market results of developed markets. The index consists of more than 20 developed market country indexes, including the United States.
MSCI Emerging Markets Index captures large- and mid-cap representation across 27 emerging markets (EM) countries.
MSCI Europe Index is designed to measure developed equity market results across 15 developed countries in Europe.
The S&P 500 Index is a market capitalization-weighted index based on the results of approximately 500 widely held common stocks.
Explore the 2023 Outlook
Get the 2023 Outlook report
Our latest insights
-
-
Demographics & Culture
-
-
-
Global Equities
RELATED INSIGHTS
Commissions, trailing commissions, management fees and expenses all may be associated with investments in investment funds. Please read the prospectus before investing. Investment funds are not guaranteed or covered by the Canada Deposit Insurance Corporation or by any other government deposit insurer. For investment funds other than money market funds, their values change frequently. For money market funds, there can be no assurances that the fund will be able to maintain its net asset value per security at a constant amount or that the full amount of your investment in the fund will be returned to you. Past performance may not be repeated.
Unless otherwise indicated, the investment professionals featured do not manage Capital Group‘s Canadian mutual funds.
References to particular companies or securities, if any, are included for informational or illustrative purposes only and should not be considered as an endorsement by Capital Group. Views expressed regarding a particular company, security, industry or market sector should not be considered an indication of trading intent of any investment funds or current holdings of any investment funds. These views should not be considered as investment advice nor should they be considered a recommendation to buy or sell.
Statements attributed to an individual represent the opinions of that individual as of the date published and do not necessarily reflect the opinions of Capital Group or its affiliates. This information is intended to highlight issues and not be comprehensive or to provide advice. For informational purposes only; not intended to provide tax, legal or financial advice. We assume no liability for any inaccurate, delayed or incomplete information, nor for any actions taken in reliance thereon. The information contained herein has been supplied without verification by us and may be subject to change. Capital Group funds are available in Canada through registered dealers. For more information, please consult your financial and tax advisors for your individual situation.
Forward-looking statements are not guarantees of future performance, and actual events and results could differ materially from those expressed or implied in any forward-looking statements made herein. We encourage you to consider these and other factors carefully before making any investment decisions and we urge you to avoid placing undue reliance on forward-looking statements.
The S&P 500 Composite Index (“Index”) is a product of S&P Dow Jones Indices LLC and/or its affiliates and has been licensed for use by Capital Group. Copyright © 2024 S&P Dow Jones Indices LLC, a division of S&P Global, and/or its affiliates. All rights reserved. Redistribution or reproduction in whole or in part are prohibited without written permission of S&P Dow Jones Indices LLC.
FTSE source: London Stock Exchange Group plc and its group undertakings (collectively, the "LSE Group"). © LSE Group 2024. FTSE Russell is a trading name of certain of the LSE Group companies. "FTSE®" is a trade mark of the relevant LSE Group companies and is used by any other LSE Group company under licence. All rights in the FTSE Russell indices or data vest in the relevant LSE Group company which owns the index or the data. Neither LSE Group nor its licensors accept any liability for any errors or omissions in the indices or data and no party may rely on any indices or data contained in this communication. No further distribution of data from the LSE Group is permitted without the relevant LSE Group company's express written consent. The LSE Group does not promote, sponsor or endorse the content of this communication. The index is unmanaged and cannot be invested in directly.
BLOOMBERG® is a trademark and service mark of Bloomberg Finance L.P. and its affiliates (collectively “Bloomberg”). Bloomberg or Bloomberg’s licensors own all proprietary rights in the Bloomberg Indices. Neither Bloomberg nor Bloomberg’s licensors approves or endorses this material, or guarantees the accuracy or completeness of any information herein, or makes any warranty, express or implied, as to the results to be obtained therefrom and, to the maximum extent allowed by law, neither shall have any liability or responsibility for injury or damages arising in connection therewith.
MSCI does not approve, review or produce reports published on this site, makes no express or implied warranties or representations and is not liable whatsoever for any data represented. You may not redistribute MSCI data or use it as a basis for other indices or investment products.
Capital believes the software and information from FactSet to be reliable. However, Capital cannot be responsible for inaccuracies, incomplete information or updating of the information furnished by FactSet. The information provided in this report is meant to give you an approximate account of the fund/manager's characteristics for the specified date. This information is not indicative of future Capital investment decisions and is not used as part of our investment decision-making process.
Indices are unmanaged and cannot be invested in directly. Returns represent past performance, are not a guarantee of future performance, and are not indicative of any specific investment.
All Capital Group trademarks are owned by The Capital Group Companies, Inc. or an affiliated company in Canada, the U.S. and other countries. All other company names mentioned are the property of their respective companies.
Capital Group funds are offered in Canada by Capital International Asset Management (Canada), Inc., part of Capital Group, a global investment management firm originating in Los Angeles, California in 1931. Capital Group manages equity assets through three investment groups. These groups make investment and proxy voting decisions independently. Fixed income investment professionals provide fixed income research and investment management across the Capital organization; however, for securities with equity characteristics, they act solely on behalf of one of the three equity investment groups.
The Capital Group funds offered on this website are available only to Canadian residents.