Long-Term Investing
 Jody Jonsson
 Martin Romo
There’s a new reality taking shape that could define global markets over the next decade.
Although many investors are expecting a return to normal after inflation subsides and central banks stop raising interest rates, we believe markets are undergoing significant changes. Investors may need to reset expectations in this new environment.
One change that’s already underway is the shift from narrow to broad market leadership. A handful of tech stocks dominated markets for years, but we expect a much wider range of investments to drive portfolio returns going forward. That’s why we asked our investment team to highlight the trends they are most closely following today.
Here are 10 investment themes for 2023:
1. Dividend stocks could power portfolios for the next decade
2. Growth investing will require a new approach
3. Nimble multinational companies are becoming global champions
4. Innovation is leading to a golden age of health care
5. Industrial renaissance could benefit pick-and-shovel companies
6. Reshoring supply chains will create new opportunities across industries
7. Core bonds can provide strength when equities are weak
8. Credit fundamentals are making a comeback
9. High-yield bonds are earning their name again
10. 60/40 portfolios are alive and well
1. Dividend stocks could power portfolios for the next decade
Caroline Randall, equity portfolio manager, Capital Group Capital Income Builder™ (Canada)
Dividend investing may have seemed downright dull over the last decade as tech titans dominated market returns, but today, boring is beautiful.
With growth slowing and the cost of capital rising, I expect dividends to be a more significant and stable contributor to total return going forward. Dividends accounted for only 16% of total return in the 2010s, but historically the average has hovered around 38%, peaking at 72% during the inflationary 1970s.
Expect dividends to account for a larger portion of total return

Source: S&P Dow Jones Indices LLC. 2020s data is from 1/1/20 through 12/31/22. *Total return for the S&P 500 Index was negative for the 2000s. Dividends provided a 1.8% annualized return over the decade. Past results are not predictive of results in future periods. Returns are in USD.
I’m finding many dividend opportunities across sectors, including industrials, utilities and health care. Pharmaceutical companies can be attractive in an inflationary environment, as many tend to have strong balance sheets and cash flows and are often able to raise prices even in a highly competitive marketplace. Several leading companies also have a dividend yield above 3%, including AbbVie (3.7% yield, as of December 31, 2022) and Gilead Sciences (3.4%).
Go deeper:
- Dividends: Building resilience in a new market reality
- U.S. market outlook for 2023
2. Growth investing will require a new approach
Martin Romo, equity portfolio manager, Capital Group U.S. Equity Fund™ (Canada)
Growth stocks have come under intense pressure, but for some companies I think the market is throwing the baby out with the bathwater.
As a growth investor, it’s essential to differentiate between companies that have reached the end of their runway or are facing stiffer competition with those that are simply in a cyclical slowdown. If you can find companies set to re-accelerate when the economy improves, you may find promising buying opportunities.
The pace of innovation around the world is picking up again. Several colleagues and I recently spent a few weeks in Silicon Valley meeting with public companies and venture capital firms, and I came away believing we are at an inflection point with artificial intelligence. Microsoft’s US$10 billion investment in ChatGPT creator OpenAI is a recent example, but the push to develop innovative uses of AI is happening all around.
The pace of adoption of new technologies is accelerating

Source: Statista. As of 12/31/22. Kickstarter refers to number of backers. Airbnb refers to number of nights booked. Foursquare and Instagram refer to number of downloads.
This feels like the early days of mobile and cloud as they entered an era of hyper-charged growth. It’s an open-ended opportunity for companies that can leverage the technology to genuinely differentiate their product offerings and deliver enhanced productivity to customers. Despite the challenging environment, I remain excited about the long-term investment opportunities on the horizon.
Go deeper:
- New reality for investors: 5 big trends changing markets
3. Nimble multinational companies are becoming global champions
Jody Jonsson, equity portfolio manager
It may seem like a challenging time to be a global investor, but I think this is when the best companies shine.
Investors are concerned about de-globalization and assume it is negative for portfolios. It can be, but changes in trade patterns generally favour global champions — what I call industry-leading multinationals that can adjust to the changing landscape. The COVID-19 crisis shed light on the importance of resilience over efficiency, and companies are responding by establishing redundancies in supply chains. That’s creating opportunities for companies that help build factories and expand supply lines.
For example, Taiwan Semiconductor Manufacturing Company, the largest pure-play semiconductor maker, plans to build factories in Arizona and Japan and anticipates nearly half of its leading-edge chip production will happen outside of Taiwan in the years ahead. As new facilities are built, Caterpillar, the world’s largest manufacturer of construction equipment, could see increased demand for its products.
A new breed of multinational companies has arrived

Sources: Capital Group, FactSet, RIMES. Includes all companies within the MSCI ACWI IMI as of 1/31/03 and 12/31/22. Top eight countries as of 12/31/22 are shown.
Global stocks should also benefit as two notable headwinds dissipate. It appears that the strong U.S. dollar may have peaked, which would support dollar-based returns of U.S. and international stocks alike. Also, the reopening of China’s economy should boost global economic growth, especially in emerging markets.
In the portfolios that I manage, I focus primarily on “supertankers” — dominant companies that generate solid cash flow, enjoy strong competitive moats and have the ability to fund their own growth — in industries such as health care, semiconductors and insurance.
Go deeper:
- International markets outlook for 2023
- 5 keys to investing in 2023
4. Innovation is leading to a golden age of health care
Diana Wagner, equity portfolio manager
Innovation is at an all-time high in health care. The macro environment may have topped investor concerns over the last year, but innovation is what has ultimately driven long-term value creation.
Pharmaceutical companies have invested heavily in drug discovery in recent years and, as a result, deep pipelines of pioneering treatments are being developed to tackle some of the world’s biggest health issues. Eli Lilly and Novo Nordisk, for example, have developed obesity treatments with the potential to reduce body weight by as much as 25%. AstraZeneca has become an oncology leader with advanced therapies for lung, bladder and breast cancer.
Gene sequencing is another key innovation with major health and investment implications. In the future, we may be able to pair genetic sequencing with gene-based interventions to deliver personalized, precision medicine. Imagine replacing defective or missing genes with normal, healthy ones. That future is not far off, in my view.
I find opportunities in health care services equally exciting. Most doctors in the U.S. operate in a traditional fee-for-service model, getting paid based on volume. But companies like UnitedHealth and Humana are instead rewarding doctors for keeping patients heathy through new payment models. These models seek to achieve the so-called “quadruple aim” in health care — better outcomes, higher patient satisfaction and higher physician satisfaction at a lower cost per capita. Achieving all four is now a real possibility.
Go deeper:
- 4 reasons health care could lead the next bull market
5. Industrial renaissance could benefit pick-and-shovel companies
Cheryl Frank, equity portfolio manager
CapEx is on the rise, and it could be setting the stage for an industrial renaissance.
I’m paying close attention to how increased capital expenditures will benefit suppliers across industries — what I call pick-and-shovel companies. Investors sometimes overlook these businesses, but they often have more stable cash flows and lower risk profiles compared to the companies they service.
Record-breaking cash flow over the last 12 months has left oil producers with some of the strongest balance sheets in history. When energy companies profit, they typically expand exploration and production, which requires more machinery and services. This could be a source of growth for companies that provide technology, products and services to the energy industry.
Four trends could contribute to an industrial renaissance
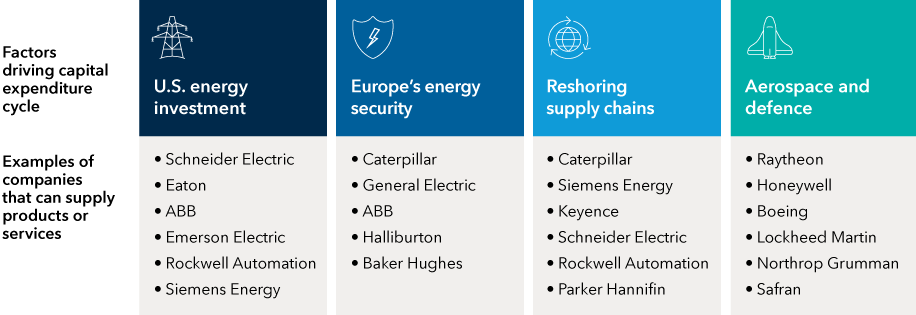
Sources: Capital Group, MSCI. Company examples reflect some of the largest constituents (ranked by descending market value) within the MSCI ACWI that fall into GICS sub-industries that supply products and/or services aligned with the factors expected to contribute to capital expenditures listed above. As of 1/17/23.
Another interesting trend is how much money has flowed into health care research and development (R&D). Pharmaceutical companies that successfully developed vaccines and anti-viral treatments like Pfizer piled up cash. Much of this capital will likely be funneled into more R&D for companies that support the biopharma industry, such as Danaher and Thermo Fisher Scientific.
Go deeper:
- 4 trends could power an industrial renaissance
- Is the spike in commodity prices sustainable?
6. Reshoring supply chains will create new opportunities across industries
Winnie Kwan, equity portfolio manager, Capital Group Capital Income Builder™ (Canada)
Supply chain disruptions during the pandemic and mounting geopolitical tensions prompted many companies to rethink their global sourcing capabilities. The strategy now focuses on balancing efficiency, reliability and security — with the intention to diversify by reshoring and onshoring manufacturing.
There’s a common misconception that this trend will displace China as the world’s largest manufacturing base. Rather, many companies are shifting to a “China +1 strategy” by maintaining operations in the country while adding facilities elsewhere. Incremental investments in China will focus primarily on the domestic market, while additional investments in other locations will serve the rest of the world.
Southeast Asia, Mexico, India and the United States are some of the top relocation destinations. Companies that facilitate this transition — like Japanese automation enablers or REITs in India — may be well-positioned to take advantage of this trend.
Southeast Asia is well-positioned for the rewiring of global supply chains

Source: AmCham Shanghai 2021 China Business Report, published September 22, 2021. Based on a survey of 338 foreign companies doing business in China. Of those companies, 63 said they were redirecting investments from China to other locations, including Southeast Asia, Mexico, India and the United States, among others. Survey respondents could provide multiple responses, so total does not add up to 100%.
It could take a decade for companies to fully transition, but the process is certainly underway. I believe it will be one of the more important investment themes of the 2020s.
Go deeper:
- Reshoring supply chains: What it means for investors
- China: What could drive its markets in 2023
- Supply chain shifts signal reglobalization
7. Core bonds can provide strength when equities are weak
Pramod Atluri, fixed income portfolio manager
Strong income opportunities and a potential economic slowdown could make core bonds the star of a well-diversified portfolio.
You can’t read the news these days without seeing the word recession. While slowing growth may be a headwind for many asset classes, for core bonds, it’s nirvana. Slowing growth, declining inflation, higher yields and a U.S. Federal Reserve nearing the end of its hiking cycle all add up to a fantastic opportunity for core bond funds to generate mid-single-digit total returns and, once again, provide ballast to a portfolio.
The starting yield of core bonds hovers around 4.7% (as measured by the Bloomberg U.S. Aggregate Bond Index, as of December 31, 2022), which is a good indicator of long-term return expectations. As an active manager, I seek to add excess return by managing interest rate sensitivity, sector allocation, security selection and other levers.
And if a recession does hit, bringing inflation down faster than expected, further upside is possible. Interest rates would likely decline, leading to meaningful bond price appreciation. For example, a 50-basis-point decline in rates would translate to a roughly 3% gain for core bonds (as described above).
Go deeper:
- Bond market outlook: Prospects brighten as Fed slows hikes
8. Credit fundamentals are making a comeback
Damien McCann, fixed income portfolio manager, Capital Group Multi-Sector Income Fund™ (Canada)
Credit fundamentals may soon be back in the driver’s seat as inflation cools and rate hikes slow.
While consistent cash flows and strong balance sheets are always important, they become essential during periods of falling growth when corporate bonds are often impacted unevenly across industries and asset classes. Our analysts are focused on identifying companies that can deftly navigate such an environment.
For bond investors, finding companies that are inventing the next big thing is less important than determining if they can meet their debt obligations. For example, established social media companies may be facing stiff competition for younger users, but they are also very creditworthy when measured by profitability, free cash flow and relatively low debt levels.
Credit fundamentals vary greatly across individual industries and issuers

Source: Bloomberg Index Services Ltd. As of 12/31/22. Represents the top nine industries by market value within the Bloomberg U.S. Corporate Investment Grade Index. Based in USD.
Today’s starting yields for higher income bond sectors such as investment grade (BBB/Baa and above), high yield, emerging markets and securitized debt offer attractive entry points for long-term investors. The total return opportunity is also more appealing compared to recent years, as these higher yields may help buffer bond market volatility.
Spreads for investment-grade and high-yield corporate bonds may not scream “buy,” but our analysts are finding attractive valuations in select issuers and industries.
Go deeper:
- Securitized credit can be important diversifier
9. High-yield bonds are earning their name again
Shannon Ward, fixed income portfolio manager, Capital Group Multi-Sector Income Fund™ (Canada)
At today’s yields, high-yield bonds can provide attractive income to an investor’s portfolio.
Yields in the neighbourhood of 8% help provide a buffer against bond market volatility, so the likelihood of earning a positive return is higher. History shows that when high-yield bonds yielded in the 7% to 8% range, the average two-year annualized forward return was 9.2%, and the average three-year annualized forward return was 7.9%.
Strong returns typically followed periods of elevated yields

Source: Bloomberg Index Services Ltd. As of 12/31/22. Yield to worst is the lowest yield that can be realized by either calling or putting on one of the available call/put dates, or holding a bond to maturity. Past results are not predictive of results in future periods. Returns are in USD.
While we are aware of the possibility of a contraction, I don’t expect the same level of price volatility in the high-yield market that followed the global financial crisis or the onset of the pandemic. The U.S. high-yield bond market is higher quality now (as defined by credit ratings) with just 11% of bonds rated CCC-or-below (as of December 31, 2022) versus 20% in December 2007.
Go deeper:
- 5 reasons to invest in high yield
10. 60/40 portfolios are alive and well
Hilda Applbaum, equity portfolio manager, Capital Group Global Balanced Fund™ (Canada)
Ask your favourite search engine, “Is the 60/40 portfolio dead?” and it will generate about half a million results. Such skepticism is understandable following a year in which stocks and bonds both declined for the first time in decades. Despite the poor year, I believe the concept of a well-balanced portfolio — whether a 60/40 or 65/35 equity/fixed income split — is indeed alive and well.
For the first time in years, it’s possible to seek total returns in the high single digits by investing in core bonds and proven dividend-paying stocks without taking undue risk or reaching for yield. With the yield on the Bloomberg U.S. Aggregate Bond Index currently above 4%, many core bonds can provide a consistent return in the mid-single digits. That’s something we haven’t seen since 2008. Investors who are comfortable taking a little more risk by including investment-grade and high-yield corporate bonds can look for their bond portfolios to potentially contribute even more.
Companies that pay a dividend can contribute to an attractive return picture with yields north of 3% and the potential for capital appreciation. For example, Broadcom has raised its dividend 12 consecutive years and had a 3.3% yield (as of December 31, 2022).
A balanced portfolio would have outpaced other strategies over the past 15 years

Sources: Capital Group, Bloomberg Index Services Ltd., FTSE Russell, ICE Benchmark Administration Ltd., MSCI, Refinitiv Datastream, Standard & Poor’s. As of 12/31/22. “Buy the dip” strategy represents buying the prior year’s worst performing asset class every year. “Ride the wave” strategy represents buying the prior year’s best performing asset class every year. "Balanced portfolio" strategy represents maintaining a 60/40 split between U.S. large cap stocks and U.S. aggregate bonds. Asset classes included in the analysis: cash (Bloomberg 1–3 Months U.S. Treasury Bill Index), developed international stocks (MSCI EAFE Index), emerging markets stocks (MSCI Emerging Markets Index), foreign bonds (Bloomberg Global Aggregate Index), global commodities (S&P GSCI), gold (LBMA Gold), U.S. equity REITs (FTSE USA REIT), U.S. high-yield bonds (Bloomberg U.S. Corporate High Yield Index), U.S. aggregate bonds (Bloomberg U.S. Aggregate Index), U.S. large cap stocks (S&P 500 Index), U.S. small cap stocks (Russell 2000), U.S. taxable municipal bonds (Bloomberg Taxable Municipal Bond Index). This assumes the portfolios are rebalanced annually. Past results are not predictive of results in future periods. Based in USD.
Traditional asset allocation is not a broken or failed strategy. It will always make sense to think about balance, diversification and risk. A one-size-fits-all approach doesn’t work for every investor. It’s about building portfolios from the bottom up that align with investor goals.
Go deeper:
- 3 reasons why 60/40 portfolios may make a comeback
What’s not changing? The importance of long-term investing
Andrew Suzman, equity portfolio manager
My colleagues may be able to look at the future and imagine new products and emerging trends, but the investment theme closest to my heart is one that doesn’t change. Despite all the transformations in the world, I believe the nature of my job and focus as a portfolio manager will continue to be exactly the same.
In 2023, just as we did in 2013 and 2003, we will come upon individual companies that do interesting things. We’ll try to buy them at reasonable prices and hold them so that any returns we see may be better than if we were to buy every company. That is my true north.
Some companies will get it right, and some will get it wrong. Our job is to find those most likely to get it right and create wealth over time so that our investors may benefit. Not that we’ll be perfect, but I’m optimistic that we can get more companies right than wrong and continue to add value for our clients.
Bloomberg U.S. Aggregate Bond Index represents the U.S. investment-grade fixed-rate bond market. Bloomberg U.S. Corporate Investment Grade Index represents the universe of investment-grade, publicly issued U.S. corporate and specified foreign debentures and secured notes that meet the specific maturity, liquidity and quality requirements. Bloomberg U.S. Corporate High Yield Index covers the universe of fixed-rate, non-investment-grade debt. Bloomberg U.S. Corporate High Yield 2% Issuer Capped Index covers the universe of fixed-rate, non-investment-grade debt. The index limits the maximum exposure of any one issuer to 2%. Bloomberg U.S. CMBS ex AAA Index tracks investment-grade commercial mortgage-backed securities excluding AAA-rated securities. Bloomberg Global Aggregate Index represents the global investment-grade fixed-rate bond market. Bloomberg 1–3 Months U.S. Treasury Bill Index is designed to measure the performance of public obligations of the U.S. Treasury that have a remaining maturity of greater than or equal to one month and less than three months.
FTSE USA REIT Index represents the market for U.S.-based real estate investment trust (REIT) companies.
JP Morgan Emerging Markets Bond Index (EMBI) Global Diversified is a uniquely weighted emerging market debt benchmark that tracks total returns for U.S. dollar-denominated bonds issued by emerging market sovereign and quasi-sovereign entities.
LBMA Gold Price represents the global benchmark spot prices for unallocated gold delivered in London and is administered independently by ICE Benchmark Administration.
MSCI All Country World Index (ACWI) is a free float-adjusted market capitalization-weighted index designed to measure equity market results in the global developed and emerging markets, consisting of more than 40 developed and emerging market country indices. MSCI EAFE (Europe, Australasia, Far East) Index is a free float-adjusted market capitalization-weighted index designed to measure developed equity market results, excluding the United States and Canada. MSCI ACWI Investable Market Index (IMI) is a free float-adjusted market capitalization-weighted index designed to measure the large-, mid- and small-capitalization segments of global developed and emerging markets, consisting of more than 40 developed and emerging market country indices. MSCI Emerging Markets Index is a free float-adjusted market capitalization-weighted index designed to measure equity market results in the global emerging markets, consisting of more than 20 emerging market country indices.
The S&P 500 Index is a market capitalization-weighted index based on the results of approximately 500 widely held common stocks. The S&P 500 Equal-Weighted Index is an equal-weighted index based on the results of approximately 500 widely held common stocks. S&P GSCI is a broad-based production-weighted index of the global commodities market.
This report, and any product, index or fund referred to herein, is not sponsored, endorsed or promoted in any way by J.P. Morgan or any of its affiliates who provide no warranties whatsoever, express or implied, and shall have no liability to any prospective investor, in connection with this report.
Our latest insights
-
-
Currencies
-
Market Volatility
-
Market Volatility
-
Markets & Economy
10 investment themes for 2023
RELATED INSIGHTS
-
Global Equities
-
-
Markets & Economy
Commissions, trailing commissions, management fees and expenses all may be associated with investments in investment funds. Please read the prospectus before investing. Investment funds are not guaranteed or covered by the Canada Deposit Insurance Corporation or by any other government deposit insurer. For investment funds other than money market funds, their values change frequently. For money market funds, there can be no assurances that the fund will be able to maintain its net asset value per security at a constant amount or that the full amount of your investment in the fund will be returned to you. Past performance may not be repeated.
Unless otherwise indicated, the investment professionals featured do not manage Capital Group‘s Canadian investment funds.
References to particular companies or securities, if any, are included for informational or illustrative purposes only and should not be considered as an endorsement by Capital Group. Views expressed regarding a particular company, security, industry or market sector should not be considered an indication of trading intent of any investment funds or current holdings of any investment funds. These views should not be considered as investment advice nor should they be considered a recommendation to buy or sell.
Statements attributed to an individual represent the opinions of that individual as of the date published and do not necessarily reflect the opinions of Capital Group or its affiliates. This information is intended to highlight issues and not be comprehensive or to provide advice. For informational purposes only; not intended to provide tax, legal or financial advice. Capital Group funds are available in Canada through registered dealers. For more information, please consult your financial and tax advisors for your individual situation.
Forward-looking statements are not guarantees of future performance, and actual events and results could differ materially from those expressed or implied in any forward-looking statements made herein. We encourage you to consider these and other factors carefully before making any investment decisions and we urge you to avoid placing undue reliance on forward-looking statements.
The S&P 500 Composite Index (“Index”) is a product of S&P Dow Jones Indices LLC and/or its affiliates and has been licensed for use by Capital Group. Copyright © 2026 S&P Dow Jones Indices LLC, a division of S&P Global, and/or its affiliates. All rights reserved. Redistribution or reproduction in whole or in part are prohibited without written permission of S&P Dow Jones Indices LLC.
FTSE source: London Stock Exchange Group plc and its group undertakings (collectively, the "LSE Group"). © LSE Group 2026. FTSE Russell is a trading name of certain of the LSE Group companies. "FTSE®" is a trade mark of the relevant LSE Group companies and is used by any other LSE Group company under licence. All rights in the FTSE Russell indices or data vest in the relevant LSE Group company which owns the index or the data. Neither LSE Group nor its licensors accept any liability for any errors or omissions in the indices or data and no party may rely on any indices or data contained in this communication. No further distribution of data from the LSE Group is permitted without the relevant LSE Group company's express written consent. The LSE Group does not promote, sponsor or endorse the content of this communication. The index is unmanaged and cannot be invested in directly.
BLOOMBERG® is a trademark and service mark of Bloomberg Finance L.P. and its affiliates (collectively “Bloomberg”). Bloomberg or Bloomberg’s licensors own all proprietary rights in the Bloomberg Indices. Neither Bloomberg nor Bloomberg’s licensors approves or endorses this material, or guarantees the accuracy or completeness of any information herein, or makes any warranty, express or implied, as to the results to be obtained therefrom and, to the maximum extent allowed by law, neither shall have any liability or responsibility for injury or damages arising in connection therewith.
The MSCI information may only be used for your internal use, may not be reproduced or redisseminated in any form and may not be used as a basis for or a component of any financial instruments or products or indices. None of the MSCI information is intended to constitute investment advice or a recommendation to make (or refrain from making) any kind of investment decision and may not be relied on as such. Historical data and analysis should not be taken as an indication or guarantee of any future performance analysis, forecast or prediction. The MSCI information is provided on an “as is” basis and the user of this information assumes the entire risk of any use made of this information. MSCI, each of its affiliates and each other person involved in or related to compiling, computing or creating any MSCI information (collectively, the “MSCI Parties”) expressly disclaims all warranties (including, without limitation, any warranties of originality, accuracy, completeness, timeliness, non-infringement, merchantability and fitness for a particular purpose) with respect to this information. Without limiting any of the foregoing, in no event shall any MSCI Party have any liability for any direct, indirect, special, incidental, punitive, consequential (including, without limitation, lost profits) or any other damages. (www.msci.com)
Capital believes the software and information from FactSet to be reliable. However, Capital cannot be responsible for inaccuracies, incomplete information or updating of the information furnished by FactSet. The information provided in this report is meant to give you an approximate account of the fund/manager's characteristics for the specified date. This information is not indicative of future Capital investment decisions and is not used as part of our investment decision-making process.
Indices are unmanaged and cannot be invested in directly. Returns represent past performance, are not a guarantee of future performance, and are not indicative of any specific investment.
All Capital Group trademarks are owned by The Capital Group Companies, Inc. or an affiliated company in Canada, the U.S. and other countries. All other company names mentioned are the property of their respective companies.
Capital Group funds are offered in Canada by Capital International Asset Management (Canada), Inc., part of Capital Group, a global investment management firm originating in Los Angeles, California in 1931. Capital Group manages equity assets through three investment groups. These groups make investment and proxy voting decisions independently. Fixed income investment professionals provide fixed income research and investment management across the Capital organization; however, for securities with equity characteristics, they act solely on behalf of one of the three equity investment groups.
The Capital Group funds offered on this website are available only to Canadian residents.