Market Volatility
 Darrell Spence
 Tom Hollenberg
 Margaret Steinbach
Fears of persistent inflation and tightening monetary policy have rocked markets since the start of the year. More richly valued sectors like technology suffered the initial brunt of the sell-off as their valuations came under close scrutiny with the expectation of higher interest rates. The volatility spread to blue chip stocks with the Standard & Poor’s 500 Composite Index briefly entering correction territory on Monday before whipsawing back. On Wednesday, markets gyrated again before closing nearly flat as the U.S. Federal Reserve hinted it may move more quickly than previously expected to hike rates and shrink its balance sheet.
Renewed geopolitical tensions, ranging from the Russia/Ukraine border crisis to U.S.-China relations, are also fueling market uncertainty and are likely to keep some pressure on asset prices in the months ahead. While volatility is likely to persist, several of our investment professionals believe markets are healthier than many people realize.
Below are some of their views on how the market correction and Fed policy changes may provide an opportunity to adjust portfolios, taking selective action where they have long-term convictions to position portfolios for the next three to five years.
Growth sectors still present opportunities
The severity of the market correction reflects an increasingly risk-off investor sentiment, hitting expensively valued growth stocks and speculative assets like cryptocurrencies particularly hard. Meanwhile, more value-oriented stocks in areas of energy, financials and consumer staples have fared better, suggesting that a longer term market rotation may be taking root.
The NASDAQ Composite fell 7.6% in U.S. dollar terms last week, suffering its biggest decline since the start of the pandemic. As of January 26, 44% of stocks in the NASDAQ Composite were down 50% or more from their 52-week highs.
How returns have differed

Sources: Capital Group, MSCI, NASDAQ, Refinitiv Datastream. Year-to-date return performance in USD is based on total returns relative to December 31, 2021. Returns are as of market close January 21, 2022.
Netflix was among the hardest hit last week when its share price fell 22% on January 21 after reporting lower-than-expected subscriber growth. This triggered deeper concerns that even industry giants would not be spared from eroding demand, tougher competition and potentially deteriorating earnings. Within the technology sector, recent price action indicates investor preference for high-quality, low price-to-earnings (P/E) companies over the higher valued companies which tend to be more sensitive to rising rates.
But volatility in the share prices of emergent companies is to be expected. Over the past 15 years, some fast-growing companies have experienced multiple corrections in share price. Those investors who weathered the market turbulence and remained invested would have realized attractive returns, however.
Corrections and results from select big tech companies from 2007 to 2021
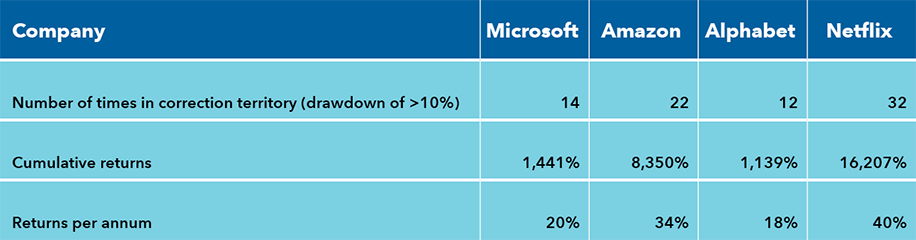
Sources: Capital Group, Morningstar Direct. As of December 31, 2021. Corrections defined by share price decline of 10% or greater. Based on daily returns in USD from 2007 to 2021.
In short, earnings matter. History has shown that certain high multiple companies can continue to appreciate should fundamentals exceed expectations over time. This is especially true for select growth companies with large and expanding total addressable markets with potentially long revenue and earnings growth runways.
The U.S. Fed may accelerate tightening despite volatility spikes
— Tom Hollenberg, Fixed Income Portfolio Manager, and Margaret Steinbach, Fixed Income Investment Director
Wednesday’s news from the Fed was a bit more hawkish than the market anticipated but it doesn’t change our outlook for the year. We continue to expect at least four (25 basis point) rate hikes and think inflation is likely to persist well above the Fed’s target this year. We have been thinking that a faster pace of rate hikes can’t be ruled out, and Powell’s comments at the press conference confirmed this.
The last time the Fed hiked, it did so in 25 basis point increments each quarter. That is still probably its most likely course of action this time, but given how far above target inflation is, there's no reason why the Fed would want to limit its ability to hike faster if it needs to. In his comments to the press, Powell did not dismiss the possibility that the Fed would speed up tightening or rule out the possibility of raising rates in 50 basis point increments.
Investors could be in for a turbulent ride over the next few quarters. It may not take many rate hikes or much quantitative tightening to spur more equity market volatility. But the view of Capital Group’s rates team is that the Federal Reserve is not likely to let the stock market throw it off the path of tightening, like it did in the last hiking cycle. If you go back to 2017 and 2018, when the Fed hiked 175 basis points, it had space to reverse course when asset prices plunged because inflation was below target. Today that is not the case.
This would present a tricky dilemma for the central bank. It would be hard for the Fed to claim to be credible about achieving its dual mandate (of promoting price stability and full employment) if it backs off of its tightening schedule before inflation comes down.
We are positioning to help protect against the impact of higher interest rates through duration and yield curve positioning, as well as owning Treasury Inflation Protected Securities (TIPS) as valuations still offer upside potential.
A market correction may not be lasting
— Darrell Spence, Economist
Although any period of monetary tightening can generate higher market volatility, U.S. equities could remain supported by earnings growth. And while valuations are high relative to history, they are not exorbitant considering current and projected levels of interest rates.
I believe that S&P 500 earnings can grow 8% to 10% in USD terms in 2022, which is still a respectable rate considering the strong rebound in corporate earnings last year. In addition, while inflation is certainly a concern for overall economic conditions, it can be beneficial for earnings growth.
Recent data would seem to indicate that inflation may persist for longer than expected and the Fed could be forced into a more aggressive tightening cycle than previously anticipated. While history suggests that tighter monetary policy and higher rates almost always put downward pressure on equity valuations, what this means for market levels depends on earnings growth and how much it can offset a contraction in price-to-earnings (P/E) multiples.
In fact, perhaps contrary to conventional wisdom, the market has tended to rise in periods following initial increases in the U.S. federal funds rate. The exceptions to this are the inflationary periods of the 1970s and early 1980s, in addition to periods when the S&P 500 P/E ratio was more than 20 times earnings at the time of the initial tightening — periods which, of course, have some similarity to today.
However, inflation then was significantly worse and accompanied by a deep recession. In addition, interest rates in prior periods of high valuation were substantially higher. While this is no guarantee that the equity market won’t decline when the Fed tightens, it does provide a bit more support than was evident during some of those historical episodes.
S&P 500 has mostly powered through initial Fed tightening cycles
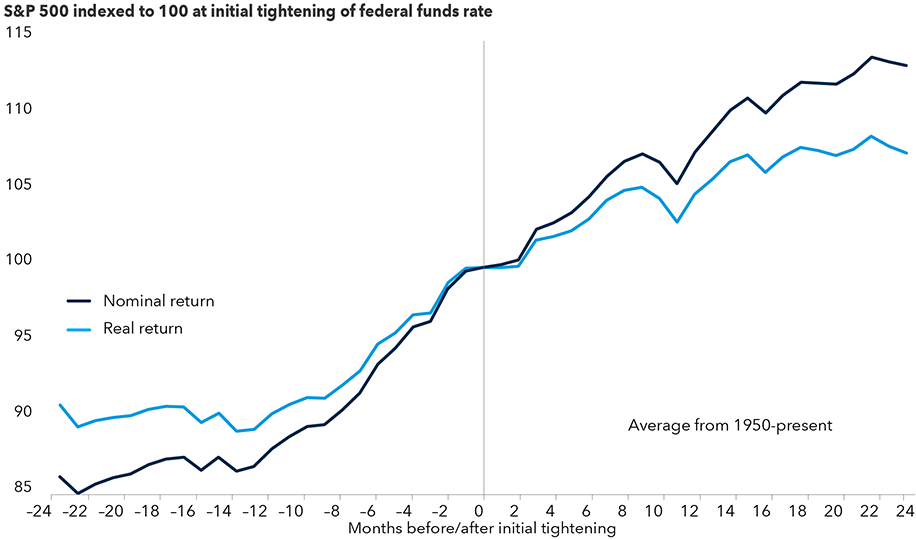
Source: Capital Group. Data as of December 31, 2021. The nominal rate of return is the amount of money generated by an investment before factoring in expenses such as taxes and inflation. Real return is what is earned on an investment after accounting for taxes and inflation. Returns are in USD.
My base case scenario is for U.S. GDP to grow 2% to 3% in 2022 as fiscal stimulus wanes and monetary policy tightens. This slower — but still positive — economic growth should support an increase in corporate profits.
While we are not likely to see the outsized gains of 2021, single-digit equity returns still seem attainable as the market rises in line with, or slightly less than, earnings growth this year. They are likely to be accompanied by more volatility, and we are starting to see that in markets. And while a correction is never out of the realm of possibility in any given year or economic environment, we do not expect a systemic market decline given current economic conditions, earnings strength and level of interest rates.
MSCI ACWI is a free float-adjusted market capitalization-weighted index designed to measure equity market results in the global developed and emerging markets, consisting of more than 40 developed and emerging market country indices.
MSCI ACWI Growth Index captures large- and mid-cap securities exhibiting overall growth style characteristics across 23 Developed Markets (DM) countries and 25 Emerging Markets (EM) countries.
MSCI ACWI Value Index captures large- and mid-cap securities exhibiting overall value style characteristics across 23 Developed Markets countries and 25 Emerging Markets (EM) countries.
NASDAQ Composite Index tracks the performance of more than 3,000 stocks listed on the NASDAQ and is often viewed as an indicator for the newer sectors of the economy.
Standard & Poor’s 500 Composite Index is a market capitalization-weighted index based on the results of approximately 500 widely held common stocks.
©2022 Morningstar, Inc. All rights reserved. The information contained herein: (1) is proprietary to Morningstar and/or its content providers; (2) may not be copied or distributed; and (3) is not warranted to be accurate, complete or timely. Neither Morningstar nor its content providers are responsible for any damages or losses arising from any use of this information. Past performance is no guarantee of future results.
Our latest insights
-
-
Currencies
-
Market Volatility
-
Market Volatility
-
Markets & Economy
RELATED INSIGHTS
-
-
Economic Indicators
-
Market Volatility
Commissions, trailing commissions, management fees and expenses all may be associated with investments in investment funds. Please read the prospectus before investing. Investment funds are not guaranteed or covered by the Canada Deposit Insurance Corporation or by any other government deposit insurer. For investment funds other than money market funds, their values change frequently. For money market funds, there can be no assurances that the fund will be able to maintain its net asset value per security at a constant amount or that the full amount of your investment in the fund will be returned to you. Past performance may not be repeated.
Unless otherwise indicated, the investment professionals featured do not manage Capital Group‘s Canadian investment funds.
References to particular companies or securities, if any, are included for informational or illustrative purposes only and should not be considered as an endorsement by Capital Group. Views expressed regarding a particular company, security, industry or market sector should not be considered an indication of trading intent of any investment funds or current holdings of any investment funds. These views should not be considered as investment advice nor should they be considered a recommendation to buy or sell.
Statements attributed to an individual represent the opinions of that individual as of the date published and do not necessarily reflect the opinions of Capital Group or its affiliates. This information is intended to highlight issues and not be comprehensive or to provide advice. For informational purposes only; not intended to provide tax, legal or financial advice. Capital Group funds are available in Canada through registered dealers. For more information, please consult your financial and tax advisors for your individual situation.
Forward-looking statements are not guarantees of future performance, and actual events and results could differ materially from those expressed or implied in any forward-looking statements made herein. We encourage you to consider these and other factors carefully before making any investment decisions and we urge you to avoid placing undue reliance on forward-looking statements.
The S&P 500 Composite Index (“Index”) is a product of S&P Dow Jones Indices LLC and/or its affiliates and has been licensed for use by Capital Group. Copyright © 2026 S&P Dow Jones Indices LLC, a division of S&P Global, and/or its affiliates. All rights reserved. Redistribution or reproduction in whole or in part are prohibited without written permission of S&P Dow Jones Indices LLC.
FTSE source: London Stock Exchange Group plc and its group undertakings (collectively, the "LSE Group"). © LSE Group 2026. FTSE Russell is a trading name of certain of the LSE Group companies. "FTSE®" is a trade mark of the relevant LSE Group companies and is used by any other LSE Group company under licence. All rights in the FTSE Russell indices or data vest in the relevant LSE Group company which owns the index or the data. Neither LSE Group nor its licensors accept any liability for any errors or omissions in the indices or data and no party may rely on any indices or data contained in this communication. No further distribution of data from the LSE Group is permitted without the relevant LSE Group company's express written consent. The LSE Group does not promote, sponsor or endorse the content of this communication. The index is unmanaged and cannot be invested in directly.
BLOOMBERG® is a trademark and service mark of Bloomberg Finance L.P. and its affiliates (collectively “Bloomberg”). Bloomberg or Bloomberg’s licensors own all proprietary rights in the Bloomberg Indices. Neither Bloomberg nor Bloomberg’s licensors approves or endorses this material, or guarantees the accuracy or completeness of any information herein, or makes any warranty, express or implied, as to the results to be obtained therefrom and, to the maximum extent allowed by law, neither shall have any liability or responsibility for injury or damages arising in connection therewith.
The MSCI information may only be used for your internal use, may not be reproduced or redisseminated in any form and may not be used as a basis for or a component of any financial instruments or products or indices. None of the MSCI information is intended to constitute investment advice or a recommendation to make (or refrain from making) any kind of investment decision and may not be relied on as such. Historical data and analysis should not be taken as an indication or guarantee of any future performance analysis, forecast or prediction. The MSCI information is provided on an “as is” basis and the user of this information assumes the entire risk of any use made of this information. MSCI, each of its affiliates and each other person involved in or related to compiling, computing or creating any MSCI information (collectively, the “MSCI Parties”) expressly disclaims all warranties (including, without limitation, any warranties of originality, accuracy, completeness, timeliness, non-infringement, merchantability and fitness for a particular purpose) with respect to this information. Without limiting any of the foregoing, in no event shall any MSCI Party have any liability for any direct, indirect, special, incidental, punitive, consequential (including, without limitation, lost profits) or any other damages. (www.msci.com)
Capital believes the software and information from FactSet to be reliable. However, Capital cannot be responsible for inaccuracies, incomplete information or updating of the information furnished by FactSet. The information provided in this report is meant to give you an approximate account of the fund/manager's characteristics for the specified date. This information is not indicative of future Capital investment decisions and is not used as part of our investment decision-making process.
Indices are unmanaged and cannot be invested in directly. Returns represent past performance, are not a guarantee of future performance, and are not indicative of any specific investment.
All Capital Group trademarks are owned by The Capital Group Companies, Inc. or an affiliated company in Canada, the U.S. and other countries. All other company names mentioned are the property of their respective companies.
Capital Group funds are offered in Canada by Capital International Asset Management (Canada), Inc., part of Capital Group, a global investment management firm originating in Los Angeles, California in 1931. Capital Group manages equity assets through three investment groups. These groups make investment and proxy voting decisions independently. Fixed income investment professionals provide fixed income research and investment management across the Capital organization; however, for securities with equity characteristics, they act solely on behalf of one of the three equity investment groups.
The Capital Group funds offered on this website are available only to Canadian residents.