United States
 Darrell Spence
 Greg Garrett
Is surging U.S. debt sustainable, or will it spin out of control?
It’s a question many are asking. U.S. government debt is on a sharp upward trend, and current policy proposals suggest that will continue. The recent passage of a US$1.9 trillion pandemic relief package has helped drive the trailing 12-month federal deficit to 18.6% of gross domestic product — the largest shortfall since 1945. This will almost certainly push Uncle Sam’s public debt above the World War II‒era peak of 106% of GDP.
A rising tide of debt: U.S. debt-to-GDP ratio
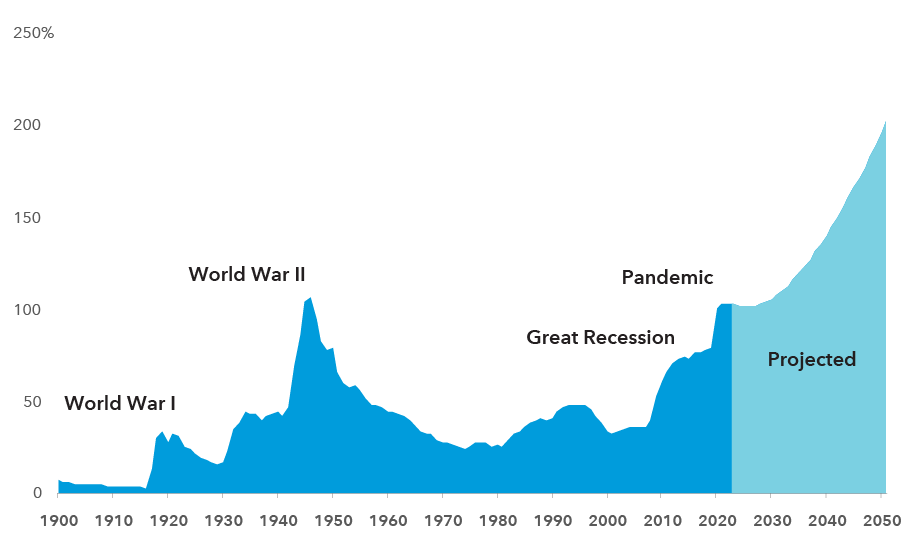
Source: U.S. Congressional Budget Office as of March 4, 2021. Federal debt held by the public. Long-term forecast excludes the impact of the American Rescue Plan Act of 2021 and assumes no meaningful changes to current laws affecting U.S. government revenues and spending. Based on USD.
While we are moving into uncharted territory, there are many factors that can influence whether — or when — this debt will ever become a real problem. Here are four reasons why we believe the federal debt should be manageable for the foreseeable future.
1. U.S. interest rates are lower than GDP growth
Many economists believe that debt crises arise when the debt-to-GDP ratio crosses 100%. Above that level, the debt stock can begin to spiral upward by itself, even without further additions from ongoing deficits. Italy and Greece are the most recent examples of this phenomenon. U.S. debt is currently crossing this threshold.
However, this debt-spiral math only works if a country’s interest rate is higher than its growth rate. As long as the nominal interest rate on the debt is less than the nominal growth rate of the economy, the upward spiral can be avoided. That is the situation in the U.S. today, and it is likely to remain the case for the foreseeable future.
Nominal interest rates have been lower than the nominal growth rate for most of the time since the early 1960s. However, this relationship has fluctuated. During the 1960s, nominal growth regularly exceeded the interest rate on 10-year U.S. Treasury bonds, but that flipped during the 1980s and into the 1990s as inflationary pressures drove interest rates sharply higher.
In the 2000s, the relationship reverted to its more sustainable form, although at lower levels of nominal growth and higher levels of government debt relative to GDP. Looking ahead, this suggests that the biggest risk could be a sustained surge of inflation that drives interest rates well above the GDP growth rate.
Sustaining the U.S. debt: GDP growth vs. interest rates
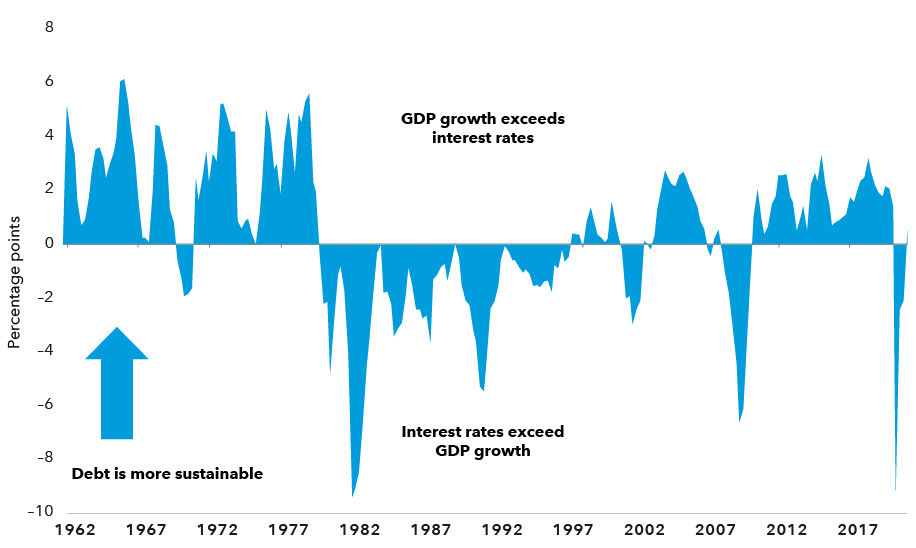
Sources: Bureau of Economic Analysis, U.S. Federal Reserve, Refinitiv Datastream. As of March 31, 2021. Chart displays the difference in percentage points between the year-over-year growth rate of nominal GDP and the nominal 10-year U.S. Treasury yield on a quarterly basis since the first quarter of 1962.
Notably, while a 100% debt-to-GDP ratio has proven to be a trigger point in some past debt crises, there are exceptions to this rule. Japan is the most prominent example. It has benefited from the fact that a large part of its debt is held by a somewhat captive domestic investor base that includes large banks, pension funds, the post office and other institutional investors.
2. The U.S. fiscal position is worsening but is not an outlier
The COVID-19 pandemic has accelerated rising debt trends around the world, not just in the U.S. Many countries took aggressive fiscal and monetary policy actions to soften the economic impact of widespread lockdowns last year.
The U.S.’s debt-to-GDP ratio has risen sharply since just before the global financial crisis of 2008–2009, but it still trails Japan’s by a wide margin. The U.S. debt burden is not far ahead of those of the U.K. and the eurozone. China and other emerging markets have lower ratios but have also seen significant increases.
Debt rising around the world: Gross government debt to GDP
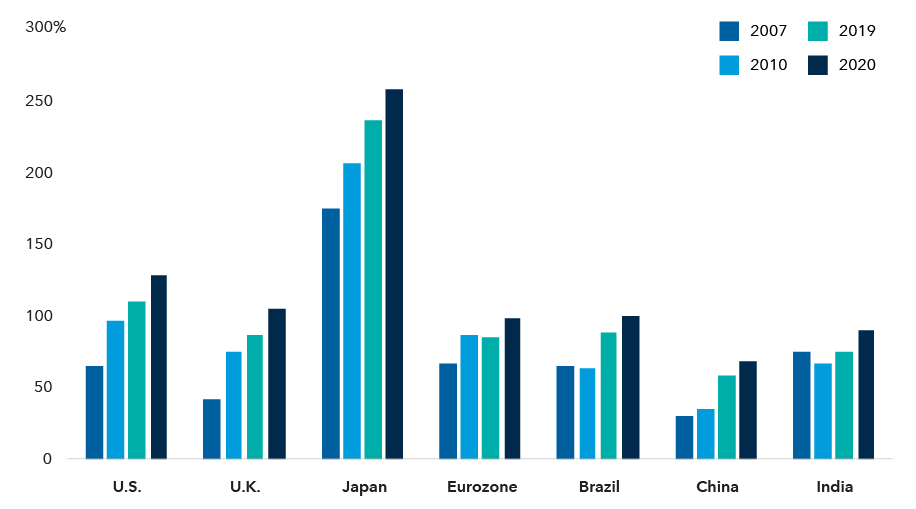
Source: International Monetary Fund, World Economic Outlook Database, April 2021. Based on USD.
While the U.S. debt burden has risen sharply on an absolute basis, the increase has been less substantial on a relative basis. From the perspective of sovereign debt investors, that means the U.S. is not a significant outlier in terms of debt sustainability. That reflects the global nature of the rising debt-to-GDP trend. Government debt worldwide reached US$82.3 trillion, or 105% of GDP, in 2020 ― up from 88% in 2019, the Institute of International Finance reported in February. In mature markets, it reached 130% of GDP in 2020, up from 110% in 2019.
America’s relative position is also enhanced by the privileged status of the U.S. dollar as the global reserve currency, which creates a significant level of built-in demand for U.S. Treasury debt and other dollar-denominated assets. The U.S. Treasury market enjoys safe-haven status in periods of market stress, owing to a perceived low risk of default. Many assets, including most commodities, are priced in dollar terms and U.S. Treasuries remain the “risk-free” asset against which most other assets are priced. These attributes support demand for U.S. government bonds, which in turn helps support the debt burden.
3. Governments have various levers to pull
That said, the higher the debt burden, the greater the potential for it to cause a problem. The textbook solution for a country running large deficits and a rising debt burden is to raise taxes, cut spending or both. While such measures may weigh on economic growth in the short run, paying down debt could help offset that in the longer term. The lesson from the post‒WWII experience is that the process of debt reduction can take decades.
In the near term, while individual and corporate tax rates may go up modestly, government spending is likely to increase as well. This does not necessarily have to be negative for the deficit, however. To the extent that the U.S. economy sees higher levels of productivity and innovation as a result, it could boost growth, and thus tax revenues. This is not all that difficult to imagine in an era of rapid technological change. There may even be innovations coming out of the pandemic that lead to improved productivity and growth, making the debt burden more manageable.
U.S. government budget deficit widens
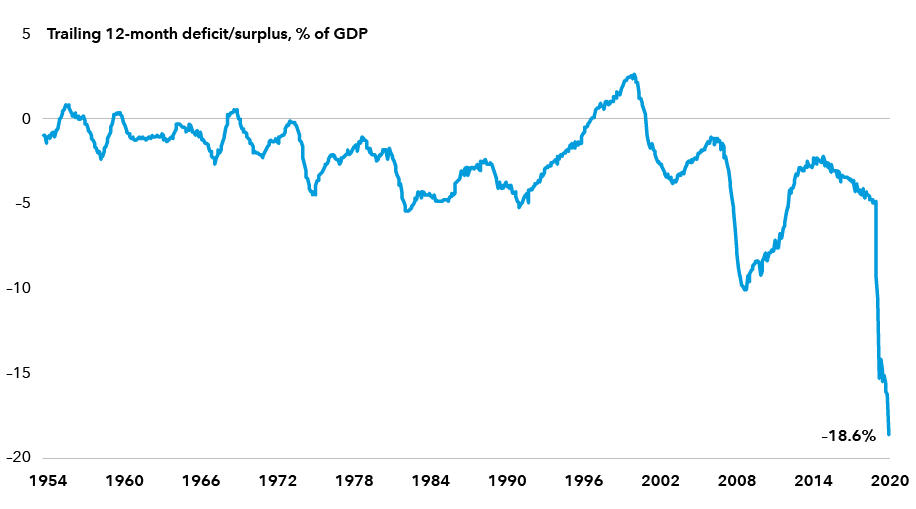
Sources: U.S. Treasury Department and Bureau of Economic Analysis. As of March 31, 2021. Based on USD.
One alternative economic theory that has received some attention amid the surge in U.S. debt is Modern Monetary Theory. MMT posits that most countries that issue their own currency face no financial constraints. Thus, for many governments — including the U.S. — there is no risk of default. Governments can decide what they need to spend as their first priority, and then address financing through taxation and borrowing. There are limits to debt levels, but those levels are tied to inflation.
As noted by economist and MMT advocate Stephanie Kelton, inflation is evidence that a deficit is too big, while unemployment is evidence of a deficit that is too small. Thus, under MMT, fiscal policy plays a more central role in the management of inflation. Critics note that, among other things, the management of inflation would be more heavily influenced by the political process under MMT. In addition, the Federal Reserve would lose its independence, and the framework that has anchored inflation expectations for arguably the last 30 years would be gone.
4. Monetary policy can adapt to changing conditions
Finally, there is the Federal Reserve. While the goals and policies of the central bank have evolved since its founding over 100 years ago, the current monetary policy framework has shifted to an explicit inflation target and maximizing employment. The Fed’s recent move toward average inflation targeting, plus its signals that low policy rates and asset purchases will remain in place, support higher nominal GDP growth and low interest rates, a dynamic that makes the level of federal debt more tenable.
The global financial crisis was the first time that many people had ever heard of the Fed using its balance sheet to support large asset purchases. But the practice of buying U.S. government securities as an instrument of monetary policy dates to the 1920s. Following World War I, Benjamin Strong, then head of the Federal Reserve Bank of New York, did so in an effort to stem a recession in 1923.
A few years later, the U.S. entered the Great Depression and, just as in the late 2000s, short-term interest rates quickly hit the zero lower bound in the early 1930s. During World War II, the U.S. Treasury directed the Federal Reserve to target short- and long-term interest rates through the purchase of U.S. government bonds as a means of financing the war effort.
Fast forward to Ben Bernanke, who became Fed chair in 2006. His legacy is defined by the Fed’s actions to stabilize the financial system and the economy during the financial crisis. Having reached the zero bound on policy rates, the Federal Reserve purchased billions of dollars of U.S. Treasury and mortgage-backed securities. This quantitative easing may have been new to many market participants, but it was already part of the Fed’s playbook.
There is no reason to think that U.S. monetary policy will stop adapting to the changing circumstances of the U.S. and global economies. As a result, it is useful to keep an open mind regarding potential approaches and regime shifts. For instance, a large balance sheet at the Federal Reserve could become a fixture for many years to come. This should not be underestimated as a policy tool with the capacity to absorb sizable government debt issuance.
Bottom line: The outlook is not so dire
The response by the federal government to the COVID-19 pandemic has taken us back to levels of debt not seen since World War II. While the level of government debt is high, it is elevated in other mature economies as well.
The fact is that a debt crisis arises when investors are no longer willing to purchase a country’s debt. When that will occur is very difficult to predict, although it does not seem likely to happen in the U.S. anytime soon. Traditional analysis suggests that debt levels are sustainable as long as the cost of debt remains below the level of economic growth, but there are still likely limits. What they are, however, is unclear.
Markets can act as a signaling tool in this process, which in turn can influence political choices and the role played by the Federal Reserve. The economy can also change, with technology and new behaviour driving innovation and improved productivity. Suffice to say that there are many forces that can influence the path of debt, and the federal response to it, going forward.
Our latest insights
-
-
Currencies
-
Market Volatility
-
Market Volatility
-
Markets & Economy
RELATED INSIGHTS
-
-
Economic Indicators
-
U.S. Equities
Commissions, trailing commissions, management fees and expenses all may be associated with investments in investment funds. Please read the prospectus before investing. Investment funds are not guaranteed or covered by the Canada Deposit Insurance Corporation or by any other government deposit insurer. For investment funds other than money market funds, their values change frequently. For money market funds, there can be no assurances that the fund will be able to maintain its net asset value per security at a constant amount or that the full amount of your investment in the fund will be returned to you. Past performance may not be repeated.
Unless otherwise indicated, the investment professionals featured do not manage Capital Group‘s Canadian investment funds.
References to particular companies or securities, if any, are included for informational or illustrative purposes only and should not be considered as an endorsement by Capital Group. Views expressed regarding a particular company, security, industry or market sector should not be considered an indication of trading intent of any investment funds or current holdings of any investment funds. These views should not be considered as investment advice nor should they be considered a recommendation to buy or sell.
Statements attributed to an individual represent the opinions of that individual as of the date published and do not necessarily reflect the opinions of Capital Group or its affiliates. This information is intended to highlight issues and not be comprehensive or to provide advice. For informational purposes only; not intended to provide tax, legal or financial advice. Capital Group funds are available in Canada through registered dealers. For more information, please consult your financial and tax advisors for your individual situation.
Forward-looking statements are not guarantees of future performance, and actual events and results could differ materially from those expressed or implied in any forward-looking statements made herein. We encourage you to consider these and other factors carefully before making any investment decisions and we urge you to avoid placing undue reliance on forward-looking statements.
The S&P 500 Composite Index (“Index”) is a product of S&P Dow Jones Indices LLC and/or its affiliates and has been licensed for use by Capital Group. Copyright © 2025 S&P Dow Jones Indices LLC, a division of S&P Global, and/or its affiliates. All rights reserved. Redistribution or reproduction in whole or in part are prohibited without written permission of S&P Dow Jones Indices LLC.
FTSE source: London Stock Exchange Group plc and its group undertakings (collectively, the "LSE Group"). © LSE Group 2025. FTSE Russell is a trading name of certain of the LSE Group companies. "FTSE®" is a trade mark of the relevant LSE Group companies and is used by any other LSE Group company under licence. All rights in the FTSE Russell indices or data vest in the relevant LSE Group company which owns the index or the data. Neither LSE Group nor its licensors accept any liability for any errors or omissions in the indices or data and no party may rely on any indices or data contained in this communication. No further distribution of data from the LSE Group is permitted without the relevant LSE Group company's express written consent. The LSE Group does not promote, sponsor or endorse the content of this communication. The index is unmanaged and cannot be invested in directly.
BLOOMBERG® is a trademark and service mark of Bloomberg Finance L.P. and its affiliates (collectively “Bloomberg”). Bloomberg or Bloomberg’s licensors own all proprietary rights in the Bloomberg Indices. Neither Bloomberg nor Bloomberg’s licensors approves or endorses this material, or guarantees the accuracy or completeness of any information herein, or makes any warranty, express or implied, as to the results to be obtained therefrom and, to the maximum extent allowed by law, neither shall have any liability or responsibility for injury or damages arising in connection therewith.
MSCI does not approve, review or produce reports published on this site, makes no express or implied warranties or representations and is not liable whatsoever for any data represented. You may not redistribute MSCI data or use it as a basis for other indices or investment products.
Capital believes the software and information from FactSet to be reliable. However, Capital cannot be responsible for inaccuracies, incomplete information or updating of the information furnished by FactSet. The information provided in this report is meant to give you an approximate account of the fund/manager's characteristics for the specified date. This information is not indicative of future Capital investment decisions and is not used as part of our investment decision-making process.
Indices are unmanaged and cannot be invested in directly. Returns represent past performance, are not a guarantee of future performance, and are not indicative of any specific investment.
All Capital Group trademarks are owned by The Capital Group Companies, Inc. or an affiliated company in Canada, the U.S. and other countries. All other company names mentioned are the property of their respective companies.
Capital Group funds are offered in Canada by Capital International Asset Management (Canada), Inc., part of Capital Group, a global investment management firm originating in Los Angeles, California in 1931. Capital Group manages equity assets through three investment groups. These groups make investment and proxy voting decisions independently. Fixed income investment professionals provide fixed income research and investment management across the Capital organization; however, for securities with equity characteristics, they act solely on behalf of one of the three equity investment groups.
The Capital Group funds offered on this website are available only to Canadian residents.