Fixed Income
Categories
Real Estate
What real estate risks mean for commercial mortgage-backed securities
 Xavier Goss
 Hannah Greene
May 16, 2023
For advisor use only. Not for use with investors.
The failure of Silicon Valley Bank (SVB) has put renewed pressure on the commercial real estate sector in both the U.S. and Canada, as fears about tighter credit conditions and a slower economy have begun impacting the already beleaguered sector.
In the U.S., one area clearly reflecting these concerns is the commercial mortgage-backed securities (CMBS) market, notably in the non-agency space (those not issued or guaranteed by any U.S. federal government-sponsored enterprise or agency), which currently stands at US$724 billion. The CMBS market has been under a cloud since the economy was hit by COVID in 2020. Over the last three years, changing consumer and worker habits have led to a fundamental shift in how investors perceive commercial real estate, from both risk and value perspectives. This shift, in combination with higher rates from substantial tightening from the U.S. Federal Reserve, has resulted in a sharp sell-off for the non-agency CMBS market.
However, we still see some attractive opportunities in CMBS. While some subsectors like office properties face profound challenges, other areas like multifamily housing have remained more resilient, which is also the case in Canada. Overall, repricing across the market could provide an opportunity to add exposure. In this article, we primarily examine the outlook for the much larger U.S. CMBS market and discuss how investors can position for continued uncertainty amid higher rates and a potential recession.
CMBS spreads have reached interesting levels
Over the past 10 years, non-agency CMBS spreads have generally been narrower than those of corporate bonds. Along with other securitized assets, CMBS assets have traditionally been a fixed income allocation for those investors seeking some yield while remaining closer to the core, compared with corporate bond markets.
However, spreads have been widening since early 2022, as concerns related to the underlying commercial real estate market have been exacerbated by Fed tightening. While we saw some recovery in early 2023 on the view that Fed action may be slowing down, the collapse of SVB quickly reversed those moves. In April, non-agency CMBS spreads were more than 70 basis points above investment-grade (BBB/Baa and above) corporates, levels not seen since 2011.
This significant repricing in CMBS assets could provide an opportunity for investors to build exposure at more attractive valuations if they see potential for markets to hold steadier in the next 12 to 18 months.
Non-agency CMBS spreads have surpassed corporate bonds
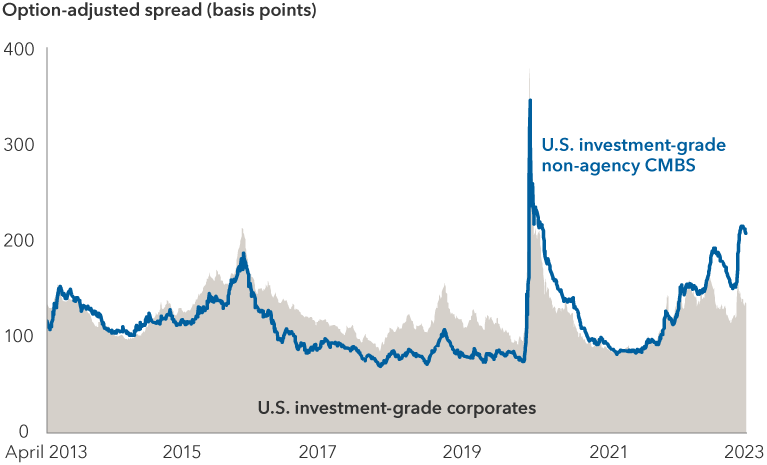
Source: Bloomberg. As of April 30, 2023. Data shown is for the Bloomberg U.S. Corporate Investment Grade Index and the Bloomberg U.S. Non-Agency CMBS Investment Grade Index.
Concerns can be largely traced back to offices
It is often the case that when one subsector is facing major headwinds, the full sector feels the impact. For commercial real estate, office properties are the main source of anxiety for investors south of the border and in Canada.
The office market has been facing challenges for several years. Office tenants in sectors such as finance and law had been cutting space even before COVID amid the shift to more flexible working habits. Meanwhile, technology companies were the driver of demand for new office space. Now many are cutting their physical space in an effort to reduce costs and are even willing to spend to end their leases early.
The change in sentiment toward office space is becoming more apparent in the market. High-profile borrowers are walking away from troubled office properties at a faster rate than expected. That, in part, led the Bank of Canada to flag the commercial property sector in its recent financial review. In its May 18 report, the central bank said lenders with large exposures to commercial real estate “could face credit losses” if some firms default on their loans.
Fundamentals remain resilient outside of offices
While the negative outlook for office space has driven spreads in the U.S. CMBS market notably wider, it is estimated to account for less than 20% of the US$5.6 trillion in outstanding commercial real estate debt. Pockets of opportunity remain for investors who can take a risk-aware, considered approach to CMBS.
Commercial real estate debt is broader than office
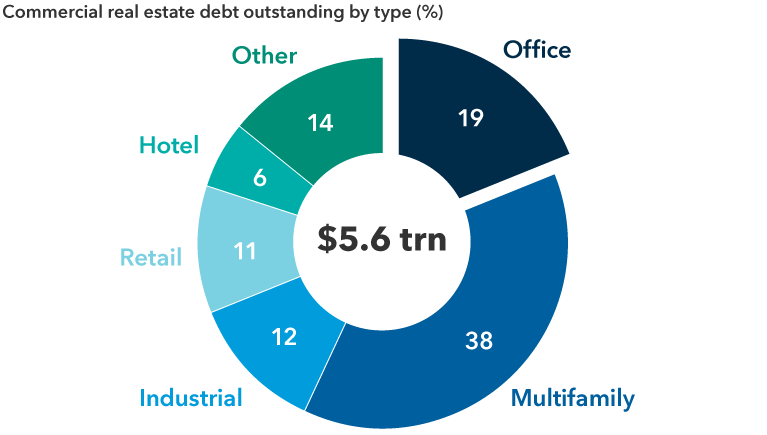
Sources: Bank of America Global Research, Federal Reserve, Mortgage Bankers Association, company 1Q 2023 earnings presentations. As of March 31, 2023. This breakdown is based on estimations of commercial real estate debt outstanding. Dollar value in USD.
In terms of fundamentals, the commercial real estate market outside of office space has remained relatively resilient. There should be room for continued growth in rents in these markets, as long as a sharp recession is avoided. For example, multifamily properties continue to enjoy strong demand, as high home prices and mortgage rates are making it necessary for many people to continue to rent. Meanwhile, robust growth in e-commerce is fueling demand for warehouses and other types of industrial real estate.
Even within office real estate, we are likely to see more bifurcation in the market over the next several years, which should paint a clearer picture for investors and uncover the buildings that can keep tenants and sustain rents.
Historical trends suggest owners of high-quality offices — who know how to attract tenants and have the money to maintain the buildings — should be able to continue to borrow. This divergence happened with malls over the past 10 years, when the valuations of most large malls were hit hard but the highest quality mall real estate investment trusts (REITs) repositioned themselves and continued to attract tenants. Over time, non-agency CMBS valuations should begin to reflect this differentiation.
U.S. banking stress has had varied impacts
One of the biggest concerns for CMBS investors this year has been the stress in the banking system south of the border. It’s estimated that, over the past decade, smaller banks have increased their market share in commercial real estate lending to around 40%, which could leave borrowers more vulnerable to a change in bank sentiment or regulations. While Canadian banking exposure to commercial real estate is small in comparison to U.S. exposure, the recent bank failures south of the border have also sent a chill through Canada’s Big-6 banks. Heading into earnings week near the end of May, analysts were expecting Canadian banks to report a rise in bad debt provisions and have highlighted commercial property loans as the cause.
Expectations have increased for banks to pull back lending in commercial real estate, particularly for office. Tightening standards by the banks could leave borrowers struggling to find options for refinancing, particularly at comparable interest rates or levels of leverage. Meanwhile, holders of loans that are near maturity will likely try to extend. These are two key risks for investors that may not have been fully priced into the market.
The degree of exposure to this risk differs depending on the property type. While office real estate is estimated to get more than 50% of its funding from banks, the percentage remains much lower for properties such as multifamily. With significant funding from governmental agencies, this backstop could provide multifamily properties with a greater level of protection from the impact of a pullback from the banks.
Bank lending differs across property types
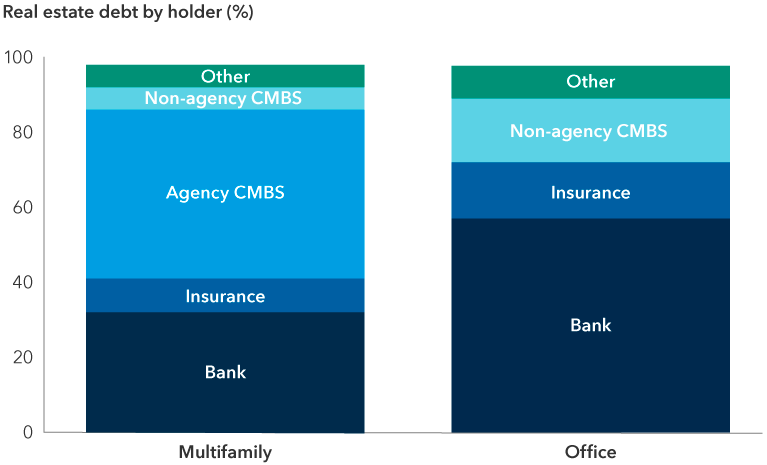
Sources: Bank of America Global Research, Federal Reserve, Mortgage Bankers Association, company 1Q 2023 earnings presentations. As of March 31, 2023. Other includes REIT, government and pensions. This breakdown is based on estimations of commercial real estate debt outstanding.
Uncovering opportunities in CMBS
The CMBS market is currently reflecting investors’ concerns about future losses in the office subsector across the board. However, there may be numerous ways to build exposure, on the view that much repricing has already taken place.
For example, across both conduit loans (pools of commercial mortgage loans) and single-asset single-borrower (SASB) loans, lower quality assets have experienced a particularly sharp sell-off, and if volatility persists, it is likely they will continue to be under the most stress. However, higher quality assets as well as securities higher up the capital stack — where we believe the structure can provide some cushion amid future volatility — appear to offer value.
The underlying assets are also important when analyzing CMBS. Conduit loans can have meaningful exposure to office real estate of varying quality. While attractive opportunities remain, SASB loans can give an investor a clearer view of the asset’s risk profile and potentially offer a greater level of diversification in a portfolio.
The market is pricing in continued concerns for non-agency CMBS
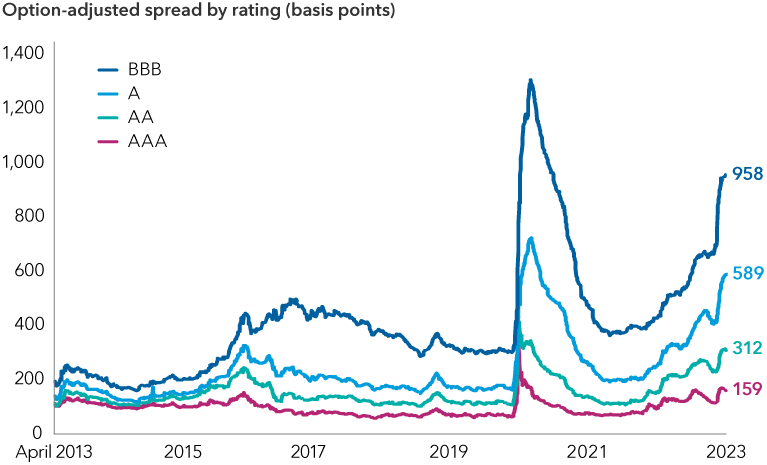
Source: Bloomberg. As of April 30, 2023. Data shown is the option-adjusted spreads for the subindices of the Bloomberg U.S. Non-Agency CMBS Investment Grade Index.
In closing, there is no doubt commercial real estate has hit a rough patch, given rapidly tightening lending from banks, high interest and mortgage rates and a slowing economy. This has a knock-on effect on the CMBS market.
That said, considering the repricing we have already seen across the quality spectrum in CMBS, and given the sustained positive fundamentals of a large section of the commercial real estate market, we see selective opportunities in this sector. Yields and spreads appear attractive, especially relative to corporate bonds, as well as in some other areas of the securitized market.
Investors seeking exposure to securitized debt may want to consider Capital Group Multi-Sector Income Fund™ (Canada). The securitized debt sector is one of four primary fixed income sectors in which the portfolio normally invests (the other three being high-yield corporate debt, investment-grade corporate debt and emerging market debt). The active mandate has the flexibility to move among credit sectors based on bottom-up research and portfolio manager outlook.
Learn more about
Xavier Goss is a portfolio manager for Capital Group Multi-Sector Income Fund (Canada).
The Bloomberg U.S. Corporate Investment Grade Index represents the universe of investment grade, publicly issued U.S. corporate and specified foreign debentures and secured notes that meet the specified maturity, liquidity, and quality requirements. This index is unmanaged, and its results include reinvested distributions but do not reflect the effect of sales charges, commissions, account fees, expenses or income taxes.
The Bloomberg U.S. Non-Agency CMBS Investment Grade Index represents a subset of the Bloomberg U.S. Aggregate Bond Index that includes eligible non-agency conduit and fusion commercial mortgage-backed securities deals, with a minimum current deal size of US$300mn and a rating of BBB/Baa or above. This index is unmanaged, and its results include reinvested distributions but do not reflect the effect of sales charges, commissions, account fees, expenses or income taxes.
Bank of America data reprinted by permission. Copyright © 2023 Bank of America Corporation (“BAC”). The use of the above in no way implies that BAC or any of its affiliates endorses the views or interpretation or the use of such information or acts as any endorsement of the use of such information. The information is provided "as is" and none of BAC or any of its affiliates warrants the accuracy or completeness of the information.
Our latest insights
RELATED INSIGHTS
-
Asset Allocation
-
-
Market Volatility
Commissions, trailing commissions, management fees and expenses all may be associated with investments in investment funds. Please read the prospectus before investing. Investment funds are not guaranteed or covered by the Canada Deposit Insurance Corporation or by any other government deposit insurer. For investment funds other than money market funds, their values change frequently. For money market funds, there can be no assurances that the fund will be able to maintain its net asset value per security at a constant amount or that the full amount of your investment in the fund will be returned to you. Past performance may not be repeated.
Unless otherwise indicated, the investment professionals featured do not manage Capital Group‘s Canadian investment funds.
References to particular companies or securities, if any, are included for informational or illustrative purposes only and should not be considered as an endorsement by Capital Group. Views expressed regarding a particular company, security, industry or market sector should not be considered an indication of trading intent of any investment funds or current holdings of any investment funds. These views should not be considered as investment advice nor should they be considered a recommendation to buy or sell.
Statements attributed to an individual represent the opinions of that individual as of the date published and do not necessarily reflect the opinions of Capital Group or its affiliates. This information is intended to highlight issues and not be comprehensive or to provide advice. For informational purposes only; not intended to provide tax, legal or financial advice. Capital Group funds are available in Canada through registered dealers. For more information, please consult your financial and tax advisors for your individual situation.
Forward-looking statements are not guarantees of future performance, and actual events and results could differ materially from those expressed or implied in any forward-looking statements made herein. We encourage you to consider these and other factors carefully before making any investment decisions and we urge you to avoid placing undue reliance on forward-looking statements.
The S&P 500 Composite Index (“Index”) is a product of S&P Dow Jones Indices LLC and/or its affiliates and has been licensed for use by Capital Group. Copyright © 2026 S&P Dow Jones Indices LLC, a division of S&P Global, and/or its affiliates. All rights reserved. Redistribution or reproduction in whole or in part are prohibited without written permission of S&P Dow Jones Indices LLC.
FTSE source: London Stock Exchange Group plc and its group undertakings (collectively, the "LSE Group"). © LSE Group 2026. FTSE Russell is a trading name of certain of the LSE Group companies. "FTSE®" is a trade mark of the relevant LSE Group companies and is used by any other LSE Group company under licence. All rights in the FTSE Russell indices or data vest in the relevant LSE Group company which owns the index or the data. Neither LSE Group nor its licensors accept any liability for any errors or omissions in the indices or data and no party may rely on any indices or data contained in this communication. No further distribution of data from the LSE Group is permitted without the relevant LSE Group company's express written consent. The LSE Group does not promote, sponsor or endorse the content of this communication. The index is unmanaged and cannot be invested in directly.
BLOOMBERG® is a trademark and service mark of Bloomberg Finance L.P. and its affiliates (collectively “Bloomberg”). Bloomberg or Bloomberg’s licensors own all proprietary rights in the Bloomberg Indices. Neither Bloomberg nor Bloomberg’s licensors approves or endorses this material, or guarantees the accuracy or completeness of any information herein, or makes any warranty, express or implied, as to the results to be obtained therefrom and, to the maximum extent allowed by law, neither shall have any liability or responsibility for injury or damages arising in connection therewith.
The MSCI information may only be used for your internal use, may not be reproduced or redisseminated in any form and may not be used as a basis for or a component of any financial instruments or products or indices. None of the MSCI information is intended to constitute investment advice or a recommendation to make (or refrain from making) any kind of investment decision and may not be relied on as such. Historical data and analysis should not be taken as an indication or guarantee of any future performance analysis, forecast or prediction. The MSCI information is provided on an “as is” basis and the user of this information assumes the entire risk of any use made of this information. MSCI, each of its affiliates and each other person involved in or related to compiling, computing or creating any MSCI information (collectively, the “MSCI Parties”) expressly disclaims all warranties (including, without limitation, any warranties of originality, accuracy, completeness, timeliness, non-infringement, merchantability and fitness for a particular purpose) with respect to this information. Without limiting any of the foregoing, in no event shall any MSCI Party have any liability for any direct, indirect, special, incidental, punitive, consequential (including, without limitation, lost profits) or any other damages. (www.msci.com)
Capital believes the software and information from FactSet to be reliable. However, Capital cannot be responsible for inaccuracies, incomplete information or updating of the information furnished by FactSet. The information provided in this report is meant to give you an approximate account of the fund/manager's characteristics for the specified date. This information is not indicative of future Capital investment decisions and is not used as part of our investment decision-making process.
Indices are unmanaged and cannot be invested in directly. Returns represent past performance, are not a guarantee of future performance, and are not indicative of any specific investment.
All Capital Group trademarks are owned by The Capital Group Companies, Inc. or an affiliated company in Canada, the U.S. and other countries. All other company names mentioned are the property of their respective companies.
Capital Group funds are offered in Canada by Capital International Asset Management (Canada), Inc., part of Capital Group, a global investment management firm originating in Los Angeles, California in 1931. Capital Group manages equity assets through three investment groups. These groups make investment and proxy voting decisions independently. Fixed income investment professionals provide fixed income research and investment management across the Capital organization; however, for securities with equity characteristics, they act solely on behalf of one of the three equity investment groups.
The Capital Group funds offered on this website are available only to Canadian residents.