Interest Rates
Categories
United States
Midyear Outlook: U.S. is set to boom, zoom and consume
 Darrell Spence
 Hilda Applbaum
 Chris Buchbinder
June 10, 2021
Remember that iconic photo signifying the end of World War II, with sailors kissing nurses in New York’s Times Square?
Don’t expect quite that much exuberance this year, but Americans are throwing open their doors, getting out of the house and starting to party like it’s 1945. To be sure, COVID remains a global public health threat and continues to spread in many countries. But in the U.S., consumers are spending again, and the American economy is awakening from its artificially induced slumber.
“We are seeing huge pent-up demand and are all likely to underestimate both its magnitude and duration,” says Chris Buchbinder, a portfolio manager for The Growth Fund of America®. “As we've seen in Israel, China and other countries, as you get the virus under control, new cases plummet and activity rises rapidly, so I expect the economic rebound we are seeing in the U.S. to ramp up dramatically.”
Thanks largely to rising consumer spending and trillions in government stimulus, U.S. gross domestic product rose an annualized 6.4% in the first three months of the year, and total U.S. economic output could return to pre-pandemic levels by the end of 2021, years ahead of earlier expectations.
In fact, the International Monetary Fund (IMF) expects 6.4% U.S. GDP growth for all of 2021 — more than double a January estimate of 3.1% after U.S. household income growth soared to a record 21.1% this March.
“The recovery always came down to whether there would be enough stimulus to sustain us through the shutdowns,” says Capital Group U.S. economist Darrell Spence. “And with the vaccine rollout compressing the time between stimulus and the functional end of COVID, we could see even stronger growth than the market expects today.”
Sitting on a cash stash
Indeed, many U.S. consumers — sitting on a cash stash and ready to spend it — have already begun to turbocharge the recovery. Aided by stimulus checks and a recovering jobs market, personal savings rates soared to 21% of disposable income in the first quarter of 2021. And there are indications that consumers, many of them fully vaccinated, are planning to use some of their stash to take long-delayed vacations or simply get out of the house and go to dinner. Bookings for domestic air travel and restaurant reservations placed through online service OpenTable have rebounded strongly.
“Our memories are marked by experiences and connectedness with other human beings, so I think travel and dining out will come roaring back,” says Hilda Applbaum, a portfolio manager and co-president of The Income Fund of America®. “But the market anticipated this. The question is, ‘Have any of these companies become even stronger because of COVID?’ ”
Many businesses in the travel and leisure industries did not take the pandemic pain standing still. Cruise lines like Royal Caribbean have established strict protocols to limit the spread of illness when sailing resumes. Companies like Hilton are buying more properties and streamlining operations. In food service, Darden, a multi-brand restaurant operator, adopted pickup service, online ordering and contactless payments.
“Some companies have used the crisis to innovate and improve,” Applbaum says. “I try to invest in those that are positioned to surpass the competition when the reopening picks up speed.”
Signs show U.S. consumers are getting out and spending
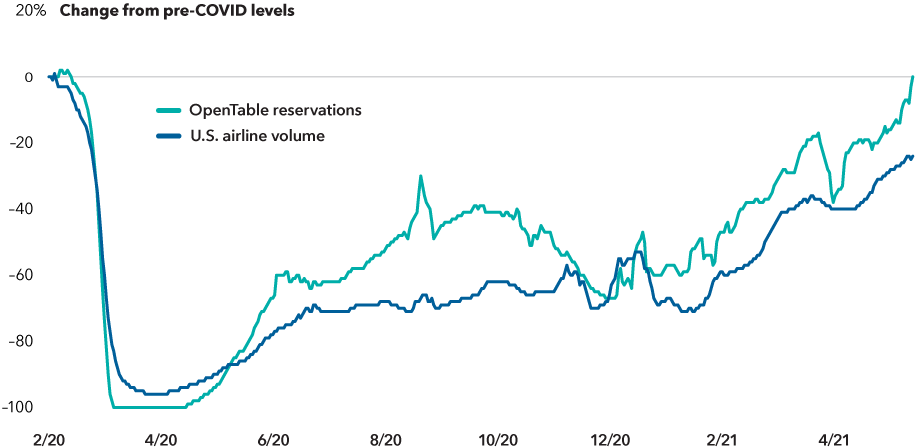
Sources: OpenTable, Transportation Security Administration. Airline volume represents number of U.S. passengers screened by TSA and uses 2/18/20 as the pre-COVID baseline. All data uses seven-day smoothed averages and is as of 5/31/21.
Established companies adapt to disruption
The vaccine rollout and reopening of the economy have also provided a figurative shot in the arm for many beaten down cyclical and value-oriented stocks. For the five months ended May 31, 2021, the Russell 1000 Value Index recorded an 18.4% total return, outpacing the 6.3% gain of the Russell 1000 Growth Index.
Investors want to know: Will this rotation toward value-oriented shares prove to be a lasting one?
“I do believe, as the economy opens up, more economically sensitive stocks will have their day in the sun,” says Applbaum. “And there are some value stocks that are good companies with good cash flows that can do well, but in this environment I am trying to be more discriminating.”
Many of the tech-savvy companies driving disruption have dominated headlines, but investors shouldn’t forget about old guard companies with the resources to compete and the drive to learn from their upstart competition.
Examples are everywhere. Retailers like Target, Costco and Home Depot are ramping up their digital operations to take on Amazon. And General Motors and Volkswagen are challenging Tesla in electric vehicles.
“One investment theme that will be interesting to watch this year is whether the empire strikes back — whether these legacy companies can innovate and execute in a fiercely competitive environment,” says Carl Kawaja, a portfolio manager for The Growth Fund of America. “I would not count out the incumbents.”
Old-guard companies in autos and retail are adapting to disruption
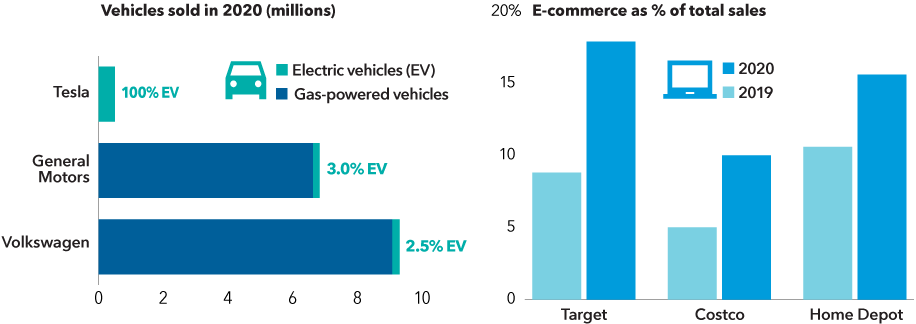
Sources: Capital Group, company financials, FactSet. General Motors sales includes SAIC-GM-Wuling joint venture. Target and Costco reflect fiscal year 2020 and 2019 sales. Home Depot reflects fourth quarter 2020 and fourth quarter 2019 sales.
Digital shifts continue to reshape U.S. economy
As for more growth-oriented stocks, shares of many leading digital businesses soared in 2020 but have languished in 2021. But longer term growth trends remain strong.
Digital payment technology, which accounted for 9% of total U.S. payments in 2019, accounted for 15% in 2020 — a 66% increase. Telemedicine, or online appointments, accounted for a fraction of total doctor visits prior to the pandemic, but about 20% of all visits in the early months of 2020. Will these behavioral shifts prove to be lasting?
“Growth may slow a bit in some areas, but I don’t believe we’ll see a reverse of these trends,” Buchbinder says. “For instance, many of the streaming companies are releasing new movies through their services at the same time they are in general release. When people physically return to theaters, will this practice stop? I don’t think so.”
Leading digital trends still have growth potential
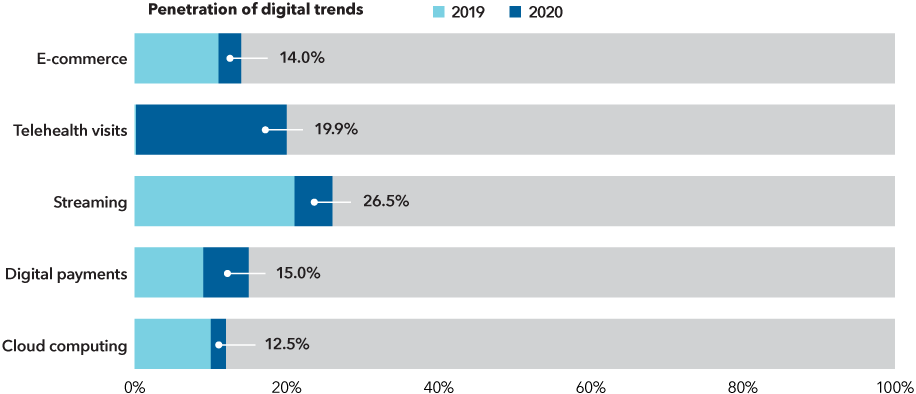
Sources: E-commerce = % of total U.S. retail sales (U.S. Census Bureau); telehealth visits = % of total primary care visits that were not in-person visits (U.S. Department of Health & Human Services, as of June 2020); streaming = % of time spent watching TV on streaming content (Nielsen, as of 3Q, 2020); digital payments = % of payments made with digital wallets (Statista); cloud computing = % of total IT spend on public cloud computing (Capital Group, IDC).
Inflation: The elephant in the room
While the velocity of the U.S. recovery has been remarkable, it has triggered supply shortages, inflation and investor worries that it can be sustained.
If you’re trying to buy lumber or a used car, you probably feel like inflation is out of control. "But inflation being sustained at these levels or higher certainly is not my base case," says Ritchie Tuazon, a portfolio manager for American Funds Inflation Linked Bond Fund®.
“We saw in April that inflation basically exceeded the Fed’s target,” Tuazon explains. “But this is not due to a virtuous labor demand-driven inflation cycle. It is due to reopening of the economy and supply bottlenecks, which are more temporary. While we should continue to see inflation volatility, and I am watching inflation very closely, I expect it to subside by the end of next year.”
If history is any guide, sharp increases in prices for raw industrial materials — copper, cotton, rubber, tallow and zinc, among others — generally do not have much impact on the Consumer Price Index (excluding food and energy), the most widely used gauge of long-term inflation.
Inflation has jumped but labor data suggests it may be temporary
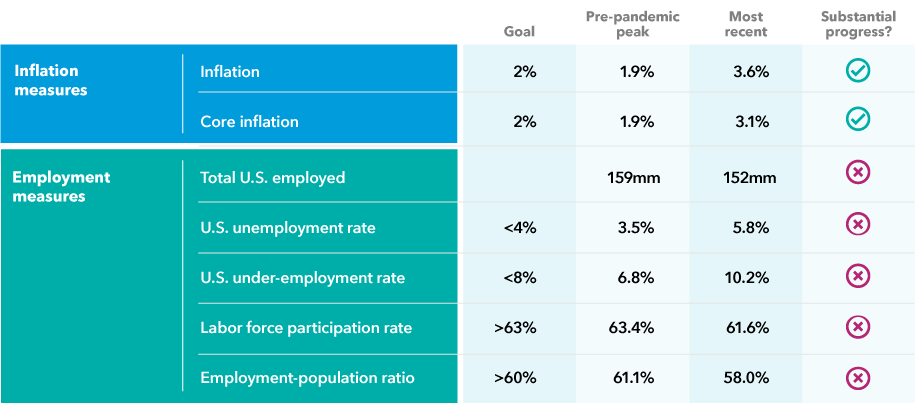
Sources: Bloomberg, Bureau of Economic Analysis, Bureau of Labor Statistics, Federal Reserve. Inflation data as of 4/30/21. Employment data as of 5/31/21. Pre-pandemic peak considers the trailing 12 months prior to February 2020. Inflation shown based on the Personal Consumption Expenditure Price Index, with core excluding energy and food. Under-employment rate consists of total unemployed, plus all persons marginally attached to the labor force, plus total employed part time for economic reasons.
Investment implications
Concerns about inflation and rising rates seem overblown. Yes, we are experiencing a near-term spike in inflation but it’s likely temporary. And the Fed appears in no hurry to implement rate hikes as near-term price volatility moderates.
Value or growth? Balance them both. There might be a temptation to shift from growth stocks to value investments, but there are opportunities to invest in growing companies that are cheap and cheap companies that grow. The key is selectivity.
Some incumbent companies in industries like autos, retail and entertainment are adapting to disruptive forces reshaping the American economy.
Learn more about
Indexes are unmanaged and, therefore, have no expenses. Investors cannot invest directly in an index.
The Russell 1000 Growth Index measures the results of the large-cap growth segment of the U.S. equity universe.
The Russell 1000 Value Index measures the performance of the large-cap value segment of the U.S. equity universe.
Bloomberg® is a trademark of Bloomberg Finance L.P. (collectively with its affiliates, “Bloomberg”). Barclays® is a trademark of Barclays Bank Plc (collectively with its affiliates, “Barclays”), used under license. Neither Bloomberg nor Barclays approves or endorses this material, guarantees the accuracy or completeness of any information herein and, to the maximum extent allowed by law, neither shall have any liability or responsibility for injury or damages arising in connection therewith.
London Stock Exchange Group plc and its group undertakings (collectively, the “LSE Group”). © LSE Group 2021. FTSE Russell is a trading name of certain of the LSE Group companies. FTSE® and Russell® indexes are trademarks of the relevant LSE Group companies and are used by any other LSE Group company under license. All rights in the FTSE Russell indexes or data vest in the relevant LSE Group company which owns the index or the data. Neither LSE Group nor its licensors accept any liability for any errors or omissions in the indexes or data and no party may rely on any indexes or data contained in this communication. No further distribution of data from the LSE Group is permitted without the relevant LSE Group company’s express written consent. The LSE Group does not promote, sponsor or endorse the content of this communication.
Investments are not FDIC-insured, nor are they deposits of or guaranteed by a bank or any other entity, so they may lose value.
Investors should carefully consider investment objectives, risks, charges and expenses.
This and other important information is contained in the fund prospectuses and summary prospectuses, which can be obtained from a financial professional and should be read carefully before investing.
Statements attributed to an individual represent the opinions of that individual as of the date published and do not necessarily reflect the opinions of Capital Group or its affiliates. This information is intended to highlight issues and should not be considered advice, an endorsement or a recommendation.
All Capital Group trademarks mentioned are owned by The Capital Group Companies, Inc., an affiliated company or fund. All other company and product names mentioned are the property of their respective companies.
Use of this website is intended for U.S. residents only.
On or around July 1, 2024, American Funds Distributors, Inc. will be renamed Capital Client Group, Inc.
This content, developed by Capital Group, home of American Funds, should not be used as a primary basis for investment decisions and is not intended to serve as impartial investment or fiduciary advice.
For financial professionals only. Not for use with the public.