
Global Affairs
Iran war reminds investors that volatility is inevitable
It’s a truism that the financial markets are always grappling with scores of financial and political challenges. But even by that standard, investors are barraged with a lot these days — uncertainty over tariffs, unknown effects from AI and, most dramatically, the likelihood of economic repercussions from the Iran war that are likely to persist regardless of the path that conflict takes.
The airstrikes that the U.S. and Israel launched in late February caused oil prices to jump and stock prices to wobble as markets assessed the implications for the production, storage and shipping of oil and liquefied natural gas (LNG). The conflict quickly spread to other countries and brought one of the world’s most important shipping lanes to a standstill.
The biggest concern remains the risk of a prolonged disruption to Middle East oil supplies that have ricocheted into the global economy. In the U.S., surging gas prices come against the backdrop of a soft job market and a falloff in consumer sentiment.
Nevertheless, the outlook appears much brighter when viewed through a wider lens. Despite a decline in the first quarter, U.S. and international stock indices are still up sharply over the past 12 months. Market leadership has continued to broaden behind the handful of technology behemoths at the forefront of the artificial intelligence (AI) race, with foreign markets, value stocks and defensive sectors flashing reasons for optimism.
Record-high U.S. stock concentration has been easing
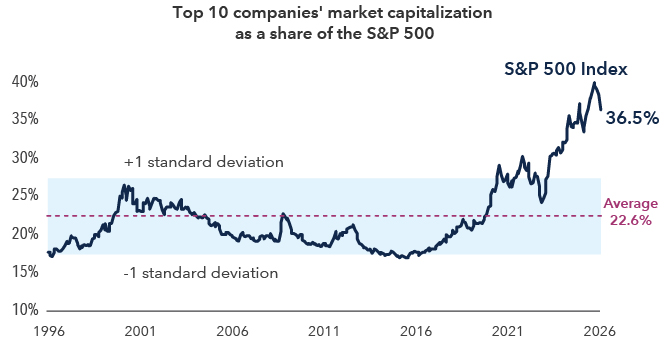
Sources: Capital Group, Morningstar, MSCI, Standard & Poor's. Figures represent the sum of the top 10 largest holdings of each index on a monthly basis. As of March 31, 2026.
Regardless of the immediate direction of geopolitical news or market dynamics, the recent volatility offers an important lesson for investors: Don’t overreact to short-term events, even those that look world changing in the moment. Remain disciplined and diversified in pursuit of a carefully created wealth plan. And remember that past markets have eventually gone on to new heights — with turnarounds often coming suddenly, though what has happened in the past is not predictive of future events.
The Iran war roiled oil markets with little warning.
Initially, hopes were high that the conflict with Iran would be limited. Previous clashes had been brief, such as the 2025 bombing of Iran’s nuclear facilities and the 2020 killing of a senior Iranian military leader. But optimism waned as hostilities dragged on.
For markets, the pertinent issues include the significant destruction that’s been wrought — to physical infrastructure, global relations and trust in regional shipping lanes — and how long it will take to repair (or at least sufficiently patch over) the damage. The ultimate impact is unclear, and it could take months or years to restart some of the region’s operations.
The conflict also underscored the persistent economic risks associated with the Persian Gulf. This year’s shock is nowhere as pronounced as the oil embargoes that stranded motorists in the 1970s, partly because the United States has gone from an energy importer to the world’s largest oil producer and a notable exporter. Still, the interconnected nature of the global energy market means that a kink in one part of the chain pushes up gas prices throughout the world.
Case in point: the Strait of Hormuz, the major shipping route along Iran’s southern border, hosts about a quarter of seaborne oil shipments and about 20% of all LNG shipments. Iran demonstrated that it could effectively blockade the passage despite U.S. and Israeli efforts, giving it significant leverage over the global economy. That the U.S. moved to blockade the strait simply underlines the point — a significant chunk of the world’s petroleum supply can be throttled with little apparent recourse.
Other sources of volatility may keep uncertainty high in the short term.
Even before the Iran conflict, the start to this year was likely to be subdued because of the midterm elections in November. Historically, non-presidential election years have experienced higher volatility.
The good news is that midterm years have often experienced a postelection upturn. A Capital Group analysis of the S&P 500 from 1931 through 2025 showed that U.S. stocks on average enjoyed a 4- to 5-percentage point bump in the last two months of midterm years. That was regardless of election outcome; markets cared less about who won than about political and policy clarity.
There are other potential sources of optimism. While oil shocks can be economically damaging, their impact has often been relatively short-lived. We examined several oil shocks over the last five decades and found that gas-price spikes rarely lasted more than about half a year; a separate analysis of U.S. stocks since 1990, as represented by the S&P 500, showed that they largely rebounded from such events within a year.
And it’s important to remember that the Federal Reserve is still in an interest-rate-cutting cycle. When the Fed trimmed rates during nonrecessionary periods — the environment we find ourselves in today — stocks rose an average of nearly 28% over the course of the cycle. And the current cycle, which began in September 2024, might still have some legs — the market is forecasting rates will continue to fall through 2027.
Oil prices have historically fallen after spikes
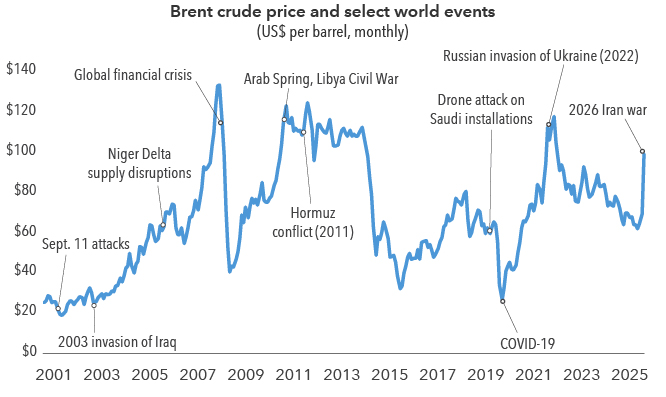
Sources: St. Louis Federal Reserve, Capital Group. Chart reflects average monthly prices at the beginning of each month from March 2001 through March 2026. As of March 31, 2026.
The best path for long-term investors has often been to stick to their wealth plan.
Geopolitical disturbances can give investors pause, but it’s important to put them in context. The Russian invasion of Ukraine in 2022 initially caused oil prices to surge to nearly $130 a barrel. That conflict is still ongoing, but oil prices fell back to precrisis levels in relatively short order. Investors who went to cash in response to that war would have missed three banner years, as demonstrated by returns in the S&P 500.
Disruptions aren’t just part of investing — they’re part of life. The world is always changing; new technologies are always being developed. Thus far, markets have always been able to adapt, and a well-constructed portfolio can help investors participate in up markets while potentially mitigating the impacts of down markets.
Explore topics
Global Affairs
Energy
Indexes are unmanaged and, therefore, have no expenses. Investors cannot invest directly in an index. Past results are not predictive of results in future periods.
S&P 500 Index is a market capitalization-weighted index based on the results of approximately 500 widely held common stocks. This index is unmanaged, and its results include reinvested dividends and/or distributions but do not reflect the effect of sales charges, commissions, account fees, expenses or U.S. federal income taxes.
Each S&P Index (“Index”) shown is a product of S&P Dow Jones Indices LLC and/or its affiliates and has been licensed for use by Capital Group. Copyright © 2026 S&P Dow Jones Indices LLC, a division of S&P Global, and/or its affiliates. All rights reserved. Redistribution or reproduction in whole or in part is prohibited without written permission of S&P Dow Jones Indices LLC.
Related insights
-
-
U.S. Federal Reserve
-
Economic Indicators