
Market Volatility
Iran war: Don’t let gas prices drive your decisions
 Ed Gonzalez
April 28, 2026
Markets have encountered any number of shocks in the past 12 months, including the imposition of sweeping tariffs and the forceful removal of Venezuela’s president. But from the start, the Iran war tested investor resolve.
The sudden airstrikes that opened the conflict on February 28 sent indices reeling and oil prices soaring. The fighting damaged petroleum production and transport infrastructure. Iran’s blockade of the Strait of Hormuz, the major shipping route that abuts its southern border, threw the global oil market into particular chaos. Not surprisingly, gas prices jumped in the U.S., a feared front-runner to higher inflation, slower consumer spending and stunted economic growth.
Times like these can be unnerving for investors, partly because they raise uncertainty over how long a disruption might last, whether it might flare again and how much that might impinge on markets.
The natural impulse during geopolitical strife can be to alter a wealth plan on the assumption that long-term conditions have changed. But it’s essential to put volatility in historical context. Quite frankly, this isn’t the first time external turmoil has caused markets to miss a step, and it almost certainly won’t be the last. Nevertheless, markets have rebounded and gone on to new highs in every instance thus far.
“There’s always something to worry about in the economy, politics or the world at large,” says Capital Group Private Client Services portfolio specialist Ed Gonzalez. “In just the past 15 years, we’ve lived through the European debt crisis and the COVID pandemic. Yet, over that period, international stocks returned more than 9% a year on average.*”
Of course, past events don’t predict the future. Still, history can inform our sense of how markets might react to recent events, including rocketing oil prices. A Capital Group analysis of 10 energy shocks associated with geopolitical events since 1973 showed that oil prices have tended to stabilize near or below precrisis levels within 180 days. That was true for relatively short-lived crises, such as the Gulf War in 1990, and for yearslong upheavals, such as the ongoing Russian invasion of Ukraine that began in February 2022.
Additionally, markets were often quick to rebound after oil supply disruptions. A separate analysis of the S&P 500 showed that, across seven events that affected oil prices since 1990, U.S. stocks grew an average of 12% a year after the inciting incident. Even more profoundly, after two years the index had erased its losses in each instance, sporting average cumulative growth of 32.3%.
Impacts of oil shocks have been short lived
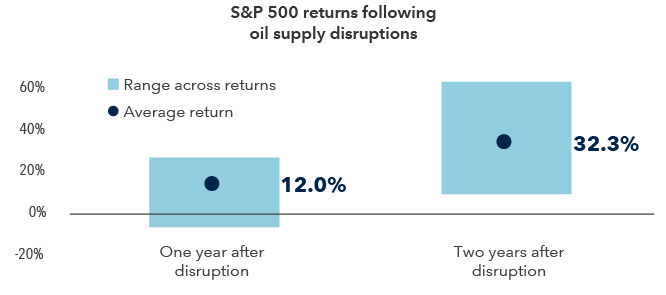
Sources: Bloomberg, Standard & Poor's, Capital Group. The following oil shock events are used: Gulf War (August 1990), 2003 U.S. invasion of Iraq (March 2003), Niger Delta supply disruptions (February 2006), Arab Spring and Libyan Civil War (February 2011), Hormuz closure risk and Iranian sanctions (December 2011), Drone attack on Saudi installations (September 2019) and the Russian invasion of Ukraine (February 2022). Event dates are aligned to the nearest observable market price. If an event occurs on a non-trading day, the prior trading day is used as the start date. As of March 31, 2026.
Beyond these, it’s also crucial to understand the general risks associated with attempting to time the market. Selling after a dip locks in losses, and staying on the sidelines means missing out on any subsequent rebounds. Rallies can come unexpectedly, with powerful bursts on a comparative handful of days. Thus, missing just a few days of strong gains can deeply compromise overall returns, particularly for investors with long-term horizons.
“The truth is that timing the market is notoriously difficult,” Gonzalez adds. “And it comes with a huge risk: Missing just a handful of the best days can cost you dearly.”
Trying to time the market could be costly

Sources: RIMES, Standard & Poor's. As of December 31, 2025.
Energy-related volatility has tended to be short-lived and fickle.
Oil price shocks have often boosted energy stocks. However, history would suggest that they are not a panacea.
As described above, most geopolitical-related oil price spikes reversed within six months. In fact, of the 10 events surveyed, only two appeared to have lingering price effects. The three instances that pushed oil past $100 a barrel were all relatively short-lived, with prices retreating to, or below, precrisis levels within 180 days. That includes Russia’s 2022 invasion of Ukraine, which initially caused oil to surge to nearly $128 a barrel. Prices returned to their initial levels despite the ongoing conflict and embargos.
That might explain why energy companies rarely enjoyed sustained gains during these periods. he energy sector, both in the U.S. and internationally, tended to outpace the global market as prices rose. In the month before prices peaked, the energy sector — both domestically, as measured by the MSCI USA Index, and internationally, as measured by the MSCI All Country World Index (ACWI) ex-USA — beat the global MSCI ACWI. But the sector's fortunes tended to fall alongside energy prices. In the year after oil prices peaked, both measures of the sector lagged the global index on average by more than 11%.
Additionally, timing the market carries risks even in less volatile periods.
Selling in a down market crystallizes on-paper losses, which can be risky enough. But it also puts investors in a position of having to re-enter the market, preferably before a rally. That’s extremely tricky, and is complicated by the way that markets have historically rebounded. While broad markets have always bounced back from disruptions over time, they have rarely done so smoothly. Rather, they’ve often risen in spurts — spiky returns that are hard to predict and easy to miss out on. Consider: Over the decade ended December 31, 2025, a hypothetical investment in the S&P 500 Index that missed the best 10 days — that is, a mere 0.39% of trading days — would have been worth barely more than half of one that was 100% invested over that time frame.
Staying invested means participating in any market surges along the way, and doing so without the stress of wondering when to re-enter. That’s why we believe so strongly in diversification and spreading out investments across industry and geography, with a focus on high-quality companies in which our analysts and portfolio managers have high conviction. We believe this is the best way to pursue long-term financial goals.
* International stocks represented by MSCI All Country World Index (ACWI). As of March 31, 2026.
Explore topics
Indexes are unmanaged and, therefore, have no expenses. Investors cannot invest directly in an index. Past results are not predictive of results in future periods.
MSCI All Country World Index is a free-float-adjusted market-capitalization-weighted index that is designed to measure equity market results in the global developed and emerging markets, consisting of more than 40 developed- and emerging-market country indexes. When applicable, results through December 31, 2000, reflect dividends gross of withholding taxes, and dividends net of withholding taxes thereafter. This index is unmanaged, and its results include reinvested dividends and/or distributions but do not reflect the effect of sales charges, commissions, account fees, expenses or U.S. federal income taxes.
MSCI USA Index is a free float-adjusted, market capitalization-weighted index that is designed to measure the U.S. portion of the world market. This index is unmanaged and includes reinvested dividends and/or distributions, but does not reflect sales charges, commissions, expenses, or taxes. Results reflect dividends gross of withholding taxes.
S&P 500 Index is a market capitalization-weighted index based on the results of approximately 500 widely held common stocks. This index is unmanaged, and its results include reinvested dividends and/or distributions but do not reflect the effect of sales charges, commissions, account fees, expenses or U.S. federal income taxes.
Source: MSCI. The MSCI information may only be used for your internal use, may not be reproduced or redisseminated in any form and may not be used as a basis for or a component of any financial instruments or products or indices. None of the MSCI information is intended to constitute investment advice or a recommendation to make (or refrain from making) any kind of investment decision and may not be relied on as such. Historical data and analysis should not be taken as an indication or guarantee of any future performance analysis, forecast or prediction. The MSCI information is provided on an “as is” basis and the user of this information assumes the entire risk of any use made of this information. MSCI, each of its affiliates and each other person involved in or related to compiling, computing or creating any MSCI information (collectively, the “MSCI Parties”) expressly disclaims all warranties (including, without limitation, any warranties of originality, accuracy, completeness, timeliness, non-infringement, merchantability and fitness for a particular purpose) with respect to this information. Without limiting any of the foregoing, in no event shall any MSCI Party have any liability for any direct, indirect, special, incidental, punitive, consequential (including, without limitation, lost profits) or any other damages. (www.msci.com)
Each S&P Index (“Index”) shown is a product of S&P Dow Jones Indices LLC and/or its affiliates and has been licensed for use by Capital Group. Copyright © 2026 S&P Dow Jones Indices LLC, a division of S&P Global, and/or its affiliates. All rights reserved. Redistribution or reproduction in whole or in part is prohibited without written permission of S&P Dow Jones Indices LLC.
Related insights
-
-
U.S. Federal Reserve
-
Economic Indicators