Technology & Innovation
 Brad Olalde
 Steven Sperry
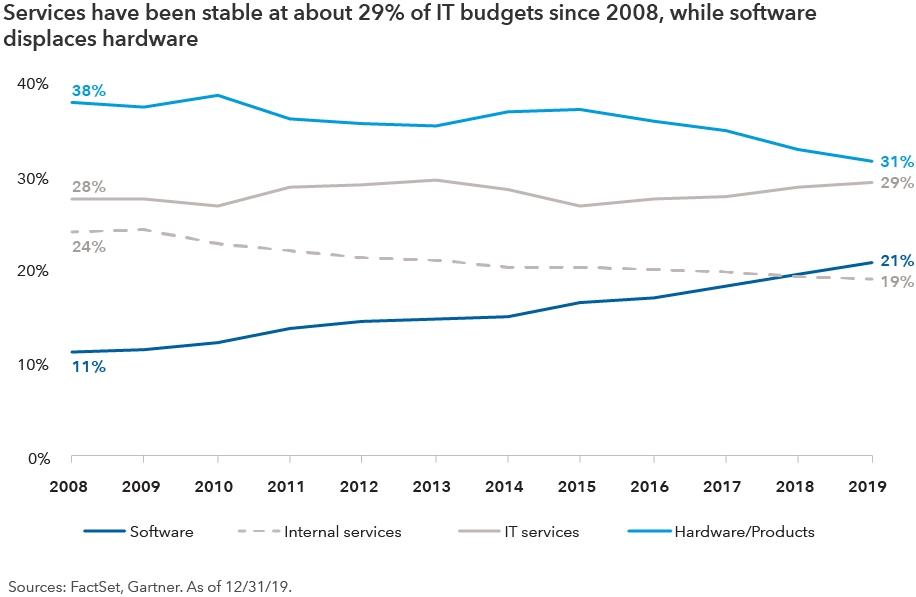
1) Subscription model is becoming the norm as cloud computing spreads
Cloud computing has become increasingly widespread in recent years. One of the byproducts of the shift to the cloud is that software has matured from a one-size-fits-all product released in cycles, into a cloud-based, customized, continuously evolving set of solutions that companies monetize through subscription-based models. That has allowed developers to design products that are a better fit for clients, build a stable subscriber base, and increase efficiency and productivity. For the software providers, this translates into a recurring revenue stream that is more stable than the lumpiness of capital expenditure cycles that happened every few years.
The fastest growing form of cloud computing is Infrastructure as a Service (IaaS), which refers to cloud-based resources that help establishments build and manage servers, networks, operating systems and data storage. The popularity of IaaS stems from organizations’ ability to administer their software requirements and infrastructure as they expand. Better yet, it allows companies to manage their hardware needs without hosting any of the infrastructure. The largest providers of cloud computing — Amazon’s Amazon Web Services (AWS), Microsoft’s Azure, and Google’s Cloud Platform — are well-known. Cloud computing was not the core business of any of these three firms, but their growth in this area has been hugely accretive to their stock price and is likely to remain a growth driver.
The other rapidly growing area is Software as a Service (SaaS). SaaS denotes cloud-based software that is hosted online by a software provider, is available for purchase via a subscription-based model and delivered through the internet. SaaS is the most common cloud service and is often accessible through convenient online platforms that allow employees and companies easy access to productivity-enhancing tools.
Meanwhile, Adobe, an industry leader in digital marketing solutions through its Creative Cloud, is another interesting case study on the evolution of Software as a Service. The company was able to reduce the cyclicality of its revenues (previously tied to volatile marketing budgets) by adopting a subscription/cloud model for its creative software services such as Photoshop and Illustrator. And what Adobe is for creative, Autodesk is for architecture, construction and industrial design firms. Autodesk’s transition to a subscription model could benefit the firm in the long term, as it continues to provide software solutions for the industries it serves.
In the human resources and payroll space, Workday is changing how HR and human capital are managed within an enterprise through cloud-based software solutions for finances, payroll, time management and recruiting. Companies like RingCentral provide cloud-based communication services, allowing enterprises to move all their voice and video interactions onto one digital platform.
Fintech and e-commerce are other areas ripe for cloud computing — a trend that has benefited Shopify. The company provides tools to create e-commerce stores with services for everything from website design, marketing and shipping, as well as payment processing and merchant solutions. This allows even the smallest of sellers to move their businesses online and possibly thrive in the era of physical distancing.
2) Digitization of entertainment: Streaming and gaming lead the way
Online entertainment, demand for which accelerated amid the global COVID-19 lockdowns, is expected to remain high as viewer habits become more permanent. Netflix added more than 26 million new subscribers in the first half of 2020, bringing the global total to over 193 million. The firm also spent more than US$15 billion on content in 2019, placing it third among studios/streaming providers. A projected growth rate of more than 10% in spending in 2020 (likely delayed due to COVID-19) means that the company may grow its lead over many streaming and traditional rivals in terms of original content.
The adoption of online gaming also quickened during the lockdowns. Video game companies benefited from accelerated demand similar to what is usually seen during the holidays. Twitch, Amazon’s e-game livestreaming platform, saw 100% year-on-year growth in hours watched in April, to 1.65 billion. That compares favourably to the 2018 NFL season monthly average of 1.6 billion hours watched. Twitch also reached a record number of concurrent viewers (4.3 million).
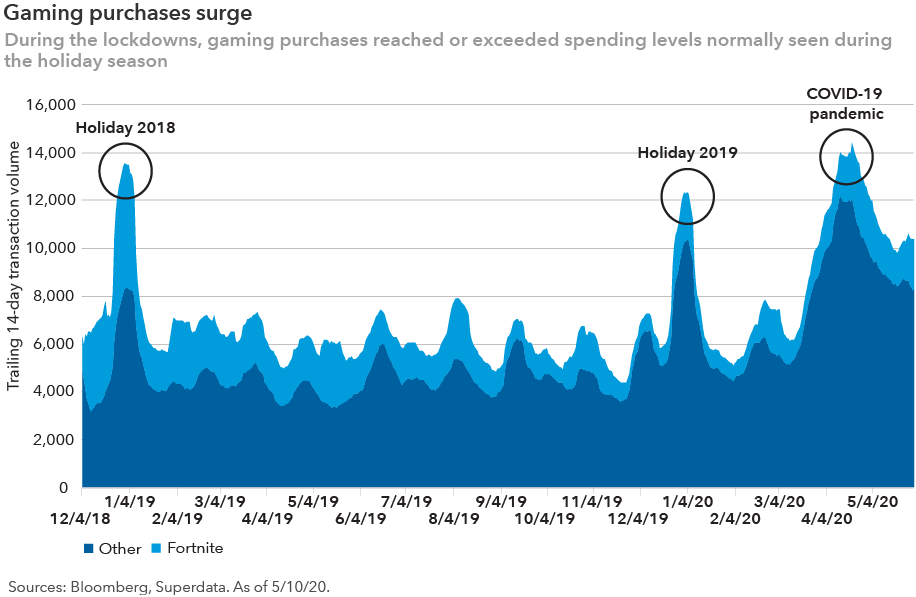
This strong performance was shared across other gaming platforms. China’s Tencent — the world’s largest gaming company by revenue — reached record daily spending and daily active users (DAU) for its games Honor of Kings and Peacekeeper Elite (approximately 200 million DAU combined) during Chinese New Year. Nintendo saw record Switch console sales in March, while Steam marked a record number of concurrent players (24 million).
Looking at China as a guide to future trends, daily users specific to Tencent declined as people returned to work. Interestingly, however, time spent on gaming has remained higher than levels seen before COVID-19 struck. People who became more financially and emotionally invested in their gaming during the pandemic-related lockdown have continued playing even as physically experiential activities opened back up. There’s also a social element to the games, particularly on mobile devices, that has added to their lasting attractiveness — in and beyond the lockdown period.
Gaming remains one of the least expensive forms of consumer entertainment, with significant potential to capture a greater share of discretionary spending. Moreover, several analysts anticipate that the shift to digital entertainment may improve content holder profitability. However, cloud gaming — which provides access to any game, anywhere, on any device — has emerged as the next major platform in video games, and we continually assess which firms might be the beneficiaries of this shift.
3) Social distancing is accelerating the embrace of new technologies in service industries
Social distancing is accelerating the adoption of new technologies, especially in the service industries. Those that were early adopters have been better positioned to weather the periods of lockdown that began in March. A good example is tech-savvy Domino’s Pizza. It was an early adopter of digitization technologies such as app-based ordering, online tracking, user profiles and voice ordering. The pizza maker’s digital business has grown rapidly and now accounts for about 65% of its orders. The system has been attracting new users that the company can convert into loyalty members. Even traditional fast food companies such as McDonald’s are using delivery platforms such as UberEats and transitioning to an at-home delivery model in addition to their traditional drive-through and restaurant services.
Similarly, in grocery, a nearly US$700 billion-a-year industry in the United States, technology and e-commerce companies are changing the landscape through innovative product and service offerings. With Amazon’s purchase of Whole Foods in 2017 and subsequent expansion of grocery delivery to its massive installed base of more than 110 million U.S. Prime members, the e-commerce giant was better positioned for the surge in online grocery demand brought about by the pandemic. Amazon’s online grocery sales in the second quarter of 2020 tripled year over year. While the accelerated pace of the change is largely due to social distancing measures imposed in many cities and states earlier this year, the shift remains a positive trend for what has been one of the most stubbornly brick-and-mortar industries.
Britain’s Ocado also exemplifies innovation in the grocery industry. Originally an online grocery delivery service, Ocado has expanded its expertise in online retail software, robotics, and warehouse management to global partnerships expanding the online and delivery presence for some of the largest global retailers. This involves building specialized customer fulfillment centres based on the company’s automated technology for partners including Kroger in the U.S., Casino in France, and Aeon in Japan, among others. Having invested in technology over the past few years, Ocado was poised to benefit as consumers sped up their adoption of online grocery shopping. The company posted a 40% increase in sales year over year as of the end of May. It also has a waiting list of customers for service in its U.K. home market.
4) Low-tech industries are also expanding the use of new technologies
A good example of the expansion of technology in a traditionally low-tech industry is waste management. Route optimization software, automated trucks and robotics are being increasingly used to obtain greater operating and capital efficiencies. The waste industry was historically very low-tech — all you needed was a driver and a truck. Paper maps with routes drawn over them were commonly used. But in the last few years, technology has driven meaningful changes to firms’ operating models — lowering costs and increasing customer touchpoints as well as retaining and capturing incremental revenue.
Some examples of this technology implementation include:
- Route optimization software: The first order impact is fleet, fuel and driver efficiency. Paired with an onboard camera, it has driven more powerful improvements to the business model: driver accountability, providing time stamps and photos to refute erroneous missed pickup claims, and more efficient swapping of relief drivers.
- Customer engagement tools and/or apps: By upgrading communication with customers and providing them with seamless billing, the waste sector has improved retention rates, reduced the need for call centres, and created an easier buying experience (similar to changes implemented by the airlines).
5) Automation of factories and supply chains is on the rise
China has long been the predominant manufacturing base for the global economy. However, the combination of rising labour costs over the past decade, trade tensions with the U.S. and heightened travel restrictions due to the pandemic has led some multinationals to examine their supply chain concentration and seek ways to diversify.
As companies build new factories and upgrade existing ones, automation is likely to gain momentum. Japanese automation companies such as Keyence and SMC could be key beneficiaries of this trend, as both have global footprints, strong industry positions and plenty of cash on their balance sheets to help weather a prolonged downturn. Additionally, Keyence has diverse product offerings from sensors, to machine vision, to 3D printing, all of which may help power automation across many different industries. SMC’s global footprint could be an advantage as its customers look to build new factories to diversify their supply chains.
Conclusion
On a long-term basis, COVID-19 has widened the moat for many market leaders with scale, incumbent relationships and strong digital capabilities. But smaller specialized players (such as Zoom and Shopify) have gained prominence as demand for their services has increased. While the spread of COVID-19 has resulted in many companies putting the brakes on IT spending, it has also created a longer-term imperative for enterprises to accelerate their digital transformation efforts.
These transformations are occurring both inside and outside the technology sector. The key trends that we expect to gain momentum even as we return to a more normal post-COVID world are: 1. The shift to cloud computing; 2. The digitization of entertainment and the expansion of online gaming; 3. Adoption of new technologies in service industries; 4. Low-tech industries turning to technology solutions for logistics; and 5. the automation of factories as manufacturing diversifies outside of China.
Our latest insights
-
-
Currencies
-
Market Volatility
-
Market Volatility
-
Markets & Economy
RELATED INSIGHTS
Commissions, trailing commissions, management fees and expenses all may be associated with investments in investment funds. Please read the prospectus before investing. Investment funds are not guaranteed or covered by the Canada Deposit Insurance Corporation or by any other government deposit insurer. For investment funds other than money market funds, their values change frequently. For money market funds, there can be no assurances that the fund will be able to maintain its net asset value per security at a constant amount or that the full amount of your investment in the fund will be returned to you. Past performance may not be repeated.
Unless otherwise indicated, the investment professionals featured do not manage Capital Group‘s Canadian investment funds.
References to particular companies or securities, if any, are included for informational or illustrative purposes only and should not be considered as an endorsement by Capital Group. Views expressed regarding a particular company, security, industry or market sector should not be considered an indication of trading intent of any investment funds or current holdings of any investment funds. These views should not be considered as investment advice nor should they be considered a recommendation to buy or sell.
Statements attributed to an individual represent the opinions of that individual as of the date published and do not necessarily reflect the opinions of Capital Group or its affiliates. This information is intended to highlight issues and not be comprehensive or to provide advice. For informational purposes only; not intended to provide tax, legal or financial advice. Capital Group funds are available in Canada through registered dealers. For more information, please consult your financial and tax advisors for your individual situation.
Forward-looking statements are not guarantees of future performance, and actual events and results could differ materially from those expressed or implied in any forward-looking statements made herein. We encourage you to consider these and other factors carefully before making any investment decisions and we urge you to avoid placing undue reliance on forward-looking statements.
The S&P 500 Composite Index (“Index”) is a product of S&P Dow Jones Indices LLC and/or its affiliates and has been licensed for use by Capital Group. Copyright © 2025 S&P Dow Jones Indices LLC, a division of S&P Global, and/or its affiliates. All rights reserved. Redistribution or reproduction in whole or in part are prohibited without written permission of S&P Dow Jones Indices LLC.
FTSE source: London Stock Exchange Group plc and its group undertakings (collectively, the "LSE Group"). © LSE Group 2025. FTSE Russell is a trading name of certain of the LSE Group companies. "FTSE®" is a trade mark of the relevant LSE Group companies and is used by any other LSE Group company under licence. All rights in the FTSE Russell indices or data vest in the relevant LSE Group company which owns the index or the data. Neither LSE Group nor its licensors accept any liability for any errors or omissions in the indices or data and no party may rely on any indices or data contained in this communication. No further distribution of data from the LSE Group is permitted without the relevant LSE Group company's express written consent. The LSE Group does not promote, sponsor or endorse the content of this communication. The index is unmanaged and cannot be invested in directly.
BLOOMBERG® is a trademark and service mark of Bloomberg Finance L.P. and its affiliates (collectively “Bloomberg”). Bloomberg or Bloomberg’s licensors own all proprietary rights in the Bloomberg Indices. Neither Bloomberg nor Bloomberg’s licensors approves or endorses this material, or guarantees the accuracy or completeness of any information herein, or makes any warranty, express or implied, as to the results to be obtained therefrom and, to the maximum extent allowed by law, neither shall have any liability or responsibility for injury or damages arising in connection therewith.
The MSCI information may only be used for your internal use, may not be reproduced or redisseminated in any form and may not be used as a basis for or a component of any financial instruments or products or indices. None of the MSCI information is intended to constitute investment advice or a recommendation to make (or refrain from making) any kind of investment decision and may not be relied on as such. Historical data and analysis should not be taken as an indication or guarantee of any future performance analysis, forecast or prediction. The MSCI information is provided on an “as is” basis and the user of this information assumes the entire risk of any use made of this information. MSCI, each of its affiliates and each other person involved in or related to compiling, computing or creating any MSCI information (collectively, the “MSCI Parties”) expressly disclaims all warranties (including, without limitation, any warranties of originality, accuracy, completeness, timeliness, non-infringement, merchantability and fitness for a particular purpose) with respect to this information. Without limiting any of the foregoing, in no event shall any MSCI Party have any liability for any direct, indirect, special, incidental, punitive, consequential (including, without limitation, lost profits) or any other damages. (www.msci.com)
Capital believes the software and information from FactSet to be reliable. However, Capital cannot be responsible for inaccuracies, incomplete information or updating of the information furnished by FactSet. The information provided in this report is meant to give you an approximate account of the fund/manager's characteristics for the specified date. This information is not indicative of future Capital investment decisions and is not used as part of our investment decision-making process.
Indices are unmanaged and cannot be invested in directly. Returns represent past performance, are not a guarantee of future performance, and are not indicative of any specific investment.
All Capital Group trademarks are owned by The Capital Group Companies, Inc. or an affiliated company in Canada, the U.S. and other countries. All other company names mentioned are the property of their respective companies.
Capital Group funds are offered in Canada by Capital International Asset Management (Canada), Inc., part of Capital Group, a global investment management firm originating in Los Angeles, California in 1931. Capital Group manages equity assets through three investment groups. These groups make investment and proxy voting decisions independently. Fixed income investment professionals provide fixed income research and investment management across the Capital organization; however, for securities with equity characteristics, they act solely on behalf of one of the three equity investment groups.
The Capital Group funds offered on this website are available only to Canadian residents.