Market Volatility
Categories
Economic Indicators
Why the next economic recovery may be stronger than expected
 Jared Franz
April 27, 2023
Three questions have weighed on investors’ minds for months: Will there be a recession? How bad will it be? And what comes next?
The U.S. Federal Reserve’s aggressive campaign of interest rate hikes to combat persistent inflation has amplified the risk of recession. Recent banking sector turmoil, which will likely result in tighter credit conditions, could further that risk.
“One reliable indicator of a recession is an inverted yield curve, where the yield on short-term U.S. Treasury bonds is higher than the yield on longer dated bonds,“ says U.S. economist Jared Franz. “Recent activity in bond markets suggests a recession is widely expected. In fact, this may be the most widely anticipated recession in decades.”
The inverted yield curve warns of recession risk
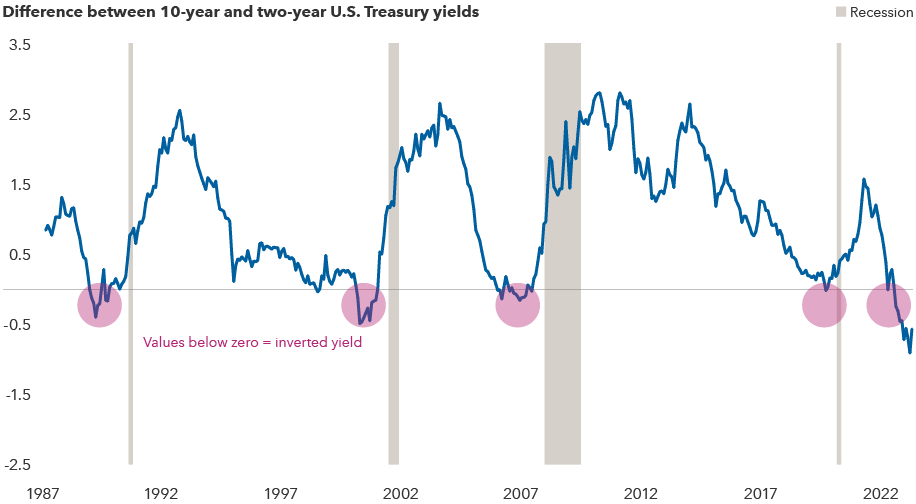
Sources: Capital Group, Bloomberg Index Services Ltd., National Bureau of Economic Research, Refinitiv Datastream. As of March 31, 2023.
While many investors are focused on the timing and severity of the next recession, Franz has turned his focus to longer term questions: What could be the catalysts for a subsequent recovery? And what are some of the implications of that recovery for investor portfolios?
“When an insight is widely held, it can be challenging to benefit from that insight, as it may already be priced into the market,” Franz says. “Instead, investors may be better served by preparing for what I believe will be a stronger than usual recovery, fueled by a healthy consumer sector.”
Here, Franz shares his expectations for recession and his perspective on a potential subsequent recovery.
Has the U.S. already entered a recession?
I believe we are on the edge of a recession. And with inflation still above the Fed’s 2% target and labour markets tight, the central bank still has work to do. Given the recent banking upheaval, I believe the Fed may temper its approach to rate increases, but I do believe it will be prepared to hike rates until inflation slows further.
I now expect a 1.0% decline in gross domestic product (GDP), or what would be considered a “mild” recession. That would be considerably milder than the 4.5% decline investors experienced during the global financial crisis (GFC) from 2007 to 2009, and closer to a more conventional recession. This is not to diminish the impact of recession on individuals. Recessions, no matter how mild, can be painful.
A weakening housing market is another risk factor. Sales fell in March, resulting in home price declines for a second straight month. But from here, I expect that prices may have a further 10% downside followed by a reacceleration. This will help limit any deterioration in household balance sheets, which may provide a boost to consumer confidence.
Canada’s recession watch
The consensus view among many Canadian economists is that Canada will enter recession in 2023. There’s also consensus that a Canadian recession will be similar to what is projected for the U.S.: short-lived with growth quickly resuming. According to the Conference Board of Canada (CBoC), an economic slowdown is on the horizon, but the country’s largest private economic analysis forecasting group stops short of declaring Canada will enter recession.
This despite the CBoC’s recession tracker reaching 95.0% in March and an inverted yield curve that indicates a dampening in investor sentiment and an intensified recession risk. But, as the board points out, just because the risk is high, it doesn’t mean that a recession will happen. The risk assessment, says the CBoC, gives them an idea of what the markets are saying but their results are driven by financial data and the Canadian business cycle — which could be approaching a trough over the next several months.
“A negative term spread usually precedes recessions, but this is not the golden rule,” says the CBoC, ”there have been instances where the yield curve inverted, but no recession occurred. Since the 10-year bond yield and 3-month treasury yield differential continued to decline, the recession risk tracker produced a higher probability of recession in March.”
Will the next recovery be stronger or weaker than prior ones?
If there is one, I believe there are two reasons a recovery will be stronger than prior cycles. First, there may not be a need for large-scale deleveraging like there was during the GFC. Because so many companies have been expecting economic weakness, businesses have taken action, delaying orders to work excesses out of the economy. So, while a recession is likely this year, I expect it to be somewhat shallow.
Second, the U.S. consumer sector is strong relative to past cycles. Healthy job markets, wage growth and household wealth should be key catalysts for a more robust recovery.
Certainly, the U.S. labour market has been softening recently, and a recession of any magnitude will likely drive unemployment higher as companies announce layoffs. But the labour market has shown continued strength, with 236,000 jobs added in March. Why is that? Structural changes in labour markets have shifted labour supply and demand dynamics.
At the end of March, the U.S. unemployment rate stood at 3.5%, near multidecade lows. As the economy slows, unemployment will rise from here, but I believe it will peak around 5.0% and fall more quickly than we have seen in prior business cycles. And, since the start of the pandemic, work-from-home trends, along with the reshoring of supply chains back to the U.S. and the development of sustainable energy, have bolstered real wages, particularly for middle- and low-income workers.
What’s more, at this point in the cycle, consumers have low debt relative to levels coming out of the GFC or even other more typical recessions. At the end of 2022, household debt service as a percentage of income stood at 9.7%.
Consumers are in better shape than they have been ahead of past recessions
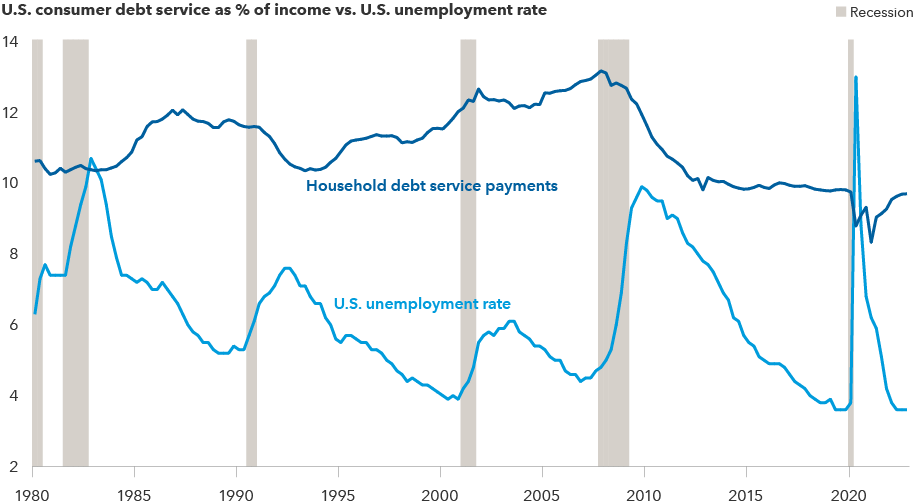
Sources: Capital Group, Board of Governors of the U.S. Federal Reserve System, Bureau of Labor Statistics, National Bureau of Economic Research. Unemployment rate reflects the seasonally adjusted total unemployment rate. Household debt service payments as a percentage of total disposable income are seasonally adjusted, and the debt service component includes both mortgage payments and scheduled consumer debt payments. Data is quarterly, as of 12/31/2022.
What other factors could support a consumer-led recovery in the U.S.?
I expect moderating inflation to further support consumer strength. While it will take some time for the Fed to get inflation down to its 2.0% target, I believe it will be contained near 3.0%. Academic studies have shown that consumer spending has tended not to be significantly impacted by inflation around 3.0%. Contained inflation will likely boost consumer confidence.
And, if wages hold up, it can feel like a real wage boost. I also expect inflation to edge toward 2.0% to 2.5% by 2025.
I believe we’ll also see productivity gains from automation and the increased adoption of artificial intelligence. This may provide an economic tailwind by helping to manage rising labour costs. That said, I do not expect such productivity gains to offset hiring needs in the near- to mid-term.
I also expect we will see stronger housing demand coming out of the recession. Changing demographics and rising household formation (a group of individuals who intend to live together), suggest a likely rebound in housing demand. I expect the popularity of working remotely to drive demand for housing development in suburbs, areas beyond the suburbs and second-tier cities, as well.
What does it mean for investors?
Solid labour market fundamentals, household balance sheets and moderating inflation could in my estimation lead to 3.0% growth in the U.S. consumer sector going forward. This is important because consumers account for about 67% of the U.S. economy. It is important to emphasize that a recession will cause some contraction in the labour market, but I expect the labour market to rebound.
After large declines, markets have rebounded relatively quickly
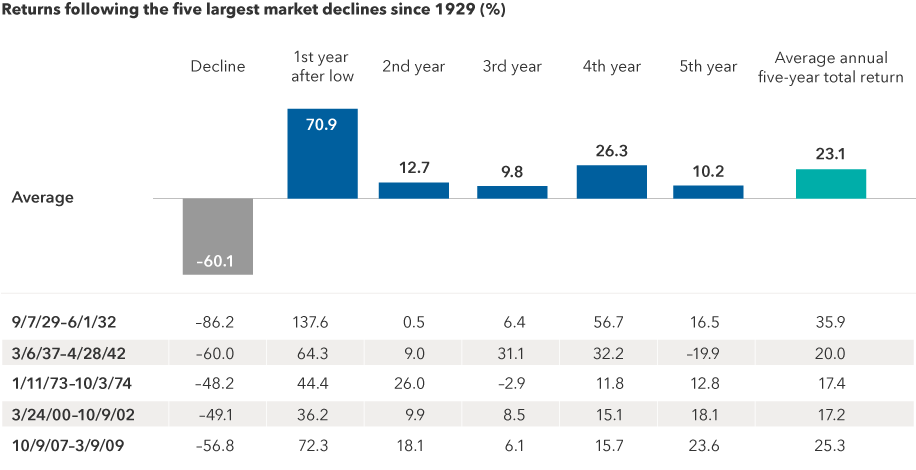
Sources: Capital Group, RIMES, Standard & Poor's. As of 12/31/2022. Market downturns are based on the five largest declines in the value of the S&P 500 Index (excluding dividends and/or distributions) with 100% recovery after each decline. The return of each of the five years after a low is a 12-month return based on the date of the low. The percentage decline is based on the index value of the unmanaged S&P 500, excluding dividends and/or distributions. The average annual total returns include reinvested dividends and/or distributions but do not reflect the effect of sales charges, commissions, account fees, expenses, or taxes. Past results are not predictive of results in future periods. Returns are in USD.
Strong wages and consumer confidence could boost consumer spending, providing an uptick in a range of industries, including travel and leisure. What’s more, a housing market recovery could provide a tailwind not only to construction spending, but also spending for other durable goods, like household appliances.
Historically, the stock market has tended to anticipate recoveries, rebounding ahead of any turn in the economy.
Learn more about
The S&P 500 Index is a market capitalization-weighted index based on the results of approximately 500 widely held common stocks. The index is unmanaged and, therefore, has no expenses. Investors cannot invest directly in an index.
Our latest insights
-
-
Market Volatility
-
-
Currencies
-
Market Volatility
Get the Guide to Recessions
RELATED INSIGHTS
-
Asset Allocation
-
-
Market Volatility
Commissions, trailing commissions, management fees and expenses all may be associated with investments in investment funds. Please read the prospectus before investing. Investment funds are not guaranteed or covered by the Canada Deposit Insurance Corporation or by any other government deposit insurer. For investment funds other than money market funds, their values change frequently. For money market funds, there can be no assurances that the fund will be able to maintain its net asset value per security at a constant amount or that the full amount of your investment in the fund will be returned to you. Past performance may not be repeated.
Unless otherwise indicated, the investment professionals featured do not manage Capital Group‘s Canadian investment funds.
References to particular companies or securities, if any, are included for informational or illustrative purposes only and should not be considered as an endorsement by Capital Group. Views expressed regarding a particular company, security, industry or market sector should not be considered an indication of trading intent of any investment funds or current holdings of any investment funds. These views should not be considered as investment advice nor should they be considered a recommendation to buy or sell.
Statements attributed to an individual represent the opinions of that individual as of the date published and do not necessarily reflect the opinions of Capital Group or its affiliates. This information is intended to highlight issues and not be comprehensive or to provide advice. For informational purposes only; not intended to provide tax, legal or financial advice. Capital Group funds are available in Canada through registered dealers. For more information, please consult your financial and tax advisors for your individual situation.
Forward-looking statements are not guarantees of future performance, and actual events and results could differ materially from those expressed or implied in any forward-looking statements made herein. We encourage you to consider these and other factors carefully before making any investment decisions and we urge you to avoid placing undue reliance on forward-looking statements.
The S&P 500 Composite Index (“Index”) is a product of S&P Dow Jones Indices LLC and/or its affiliates and has been licensed for use by Capital Group. Copyright © 2026 S&P Dow Jones Indices LLC, a division of S&P Global, and/or its affiliates. All rights reserved. Redistribution or reproduction in whole or in part are prohibited without written permission of S&P Dow Jones Indices LLC.
FTSE source: London Stock Exchange Group plc and its group undertakings (collectively, the "LSE Group"). © LSE Group 2026. FTSE Russell is a trading name of certain of the LSE Group companies. "FTSE®" is a trade mark of the relevant LSE Group companies and is used by any other LSE Group company under licence. All rights in the FTSE Russell indices or data vest in the relevant LSE Group company which owns the index or the data. Neither LSE Group nor its licensors accept any liability for any errors or omissions in the indices or data and no party may rely on any indices or data contained in this communication. No further distribution of data from the LSE Group is permitted without the relevant LSE Group company's express written consent. The LSE Group does not promote, sponsor or endorse the content of this communication. The index is unmanaged and cannot be invested in directly.
BLOOMBERG® is a trademark and service mark of Bloomberg Finance L.P. and its affiliates (collectively “Bloomberg”). Bloomberg or Bloomberg’s licensors own all proprietary rights in the Bloomberg Indices. Neither Bloomberg nor Bloomberg’s licensors approves or endorses this material, or guarantees the accuracy or completeness of any information herein, or makes any warranty, express or implied, as to the results to be obtained therefrom and, to the maximum extent allowed by law, neither shall have any liability or responsibility for injury or damages arising in connection therewith.
The MSCI information may only be used for your internal use, may not be reproduced or redisseminated in any form and may not be used as a basis for or a component of any financial instruments or products or indices. None of the MSCI information is intended to constitute investment advice or a recommendation to make (or refrain from making) any kind of investment decision and may not be relied on as such. Historical data and analysis should not be taken as an indication or guarantee of any future performance analysis, forecast or prediction. The MSCI information is provided on an “as is” basis and the user of this information assumes the entire risk of any use made of this information. MSCI, each of its affiliates and each other person involved in or related to compiling, computing or creating any MSCI information (collectively, the “MSCI Parties”) expressly disclaims all warranties (including, without limitation, any warranties of originality, accuracy, completeness, timeliness, non-infringement, merchantability and fitness for a particular purpose) with respect to this information. Without limiting any of the foregoing, in no event shall any MSCI Party have any liability for any direct, indirect, special, incidental, punitive, consequential (including, without limitation, lost profits) or any other damages. (www.msci.com)
Capital believes the software and information from FactSet to be reliable. However, Capital cannot be responsible for inaccuracies, incomplete information or updating of the information furnished by FactSet. The information provided in this report is meant to give you an approximate account of the fund/manager's characteristics for the specified date. This information is not indicative of future Capital investment decisions and is not used as part of our investment decision-making process.
Indices are unmanaged and cannot be invested in directly. Returns represent past performance, are not a guarantee of future performance, and are not indicative of any specific investment.
All Capital Group trademarks are owned by The Capital Group Companies, Inc. or an affiliated company in Canada, the U.S. and other countries. All other company names mentioned are the property of their respective companies.
Capital Group funds are offered in Canada by Capital International Asset Management (Canada), Inc., part of Capital Group, a global investment management firm originating in Los Angeles, California in 1931. Capital Group manages equity assets through three investment groups. These groups make investment and proxy voting decisions independently. Fixed income investment professionals provide fixed income research and investment management across the Capital organization; however, for securities with equity characteristics, they act solely on behalf of one of the three equity investment groups.
The Capital Group funds offered on this website are available only to Canadian residents.