Market Volatility
Categories
Trade
Reshoring supply chains: What does it mean for investors?
 Julian Abdey
 Rob Lovelace
 Winnie Kwan
February 9, 2023
Of all the lessons learned during the pandemic — wash your hands thoroughly, avoid crowded elevators, working from home can be productive — perhaps the most consequential lesson for companies is now obvious in hindsight: Relying on single links in the global supply chain was a mistake.
Major components of the supply chain fractured during the COVID-19 crisis, resulting in shortages of everything from medical supplies and equipment to furniture and auto parts. Geopolitical events also entered the fray as U.S.-China tensions and Russia’s invasion of Ukraine underscored the risks of relying too much on one place for critical supplies, including energy, food and computer chips.
“With the rapid spread of globalization over the past few decades, companies moved their manufacturing operations to the cheapest and most efficient countries,” says equity portfolio manager Julian Abdey.
“That was great for company profits and consumer prices,” he continues. “But what we found out more recently is that when supply chains get disrupted it can cause real problems. For example, Europe has realized it was too dependent on Russia for natural gas. And I think the same is true for other products like computer chips. The world is too dependent on Asia, and Taiwan in particular, for semiconductors.”
Reshoring replaces offshoring
Fast forward to 2023, and many companies — in some cases spurred by massive government subsidies — are taking big steps to diversify their supply chains, focusing on reliability and robustness over cost and efficiency. That means bringing some manufacturing back home, or “reshoring” and moving some of it to other countries.
The trend has raised questions about whether the world is moving into a period of de-globalization. However, based on trade activity in recent years, the new path looks more like a measured adjustment to global supply chains, partially interrupted by the pandemic and the 2007–2009 financial crisis.
Globalization marches on — at a different pace
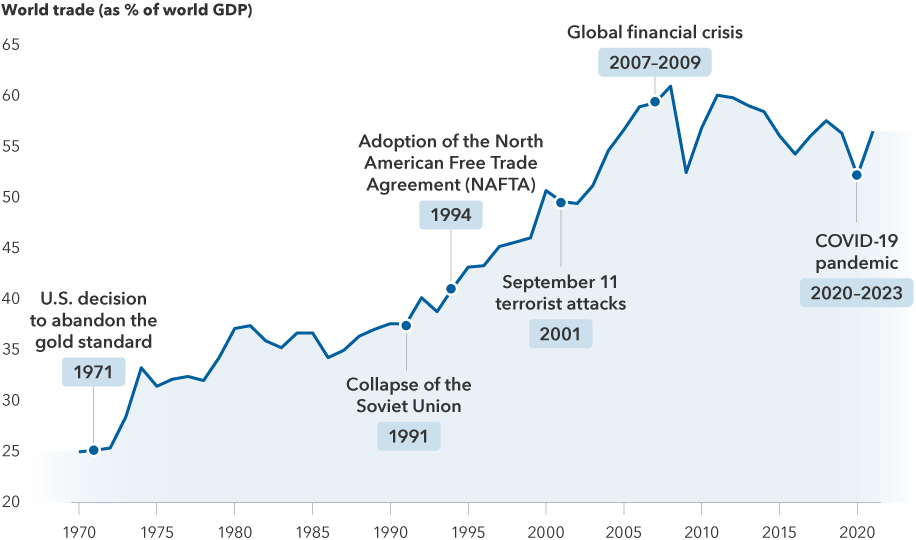
Sources: Capital Group, Organisation for Economic Co-operation and Development (OECD), World Bank. World trade is calculated as the sum of exports and imports of goods and services, and is represented above as a share of global gross domestic product. Trade data as of 2021.
“When we talk to companies and look at the data, we are not seeing what I would call de-globalization,” says equity portfolio manager Rob Lovelace. “I think it would be more accurate to call it a rewiring of global supply chains. And I don’t think it’s really all that dramatic when you consider the rapid growth of digital trade, which is harder to track using traditional metrics, as opposed to physical trade.”
In fact, there is ample evidence that many companies are becoming more global as they seek to create redundant supply chains. The poster child for this development is Taiwan Semiconductor Manufacturing Company, or TSMC, the world’s largest semiconductor foundry. To expand its global reach, TSMC is building new manufacturing plants in Arizona and Japan. Semiconductors have become such a sensitive issue, given their use in the defence industry, that the U.S. government has placed aggressive restrictions on where and how they can be exported.
Other examples abound in the tech sector and elsewhere. Apple announced in September that it would start producing the iPhone 14 in India, adding to its manufacturing capabilities in China, the Czech Republic and South Korea among others. In the auto sector, Tesla added to its U.S. and China manufacturing hubs last year by opening its first European outpost in Gruenheide, Germany.
In the energy sector, Texas-based ECV Holdings has announced plans to build a power plant for industrial parks near Ho Chi Minh City, Vietnam, supplied primarily by U.S. liquified natural gas. Meanwhile, the list of U.S. companies establishing new manufacturing plants at home has grown dramatically in recent years to include General Motors, Intel and U.S. Steel — fueling hopes of an American industrial renaissance.
The China+1 strategy
Amid this drive to diversify supply chains, a common misconception is that China may be displaced as the world’s largest manufacturing base. Rather, many companies are shifting to a “China+1 strategy” by maintaining operations in China while adding new facilities elsewhere, says Winnie Kwan, a portfolio manager with Capital Group Capital Income Builder™ (Canada). Incremental investments in China are likely to focus on serving mainly the domestic market, she notes, while additional investments in other locations cater to the rest of the world.
“A key question is whether the China+1 strategy will be scalable or not,” Kwan says. “Can you add a new plant in India or Mexico, for example, and scale up production as needed? Is the labour and power supply sufficient? Is logistics infrastructure in place? Can management handle the added complexity? Those are the questions I am focusing on as we research these developments and look for investment opportunities. Not every company is going to get it right.”
Indeed, the flow of incremental investments is an important metric for investors to track. According to a 2021 survey of foreign companies doing business in China conducted by AmCham Shanghai, the top destinations for redirected investments were Southeast Asia, Mexico, India and the United States. However, only 63 of the 338 companies surveyed said they had such plans, which suggests the process of reshoring may be slower and more deliberate than some market participants are expecting.
“It could take a decade for companies to fully transition,” she adds. “But the process has certainly started, and I think it will be one of the more important investment themes of the 2020s.”
Southeast Asia is well-positioned for the rewiring of global supply chains
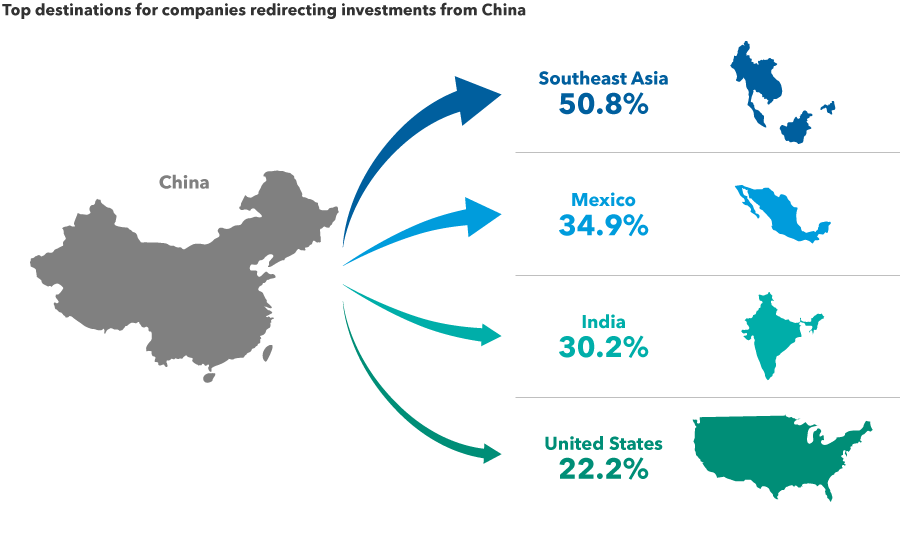
Source: AmCham Shanghai 2021 China Business Report, published September 22, 2021. Based on a survey of 338 foreign companies doing business in China. Of those companies, 63 said they were redirecting investments from China to other locations, including Southeast Asia, Mexico, India and the United States, among others.
Who benefits from reshoring?
With such a large undertaking, the investment implications are widespread across a number of sectors and geographies. Here are four areas expected to benefit from reshoring in the years ahead.
1. India Thanks to its proximity to China, a well-educated labour force, and a fast-growing, business-friendly economy, India may be the best-positioned country to capitalize on supply chain diversification. India’s government has taken bold steps to encourage the expansion of manufacturing operations, particularly in the smartphone space, where Apple works with contractors such as Foxconn to build the latest iPhones. The manufacturing sector is expected to accelerate over the next decade, driving growth in the Indian economy and boosting other industries such as banking, energy and telecommunications.
“India is arguably better positioned today than China was 20 years ago,” says Capital Group equity analyst Johnny Chan.
2. Mexico Similar to India, Mexico’s proximity to one of the world’s largest economies makes it an attractive base for expanded manufacturing and logistics operations. Many U.S. companies flocked there in the 1990s after the adoption of the North American Free Trade Agreement (NAFTA). That process has only accelerated under a revamped trade deal, the U.S./Mexico/Canada Agreement (USMCA), ratified in 2020.
Mexico’s annual exports to the U.S. have increased sharply in recent years. Although much of that is due to the influence of American companies, China is also ramping up in Mexico. For example, Hisense Group, one of China’s largest appliance makers, is currently building a US$260 million industrial park in Monterrey, aiming to produce refrigerators, washing machines and air conditioners for the U.S. market. In the auto sector, BMW and Nissan have also recently expanded their capabilities south of the border.
3. Automation providers One of the biggest hurdles to diversifying the world’s manufacturing capabilities is a chronic labour shortage, especially in developed economies. Automation powered by artificial intelligence (AI) is likely to provide an answer to this problem, says equity portfolio manager Mark Casey. Many Asian countries are setting the trend with high rates of industrial automation, with the U.S. and Europe expected to follow. Both regions have room to grow, proving a bright outlook for top companies in the global robotics industry, including Japan’s Keyence, France’s Schneider Electric and Switzerland’s ABB Ltd. Amazon is also developing its own impressive AI-driven technology, Casey notes.
“Amazon has a new robotic picking-and-packing device called Sparrow that can grab more than 60 million different products and pack them into shipping boxes — completing each pick in a matter of seconds,” Casey says. “Just seven years ago Amazon’s experimental robots could handle only a small number of items, and each pick would take a couple minutes. I think this sort of technology is coming along sooner than we think, and I don’t see it accounted for in the stock prices of any major American or European company.”
Automation, powered by smart robots, is ready for takeoff
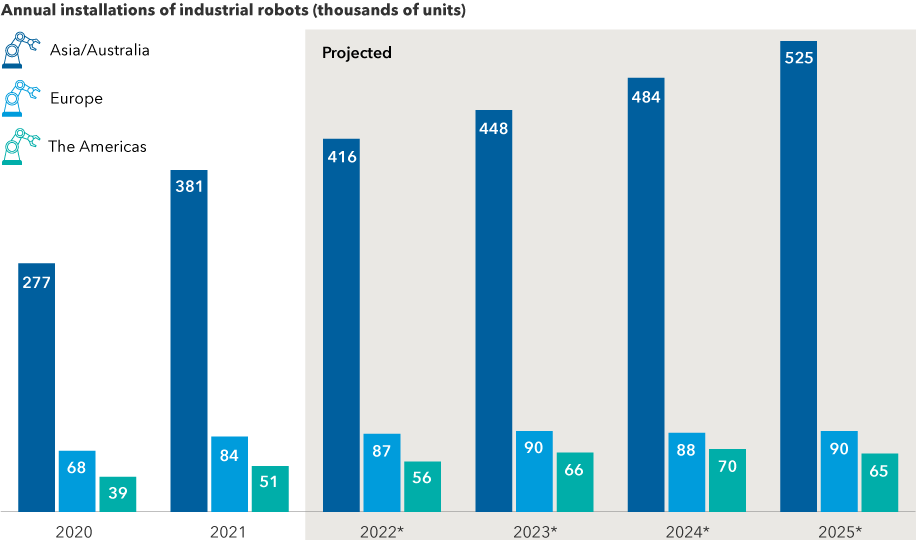
Sources: Capital Group, International Federation of Robotics. As of 2022
4. Multinationals Although it may seem counterintuitive, the same multinational companies that benefited most from the rapid pace of globalization in the past may be best equipped to navigate the brave new world of re-globalization, says equity portfolio manager Jody Jonsson. The world’s largest and most dominant companies rose to that position for a reason— they often have the experience and resources to adapt to changing trade patterns better than smaller companies operating in single markets.
“In my view, well-managed multinational companies will remain global in their production facilities and customer bases, but they will increasingly build more local redundancy into their operations,” Jonsson says. “I call it ‘multilocalization.’ That includes bringing some parts of the supply chain back to the U.S., continuing to outsource other parts and establishing new production facilities in key areas throughout the world.
“If there is one lesson we’ve learned from the COVID crisis, it’s that companies must have diverse supply chains,” she adds. “We aren’t there yet, but the process is well underway.”
Learn more about
Our latest insights
-
-
Market Volatility
-
-
Currencies
-
Market Volatility
RELATED INSIGHTS
-
Markets & Economy
-
Global Equities
-
U.S. Equities
Commissions, trailing commissions, management fees and expenses all may be associated with investments in investment funds. Please read the prospectus before investing. Investment funds are not guaranteed or covered by the Canada Deposit Insurance Corporation or by any other government deposit insurer. For investment funds other than money market funds, their values change frequently. For money market funds, there can be no assurances that the fund will be able to maintain its net asset value per security at a constant amount or that the full amount of your investment in the fund will be returned to you. Past performance may not be repeated.
Unless otherwise indicated, the investment professionals featured do not manage Capital Group‘s Canadian investment funds.
References to particular companies or securities, if any, are included for informational or illustrative purposes only and should not be considered as an endorsement by Capital Group. Views expressed regarding a particular company, security, industry or market sector should not be considered an indication of trading intent of any investment funds or current holdings of any investment funds. These views should not be considered as investment advice nor should they be considered a recommendation to buy or sell.
Statements attributed to an individual represent the opinions of that individual as of the date published and do not necessarily reflect the opinions of Capital Group or its affiliates. This information is intended to highlight issues and not be comprehensive or to provide advice. For informational purposes only; not intended to provide tax, legal or financial advice. Capital Group funds are available in Canada through registered dealers. For more information, please consult your financial and tax advisors for your individual situation.
Forward-looking statements are not guarantees of future performance, and actual events and results could differ materially from those expressed or implied in any forward-looking statements made herein. We encourage you to consider these and other factors carefully before making any investment decisions and we urge you to avoid placing undue reliance on forward-looking statements.
The S&P 500 Composite Index (“Index”) is a product of S&P Dow Jones Indices LLC and/or its affiliates and has been licensed for use by Capital Group. Copyright © 2026 S&P Dow Jones Indices LLC, a division of S&P Global, and/or its affiliates. All rights reserved. Redistribution or reproduction in whole or in part are prohibited without written permission of S&P Dow Jones Indices LLC.
FTSE source: London Stock Exchange Group plc and its group undertakings (collectively, the "LSE Group"). © LSE Group 2026. FTSE Russell is a trading name of certain of the LSE Group companies. "FTSE®" is a trade mark of the relevant LSE Group companies and is used by any other LSE Group company under licence. All rights in the FTSE Russell indices or data vest in the relevant LSE Group company which owns the index or the data. Neither LSE Group nor its licensors accept any liability for any errors or omissions in the indices or data and no party may rely on any indices or data contained in this communication. No further distribution of data from the LSE Group is permitted without the relevant LSE Group company's express written consent. The LSE Group does not promote, sponsor or endorse the content of this communication. The index is unmanaged and cannot be invested in directly.
BLOOMBERG® is a trademark and service mark of Bloomberg Finance L.P. and its affiliates (collectively “Bloomberg”). Bloomberg or Bloomberg’s licensors own all proprietary rights in the Bloomberg Indices. Neither Bloomberg nor Bloomberg’s licensors approves or endorses this material, or guarantees the accuracy or completeness of any information herein, or makes any warranty, express or implied, as to the results to be obtained therefrom and, to the maximum extent allowed by law, neither shall have any liability or responsibility for injury or damages arising in connection therewith.
The MSCI information may only be used for your internal use, may not be reproduced or redisseminated in any form and may not be used as a basis for or a component of any financial instruments or products or indices. None of the MSCI information is intended to constitute investment advice or a recommendation to make (or refrain from making) any kind of investment decision and may not be relied on as such. Historical data and analysis should not be taken as an indication or guarantee of any future performance analysis, forecast or prediction. The MSCI information is provided on an “as is” basis and the user of this information assumes the entire risk of any use made of this information. MSCI, each of its affiliates and each other person involved in or related to compiling, computing or creating any MSCI information (collectively, the “MSCI Parties”) expressly disclaims all warranties (including, without limitation, any warranties of originality, accuracy, completeness, timeliness, non-infringement, merchantability and fitness for a particular purpose) with respect to this information. Without limiting any of the foregoing, in no event shall any MSCI Party have any liability for any direct, indirect, special, incidental, punitive, consequential (including, without limitation, lost profits) or any other damages. (www.msci.com)
Capital believes the software and information from FactSet to be reliable. However, Capital cannot be responsible for inaccuracies, incomplete information or updating of the information furnished by FactSet. The information provided in this report is meant to give you an approximate account of the fund/manager's characteristics for the specified date. This information is not indicative of future Capital investment decisions and is not used as part of our investment decision-making process.
Indices are unmanaged and cannot be invested in directly. Returns represent past performance, are not a guarantee of future performance, and are not indicative of any specific investment.
All Capital Group trademarks are owned by The Capital Group Companies, Inc. or an affiliated company in Canada, the U.S. and other countries. All other company names mentioned are the property of their respective companies.
Capital Group funds are offered in Canada by Capital International Asset Management (Canada), Inc., part of Capital Group, a global investment management firm originating in Los Angeles, California in 1931. Capital Group manages equity assets through three investment groups. These groups make investment and proxy voting decisions independently. Fixed income investment professionals provide fixed income research and investment management across the Capital organization; however, for securities with equity characteristics, they act solely on behalf of one of the three equity investment groups.
The Capital Group funds offered on this website are available only to Canadian residents.