Portfolio Construction
Categories
Election
U.S. midterm elections may be closer than expected
 Matt Miller
October 22, 2026
KEY TAKEAWAYS
- A “blue wave” is unlikely to materialize.
- The high cost of living will be a big factor for voters in this and future elections.
- Divided government would create legislative gridlock, which has been positive for markets.
- Historically, U.S. stocks have performed well following midterms.
With the U.S. midterm elections just around the corner, I am asked multiple times a day by colleagues, clients and friends how I think this pivotal contest is going to turn out. It’s my job after all to provide political analysis and public-policy research to Capital Group’s investment team — with an emphasis on analysis, not advocacy, as I always stress.
So, with that in mind, here are three insights I’ve been sharing as we count down to election day. Politics is never an exact science, but this is my assessment of the potential outcome and what it could mean for investors.
1. Democrats will win the U.S. House of Representatives (the House), but don’t expect a blue wave.
Contrary to an increasingly popular narrative in the news media, I don’t think we are going to see a “blue wave” of Democratic Party victories across the country. In my view, it’s going to be much closer. When all the ballots are counted, I think Democrats will regain control of the House of Representatives by a narrow margin, but I also believe the Republican Party will maintain its majority in the Senate.
Are the political winds poised to shift in the House?
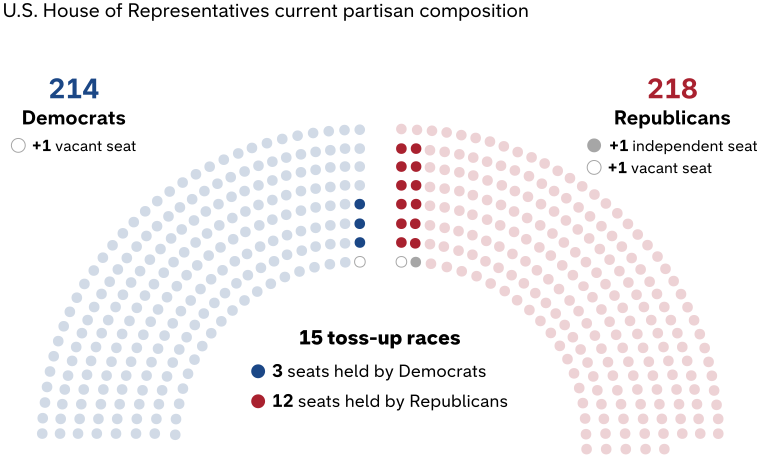
Sources: Capital Group, 270toWin, Office of the Clerk of the U.S. House of Representatives. Toss-up races are 2026 U.S. House elections rated "toss-up" in the 270toWin consensus forecast, which combines race ratings from multiple independent forecasters. One dot on the Republican side represents an independent member of Congress who caucuses with Republicans. Figures reflect latest available data as of October 15, 2026.
From my perspective, there just aren’t as many competitive races as there were in previous elections. Due to partisan gerrymandering, U.S. Congressional District lines have been redrawn to the point where there are less than 20 truly competitive races. The vast majority of the 435 seats in the House are now comfortably held by Democrats (blue) or Republicans (red).
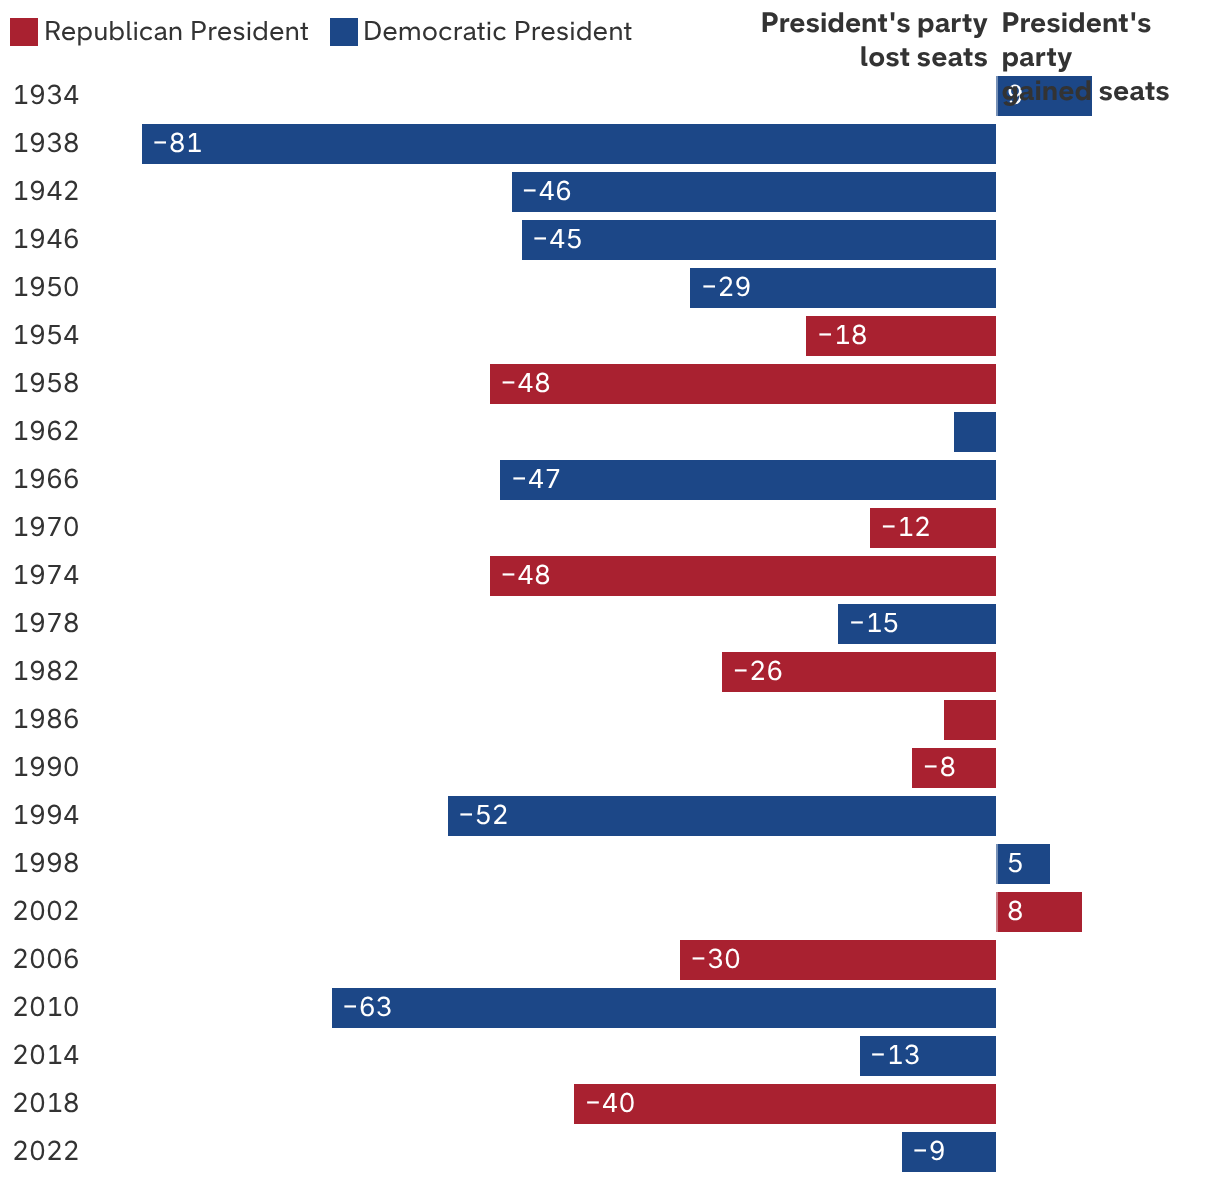
That means the party in power — in this case, the Republican Party — isn’t as likely to lose as many seats as we’ve typically seen throughout history. Sweeping victories where the party that has been out of power wins 40 to 60 seats are much more difficult to achieve. We saw it happen during President Trump’s first term in office, and famously in 1994 during President Clinton’s first term. But it is entirely possible we won’t see that kind of shellacking again for many years.
If Democrats gain a 20-seat majority in the House, that would be considered a huge win. My sense is, the Democratic majority will be smaller, perhaps just a handful of seats. That would make it tougher to pass legislation because just a few representatives can derail the process, as Republicans have learned over the past two years given their slim majority.
The U.S. president’s party typically loses seats in midterm elections
Sources: Capital Group, University of California at Santa Barbara: The American Presidency Project. As of December 31, 2025.
The U.S. Senate, meanwhile, is a tougher nut to crack. Incumbent candidates are more entrenched, and the Republican Party’s fundraising advantage should help it retain contested seats in Maine, Texas, Michigan and elsewhere. Earlier this year, the Senate wasn’t even considered to be in play. But the Iran war, rising energy prices and higher inflation changed that calculus as President Trump’s approval ratings declined sharply. Many polls suggest the Senate is now a toss-up and either party could prevail. I don’t have much faith in those forecasts. Even the most reputable polling organizations have been egregiously wrong in recent years. At the end of the day, my reading of the political tea leaves is that Republicans will eke out a win and maintain a razor-thin majority in the Senate.
2. Affordability is the issue that will decide this election.
The affordability crisis, runaway inflation, the high cost of living — call it whatever you like — the rising price of virtually everything is the most important issue in this election. It’s the same issue that caused Democrats to lose the 2024 election. Voters are angry about rising consumer prices, and they are expressing their anger at the ballot box.
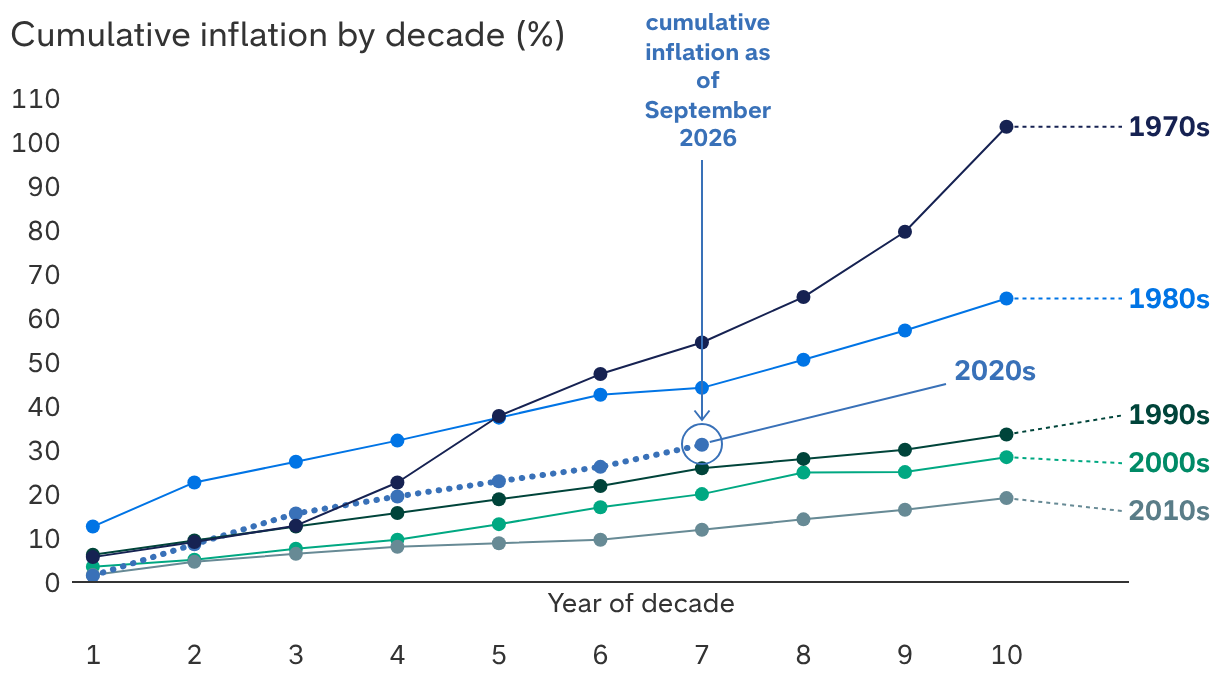
Republican candidates are frustrated because, they would argue, inflation soared above 9% when President Biden was in office, and it is much lower today at around 3.7%. But that’s not how American consumers see it. It’s not the annualized rate of inflation but the cumulative cost increases over the past few years that are exasperating voters. Since 2021, they have seen price hikes of 30% or more on key ingredients of middle-class life, including food, utilities and gasoline. Trump came into office promising to solve that problem and, in their view, it has become worse as prices continue to rise, albeit at a slower pace, partly due to the Iran war and tariffs.
U.S. consumers are facing cumulative inflation above 30%
Sources: Capital Group, Federal Reserve Bank of St. Louis, U.S. Bureau of Labor Statistics. 2026 year-to-date data through September 30, 2026. Inflation is represented by the Consumer Price Index for All Urban Consumers: All Items in U.S. City Average, not seasonally adjusted.
Virtually all Democrats running for office today have made “the affordability crisis” their no. 1 talking point in debates, stump speeches and political advertisements. Widespread frustration over the Iran war and rising prices could result in lower turnout among Republican voters. If the GOP loses the House, this will be the reason. It could also be a recurring theme in the future. If voters feel they are not getting some relief on inflation, regardless of which party is in power, they are likely to continue demanding change in political leadership.
3. The result will be political gridlock — and political theatre.
If I am right and Democrats regain control of the House only, that’s all it will take to return Congress to a state of political gridlock. We will have a divided government. That means Congress won’t be able to achieve much on the legislative front over the next two years. We should also expect debt limit and budget standoffs to rattle markets temporarily.
That said, there are some areas where bipartisan cooperation might be possible. For instance, both parties have sought to expand housing availability and rein in pharmaceutical drug pricing. There might be room for compromise on government subsidies under the Affordable Care Act (ACA). ACA subsidies were allowed to expire last year, raising health insurance costs for many. Democrats have made it a priority to restore them, and Republicans might be willing to go along with it, if for no other reason than to remove it as a sticking point in the 2028 election. In addition, both parties have vocal critics of unconstrained AI data centre construction. I can see that issue playing a bigger role next year.
Beyond that, we should also expect to see some familiar political fireworks. When the new Congress convenes in January, I expect House Democrats to begin investigations of Trump, his family and various members of his administration almost immediately. I think it’s highly likely they will seek to impeach Trump again. The Senate, of course, won’t convict him, but this political theatre will probably consume the final two years of Trump’s presidency.
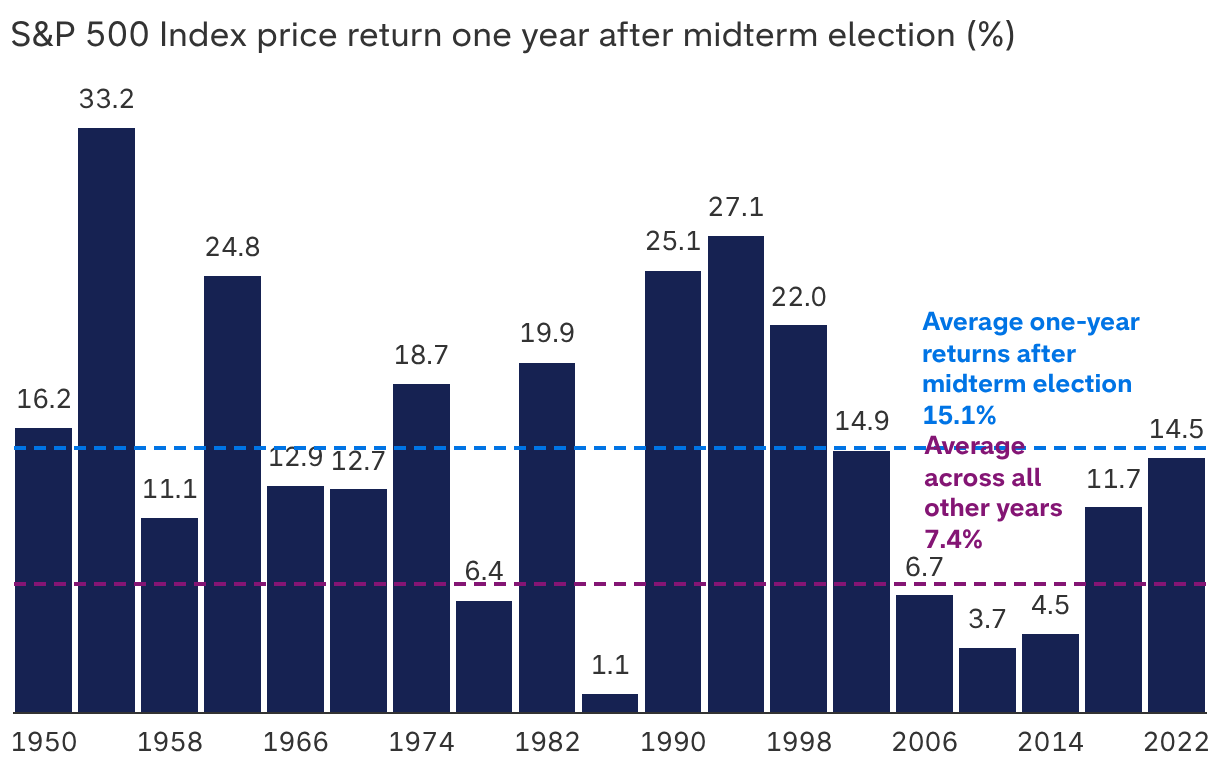
On the investment front, the good news is that U.S. stocks tend to do well once the uncertainty generated by the midterms is over. Since 1950, the S&P 500 Index has returned 15% on average during the 12 months following midterm elections. This year, the S&P 500 is already up about 12% on a year-to-date basis, as of October 19. That doesn’t mean we won’t experience a downturn at some point, but it has proven that this year has already produced substantial returns despite the unpredictability of the election environment.
Stocks historically have had positive returns in the year following U.S. midterms
Sources: Capital Group, RIMES, S&P Global. Calculations use election day as the starting date in all election years, and November 5 as a proxy for the starting date in other years. Only midterm election years are shown in the chart. Price returns exclude the reinvestment of dividends and capital distributions.
Historically speaking, a divided government has not hurt U.S. stock returns. In fact, based on Capital Group’s analysis of long-term investment data between 1933 and 2025, the partisan composition of Congress appears to have had almost no impact on returns. U.S. stocks have enjoyed double-digit returns, on average, under various government power structures.
Those facts serve as an important reminder not to let political worries derail your long-term investment goals. Elections, and politics in general, can generate a lot of noise, uncertainty and angst if your preferred candidates lose. There’s nothing wrong with cheering for your side. But the reality is, investment returns are driven primarily by the earnings and perceived value of individual companies over time. Investors would be wise to look past the short-term highs and lows and maintain a long-term focus, regardless of which way the political winds may blow.
Learn more about
The indices are unmanaged and, therefore, have no expenses. Investors cannot invest directly in an index.
Consumer Price Index for All Urban Consumers: All Items in U.S. City Average is a measure of the average change over time in the prices paid by urban consumers for a market basket of consumer goods and services. Percent changes in the price index measure the inflation rate between any two time periods.
The S&P 500 Index is a market capitalization-weighted index based on the results of approximately 500 widely held common stocks.
The S&P 500 Index is a product of S&P Dow Jones Indices LLC and/or its affiliates and has been licensed for use by Capital Group. Copyright © 2026 S&P Dow Jones Indices LLC, a division of S&P Global, and/or its affiliates. All rights reserved. Redistribution or reproduction in whole or in part is prohibited without written permission of S&P Dow Jones Indices LLC.
Our latest insights
-
-
Technology & Innovation
-
Objective-Based Investing
-
-
Active Management
RELATED INSIGHTS
-
Portfolio Construction
-
Active Management
-
Global Equities
Commissions, trailing commissions, management fees and expenses all may be associated with investments in investment funds. Please read the prospectus before investing. Investment funds are not guaranteed or covered by the Canada Deposit Insurance Corporation or by any other government deposit insurer. For investment funds other than money market funds, their values change frequently. For money market funds, there can be no assurances that the fund will be able to maintain its net asset value per security at a constant amount or that the full amount of your investment in the fund will be returned to you. Past performance may not be repeated.
Unless otherwise indicated, the investment professionals featured do not manage Capital Group‘s Canadian investment funds.
References to particular companies or securities, if any, are included for informational or illustrative purposes only and should not be considered as an endorsement by Capital Group. Views expressed regarding a particular company, security, industry or market sector should not be considered an indication of trading intent of any investment funds or current holdings of any investment funds. These views should not be considered as investment advice nor should they be considered a recommendation to buy or sell.
Statements attributed to an individual represent the opinions of that individual as of the date published and do not necessarily reflect the opinions of Capital Group or its affiliates. This information is intended to highlight issues and not be comprehensive or to provide advice. For informational purposes only; not intended to provide tax, legal or financial advice. Capital Group funds are available in Canada through registered dealers. For more information, please consult your financial and tax advisors for your individual situation.
Forward-looking statements are not guarantees of future performance, and actual events and results could differ materially from those expressed or implied in any forward-looking statements made herein. We encourage you to consider these and other factors carefully before making any investment decisions and we urge you to avoid placing undue reliance on forward-looking statements.
The S&P 500 Composite Index (“Index”) is a product of S&P Dow Jones Indices LLC and/or its affiliates and has been licensed for use by Capital Group. Copyright © 2026 S&P Dow Jones Indices LLC, a division of S&P Global, and/or its affiliates. All rights reserved. Redistribution or reproduction in whole or in part are prohibited without written permission of S&P Dow Jones Indices LLC.
FTSE source: London Stock Exchange Group plc and its group undertakings (collectively, the "LSE Group"). © LSE Group 2026. FTSE Russell is a trading name of certain of the LSE Group companies. "FTSE®" is a trade mark of the relevant LSE Group companies and is used by any other LSE Group company under licence. All rights in the FTSE Russell indices or data vest in the relevant LSE Group company which owns the index or the data. Neither LSE Group nor its licensors accept any liability for any errors or omissions in the indices or data and no party may rely on any indices or data contained in this communication. No further distribution of data from the LSE Group is permitted without the relevant LSE Group company's express written consent. The LSE Group does not promote, sponsor or endorse the content of this communication. The index is unmanaged and cannot be invested in directly.
BLOOMBERG® is a trademark and service mark of Bloomberg Finance L.P. and its affiliates (collectively “Bloomberg”). Bloomberg or Bloomberg’s licensors own all proprietary rights in the Bloomberg Indices. Neither Bloomberg nor Bloomberg’s licensors approves or endorses this material, or guarantees the accuracy or completeness of any information herein, or makes any warranty, express or implied, as to the results to be obtained therefrom and, to the maximum extent allowed by law, neither shall have any liability or responsibility for injury or damages arising in connection therewith.
The MSCI information may only be used for your internal use, may not be reproduced or redisseminated in any form and may not be used as a basis for or a component of any financial instruments or products or indices. None of the MSCI information is intended to constitute investment advice or a recommendation to make (or refrain from making) any kind of investment decision and may not be relied on as such. Historical data and analysis should not be taken as an indication or guarantee of any future performance analysis, forecast or prediction. The MSCI information is provided on an “as is” basis and the user of this information assumes the entire risk of any use made of this information. MSCI, each of its affiliates and each other person involved in or related to compiling, computing or creating any MSCI information (collectively, the “MSCI Parties”) expressly disclaims all warranties (including, without limitation, any warranties of originality, accuracy, completeness, timeliness, non-infringement, merchantability and fitness for a particular purpose) with respect to this information. Without limiting any of the foregoing, in no event shall any MSCI Party have any liability for any direct, indirect, special, incidental, punitive, consequential (including, without limitation, lost profits) or any other damages. (www.msci.com)
Capital believes the software and information from FactSet to be reliable. However, Capital cannot be responsible for inaccuracies, incomplete information or updating of the information furnished by FactSet. The information provided in this report is meant to give you an approximate account of the fund/manager's characteristics for the specified date. This information is not indicative of future Capital investment decisions and is not used as part of our investment decision-making process.
Indices are unmanaged and cannot be invested in directly. Returns represent past performance, are not a guarantee of future performance, and are not indicative of any specific investment.
All Capital Group trademarks are owned by The Capital Group Companies, Inc. or an affiliated company in Canada, the U.S. and other countries. All other company names mentioned are the property of their respective companies.
Capital Group funds are offered in Canada by Capital International Asset Management (Canada), Inc., part of Capital Group, a global investment management firm originating in Los Angeles, California in 1931. Capital Group manages equity assets through three investment groups. These groups make investment and proxy voting decisions independently. Fixed income investment professionals provide fixed income research and investment management across the Capital organization; however, for securities with equity characteristics, they act solely on behalf of one of the three equity investment groups.
The Capital Group funds offered on this website are available only to Canadian residents.