Inflation
 Pramod Atluri
 Ritchie Tuazon
Of all the fears investors have faced over the past 30 years, high inflation wasn’t among them. In 2021, that’s changed.
Today, the biggest questions for investors revolve around inflation: How high will it go and how long will it last? Is it “transitory” as the U.S. Federal Reserve claims? Or is elevated inflation the new normal amid labour shortages, supply chain bottlenecks and a severe energy crunch?
The uncertain path of the pandemic makes near-term conditions difficult to predict but, over the long term, the picture comes into better focus, says Pramod Atluri, fixed income portfolio manager.
“While we are facing a cyclical rise in inflation and interest rates today, when I look out five years, I think U.S. economic growth will be slower and inflation may be lower,” Atluri says. Economic growth should slow due to high debt levels and fading stimulus, resulting in a return to GDP gains of 1.5% to 2.5% a year. Consequently, interest rates should stay relatively low as well.
“In the meantime, we are laser focused on inflation because that’s the biggest risk to investors’ portfolios over the near term,” Atluri explains. “If we are wrong about inflation, we will be wrong on the upside, so it makes sense to protect against that outcome.”
A tale of two inflations: Sticky versus flexible
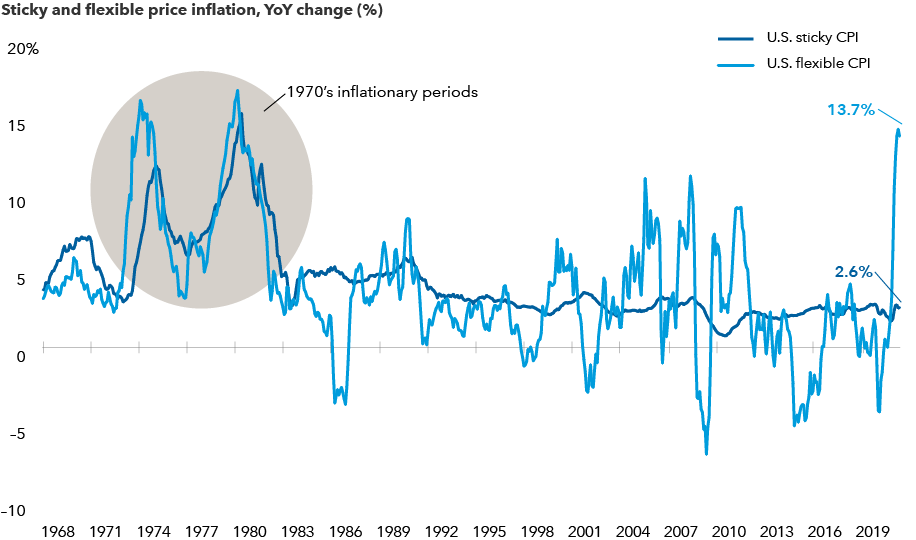
Sources: U.S. Federal Reserve Bank of Atlanta; Refinitive Datastream. Sticky and flexible prices reflect the Atlanta Federal Reserve sticky and flexible consumer price indexes (CPI). If price changes for a particular CPI component occur less than every 4.3 months, that component is a “sticky-price” good. Goods that change prices more frequently are “flexible-price” goods. As of August 2021.
Two flavors of inflation: Sticky and flexible
A source of uncertainty today is that there are two different types of inflation: sticky and flexible. Sticky inflation, currently around 2.6% annualized in the U.S., tends to exhibit longer staying power. Sticky categories include rent, owners’ equivalent rent, insurance costs and medical expenses.
Flexible inflation in the U.S. has climbed this year to nearly 14% — the highest since the 1970s. However, this level of inflation likely won’t last. The flexible category contains products such as food, energy and cars, where prices can move a lot higher or lower over time. For instance, that’s already happened with lumber, copper and soybeans. Prices for those products skyrocketed this summer and have since come down.
Price flare-ups in key commodities are starting to level out
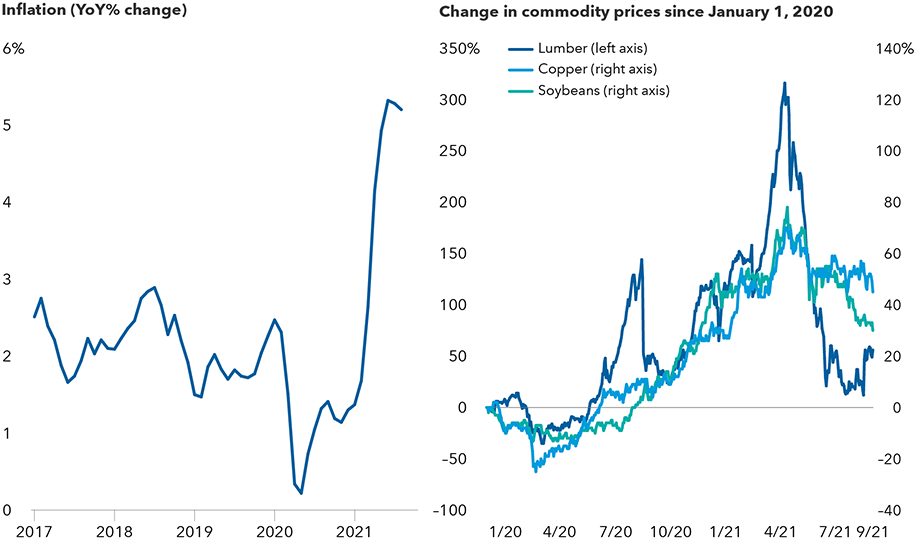
Sources: Capital Group, U.S. Bureau of Labor Statistics, Refinitiv Datastream. Inflation is measured by the U.S. Consumer Price Index for All Urban Consumers (CPI-U) as of 8/31/21. Commodity prices are as of 9/30/21.
Beware of sticky inflation
As anyone who has tried to buy a used car knows, flexible inflation categories have spiked due to pandemic-related shortages, a lack of available labour and supply chain disruptions. A quick resolution to these challenges is unlikely, but more normal conditions should return by mid to late 2022 in the U.S., says Ritchie Tuazon, fixed income portfolio manager.
“What that means is, the upside risk is in the sticky components,” Tuazon explains. “Many of the flexible price categories moved higher for transitory reasons, but inflation in those areas may come back down to zero or even go negative. The sticky components will drive inflation in 2022 in the U.S. so that’s what investors need to keep an eye on.”
In short, flexible inflation is transitory, but sticky inflation could be troublesome.
In Tuazon’s estimation, overall inflation as measured by the U.S. Consumer Price Index should gradually decline in the months ahead, eventually falling into a range of 2.50% to 2.75% by the end of 2022 in the U.S.
If that prediction holds, there’s a good chance the Federal Reserve will not raise interest rates in 2022. Tuazon expects the Fed to officially announce in November that it will begin reducing its bond-buying stimulus program. That process will take several quarters. And the Fed’s first rate hike will come in 2023, which is later than market expectations.
“I don’t think the Fed will be in a hurry to raise rates and potentially derail the COVID recovery if inflation remains in check,” Tuazon reasons.
What if this benign inflation outlook is wrong and consumer prices move sharply higher?
“That is by no means our base case, but I think it is a big enough risk that it should factor into portfolio construction,” Tuazon adds. He favours U.S. Treasury Inflation-Protected Securities, or TIPS, as an effective hedge against higher inflation.
Investment implications
Holding some TIPS in your bond portfolio is a smart move to consider heading into 2022, say both Tuazon and Atluri. As for stocks, there are a few rules of thumb to consider. Historically, higher prices have boosted commodities, as well as sectors that benefit from higher interest rates (such as banks) and companies with pricing power in must-have categories like semiconductors and popular consumer brands.
Before making portfolio adjustments, it’s important to remember that sustained periods of elevated inflation are rare in U.S. history. People of a certain age will remember the ultra-high inflation of the 1970s and early 1980s. But in hindsight, it’s clear that was a unique period. In fact, deflationary pressures have often been more difficult to tame, as students of the Great Depression will attest.
Over the past 100 years, U.S. inflation has stayed below 5% the vast majority of the time. More recently, in the aftermath of the 2007–2009 global financial crisis, inflation has struggled to hit 2% on a sustained basis. And that’s despite unprecedented stimulus measures engineered by the Fed in an attempt to reach the central bank’s 2% goal.
Another important point: It’s mostly at the extremes — when inflation is 6% or above — that financial assets tend to struggle. Stocks have also come under pressure when inflation goes negative, as one would expect.
For investors, some inflation can be a good thing. Even during times of higher inflation, stocks and bonds have generally provided solid returns as shown in the chart below.
Stocks and bonds have done well in various inflation environments
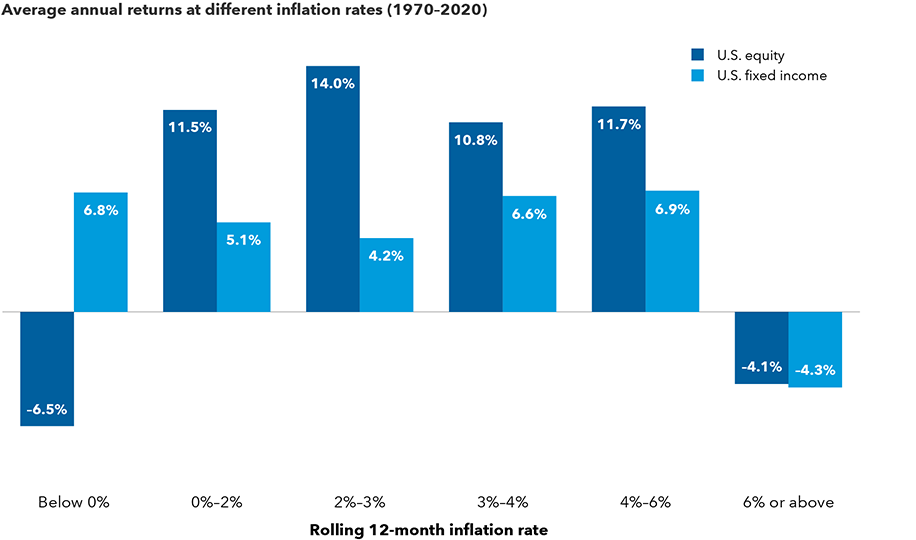
Sources: Capital Group, Bloomberg Index Services Ltd., Morningstar, Standard & Poor's. All returns are inflation-adjusted real returns. U.S. equity returns represented by the Standard & Poor’s 500 Composite Index and are in USD. U.S. fixed income represented by Ibbotson Associates SBBI U.S. Intermediate-Term Government Bond Index from 1/1/1970–12/12/1975 and Bloomberg U.S. Aggregate Bond Index from 1/1/1976–12/31/2020. Inflation rates are defined by the rolling 12-month returns of the Ibbotson Associates SBBI U.S. Inflation Index.
Bloomberg Barclays U.S. Aggregate Index represents the U.S. investment-grade fixed-rate bond market.
U.S. Consumer Price Index is a measure of the average change over time in the prices paid by urban consumers for a market basket of consumer goods and services.
Consumer Price Index for All Urban Consumers is a core index calculated by the U.S. Bureau of Labor Statistics and covers households of all Metropolitan Statistical Areas, which is around 80% of the country’s population.
Standard & Poor’s 500 Composite Index is a market capitalization-weighted index based on the results of approximately 500 widely held common stocks.
©2021 Morningstar, Inc. All rights reserved. The information contained herein: (1) is proprietary to Morningstar and/or its content providers; (2) may not be copied or distributed; and (3) is not warranted to be accurate, complete or timely. Neither Morningstar nor its content providers are responsible for any damages or losses arising from any use of this information. Past performance is no guarantee of future results.
Our latest insights
-
-
Currencies
-
Market Volatility
-
Market Volatility
-
Markets & Economy
RELATED INSIGHTS
Commissions, trailing commissions, management fees and expenses all may be associated with investments in investment funds. Please read the prospectus before investing. Investment funds are not guaranteed or covered by the Canada Deposit Insurance Corporation or by any other government deposit insurer. For investment funds other than money market funds, their values change frequently. For money market funds, there can be no assurances that the fund will be able to maintain its net asset value per security at a constant amount or that the full amount of your investment in the fund will be returned to you. Past performance may not be repeated.
Unless otherwise indicated, the investment professionals featured do not manage Capital Group‘s Canadian investment funds.
References to particular companies or securities, if any, are included for informational or illustrative purposes only and should not be considered as an endorsement by Capital Group. Views expressed regarding a particular company, security, industry or market sector should not be considered an indication of trading intent of any investment funds or current holdings of any investment funds. These views should not be considered as investment advice nor should they be considered a recommendation to buy or sell.
Statements attributed to an individual represent the opinions of that individual as of the date published and do not necessarily reflect the opinions of Capital Group or its affiliates. This information is intended to highlight issues and not be comprehensive or to provide advice. For informational purposes only; not intended to provide tax, legal or financial advice. Capital Group funds are available in Canada through registered dealers. For more information, please consult your financial and tax advisors for your individual situation.
Forward-looking statements are not guarantees of future performance, and actual events and results could differ materially from those expressed or implied in any forward-looking statements made herein. We encourage you to consider these and other factors carefully before making any investment decisions and we urge you to avoid placing undue reliance on forward-looking statements.
The S&P 500 Composite Index (“Index”) is a product of S&P Dow Jones Indices LLC and/or its affiliates and has been licensed for use by Capital Group. Copyright © 2025 S&P Dow Jones Indices LLC, a division of S&P Global, and/or its affiliates. All rights reserved. Redistribution or reproduction in whole or in part are prohibited without written permission of S&P Dow Jones Indices LLC.
FTSE source: London Stock Exchange Group plc and its group undertakings (collectively, the "LSE Group"). © LSE Group 2025. FTSE Russell is a trading name of certain of the LSE Group companies. "FTSE®" is a trade mark of the relevant LSE Group companies and is used by any other LSE Group company under licence. All rights in the FTSE Russell indices or data vest in the relevant LSE Group company which owns the index or the data. Neither LSE Group nor its licensors accept any liability for any errors or omissions in the indices or data and no party may rely on any indices or data contained in this communication. No further distribution of data from the LSE Group is permitted without the relevant LSE Group company's express written consent. The LSE Group does not promote, sponsor or endorse the content of this communication. The index is unmanaged and cannot be invested in directly.
BLOOMBERG® is a trademark and service mark of Bloomberg Finance L.P. and its affiliates (collectively “Bloomberg”). Bloomberg or Bloomberg’s licensors own all proprietary rights in the Bloomberg Indices. Neither Bloomberg nor Bloomberg’s licensors approves or endorses this material, or guarantees the accuracy or completeness of any information herein, or makes any warranty, express or implied, as to the results to be obtained therefrom and, to the maximum extent allowed by law, neither shall have any liability or responsibility for injury or damages arising in connection therewith.
MSCI does not approve, review or produce reports published on this site, makes no express or implied warranties or representations and is not liable whatsoever for any data represented. You may not redistribute MSCI data or use it as a basis for other indices or investment products.
Capital believes the software and information from FactSet to be reliable. However, Capital cannot be responsible for inaccuracies, incomplete information or updating of the information furnished by FactSet. The information provided in this report is meant to give you an approximate account of the fund/manager's characteristics for the specified date. This information is not indicative of future Capital investment decisions and is not used as part of our investment decision-making process.
Indices are unmanaged and cannot be invested in directly. Returns represent past performance, are not a guarantee of future performance, and are not indicative of any specific investment.
All Capital Group trademarks are owned by The Capital Group Companies, Inc. or an affiliated company in Canada, the U.S. and other countries. All other company names mentioned are the property of their respective companies.
Capital Group funds are offered in Canada by Capital International Asset Management (Canada), Inc., part of Capital Group, a global investment management firm originating in Los Angeles, California in 1931. Capital Group manages equity assets through three investment groups. These groups make investment and proxy voting decisions independently. Fixed income investment professionals provide fixed income research and investment management across the Capital organization; however, for securities with equity characteristics, they act solely on behalf of one of the three equity investment groups.
The Capital Group funds offered on this website are available only to Canadian residents.