Market Volatility
Categories
Fixed Income
Look to credit opportunities amid bond market rout
 Damien McCann
 David Bradin
June 13, 2022
It is no secret that 2022 has been challenging for fixed income investors. High inflation and the U.S. Federal Reserve’s initiation of interest rate hikes have weighed on markets. Nevertheless, the broad credit universe provides ample opportunities for investors to add value through bottom-up research and security selection in each of the four primary credit sectors — high yield, investment grade, emerging markets and securitized debt.
In this article, the first in a series exploring the credit universe, we discuss how income-seeking portfolios can be structured with the aim of adding incremental alpha (excess return) through security selection and asset allocation within a prudent risk management framework.
Among these four credit sectors, capitalizing on relative value can be a very powerful way to enhance returns, especially during periods of high volatility like the one we are experiencing now.
Here are our current views on each sector within credit and where members of our investment team are finding what they believe are attractive return opportunities within the construct of a multi-sector income portfolio.
1. High yield has not seen prolonged periods of negative returns
The high-yield corporate bond market has a long-term record of producing a high level of income, which is the primary contributor to its total return over a full market cycle. The sector is large, at about US$1.5 trillion, and spans a multitude of industries and issuers. Investors comfortable with taking on the higher risk associated with high-yield bonds can also choose from a range of bonds of varying quality (secured and unsecured across the BB to CCC ratings spectrum). The high-yield universe also provides significantly shorter duration than investment-grade (IG) corporates and emerging markets debt (EMD).
Unlike equities, where valuations reflect expected future cash flows, high-yield returns are much more a function of an issuer’s current cash flows and ability to service debt. While high-yield spreads can be volatile and directionally correlated with equities, the yield serves to cushion drawdowns and drive attractive total returns over multi-year periods. Spreads refer to the difference in yield between two bonds or types of bonds, which investors use to gauge the valuation of a bond. In fact, it has been quite rare for the high-yield sector to experience prolonged periods of negative total returns.
High-yield returns tend not to stay negative for long
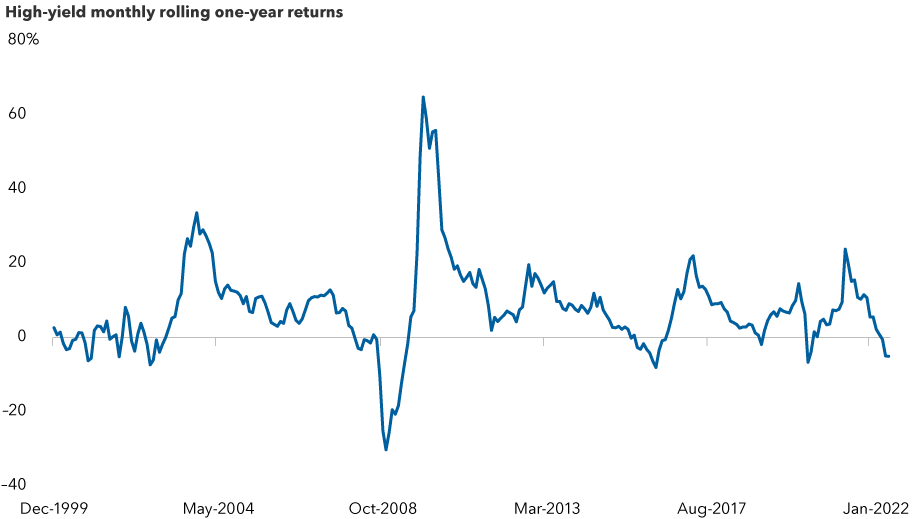
Chart Source: Bloomberg. Data as of June 3, 2022. Returns are in USD.
A large part of the sector is reasonably liquid, allowing for fundamental research to guide relative value decisions by moving between securities from different parts of a company’s capital structure, within an industry or across the high-yield sector. That said, we believe the sector’s relative value has declined compared to emerging markets, securitized credit and investment grade.
Over multiple decades, the relationship between high-yield and investment-grade spreads has followed a similar pattern. High-yield spreads tend to widen significantly compared to investment grade during crises and periods of weak economic growth. Historical spread relationships act as a guide for when high yield becomes more attractive than investment grade during periods of stress. Outside of those crisis and recession periods, spread relationships are much more stable and generally hover within a predictable range. In the current environment, we expect that slowing economic growth will continue to push high-yield spreads wider compared to investment grade. As such, we are monitoring valuations and the economic backdrop and will increase our holdings given the right windows of opportunity.
High-yield vs. investment-grade spreads appear tight in the U.S.
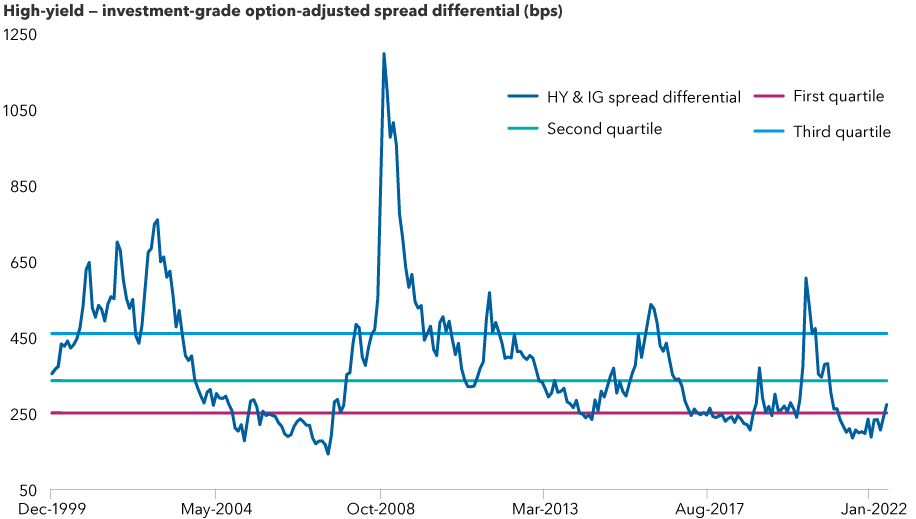
Chart Source: Bloomberg. Data as of May 31, 2022.
2. Securitized credit is under-researched, providing alpha opportunities
Securitized credit can provide a higher level of income than investment-grade corporate bonds with comparable ratings, while offering similar downside protection. The sector offers diverse investment opportunities across asset-backed, commercial real estate, non-agency mortgage and collateralized leveraged loan sub-sectors. Many of the fundamental drivers of these sectors are distinct from corporate and sovereign credit. This brings diversity to a portfolio. The sector is also under-researched by many market participants, enabling our team of securitized credit analysts to identify numerous mispriced investment opportunities.
Securitized credit has relatively lower liquidity. As a result, repricings happen with a lag, compared to more liquid credit sectors, such as corporates and emerging markets debt. For example, when corporate spreads widened earlier in the year, especially after Russia invaded Ukraine, securitized credit initially did not move as dramatically. Spreads on securitized debt started to widen in March, at which point corporates had begun rallying back. This created a relative cheapening of securitized credit, which presented a good opportunity for investors. We added to asset-backed securities (ABS) and commercial mortgage-backed securities (CMBS), and took some small positions in collateralized loan obligations (CLOs), which were attractive relative to comparably rated investment-grade corporate bonds.
We are currently finding good value in the single-asset single-borrower (SASB) market. These niche investments create more concentrated risks than traditional CMBS, but the market largely consists of very high quality properties and lends itself to deep, property-specific fundamental research. This presents an opportunity for investors to gain access to specific assets that they find attractive.
Elsewhere in securitized credit, we are seeing good value compared to investment-grade corporates in AAA-rated tranches of several sectors: subprime auto, single-family rental and private student loans. In each case, the strong jobs market and high cash balances provide strong support for the consumer making payments on underlying loans.
Spreads between CMBS and corporates remain wide
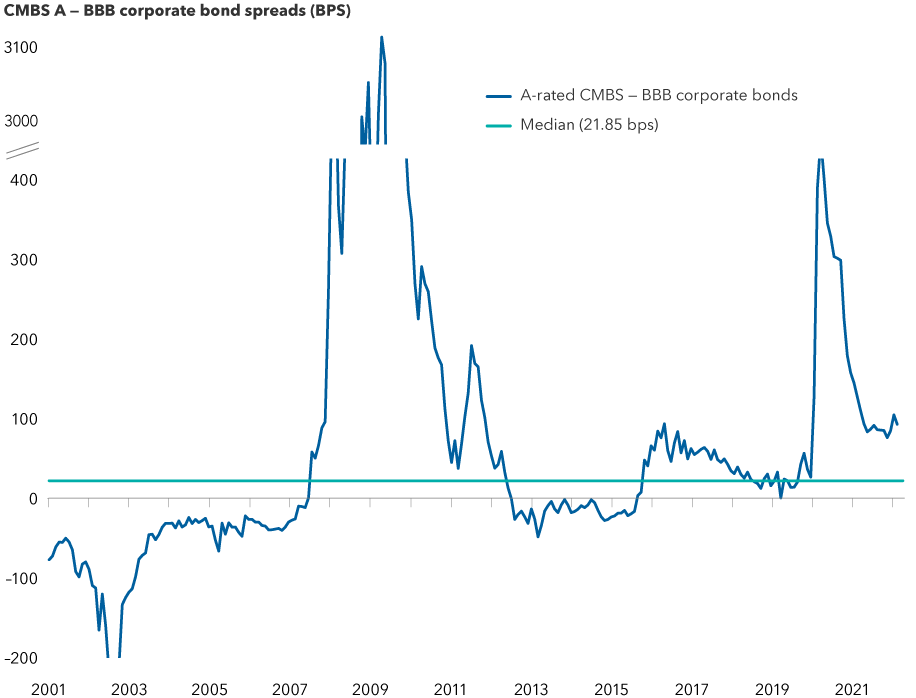
Chart Source: Bloomberg. Data as of April 29, 2022.
3. Emerging markets debt offers diversified sources of income and return
EMD offers investors a high level of income and total return. The investable universe for emerging markets debt includes both investment-grade and below investment sovereign and corporate debt, which allows for broad relative value comparisons within the sector and across similarly rated investment-grade and below investment-grade corporate and securitized debt.
EMD valuations, especially those of below investment-grade-rated securities, have remained cheap relative to high-yield corporates following the March 2020 selloff. More recently, rising inflation, slowing global growth, tightening U.S. monetary policy and a soaring U.S. dollar have all weighed on the sector. The Russia-Ukraine conflict has created an additional headwind relative to other comparably rated developed market corporate debt.
But there is reason to be optimistic about the future of emerging markets. Indeed, many emerging markets central banks are well ahead of the Federal Reserve in terms of hiking rates to rein in demand in their economies to try to tame inflation. As emerging markets economies tend to be smaller, less economically diverse, and more reliant on exports and imports, inflation is a much more prevalent issue in these markets. Where developed markets are scrambling to address inflation that hasn't been seen in many decades, many emerging markets have an established playbook for how to rein in inflation domestically. Additionally, while higher energy prices are a challenge and many EM countries face food security problems as a result of the Russia-Ukraine conflict, numerous emerging markets (especially in Latin America and parts of Africa) are net beneficiaries of higher commodity prices since they are net exporters. Therefore, we believe that, at current valuations, EMD compensates investors well for the risks they face from what we believe should be a manageable situation.
At today’s starting yields, EMD forward returns have historically been attractive
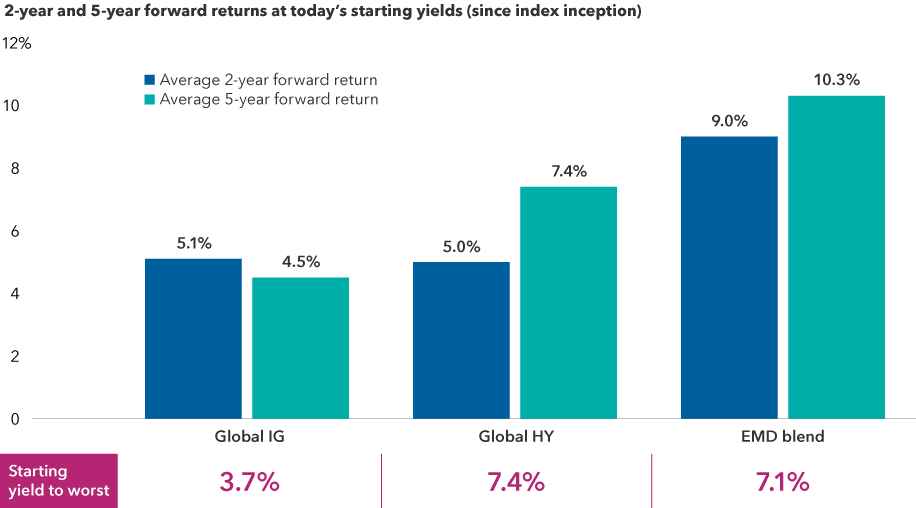
Sources: Bloomberg, JPMorgan. Data as at April 30, 2022, in USD terms. Global IG Corporate: Bloomberg Global Investment Grade Corporate Bond Index (inception: 01/01/2001), Global HY Corporate: Bloomberg Global High Yield Index (inception: 01/01/1990), EMD Blend: average of JPMorgan EMBI Global Diversified Index and JPMorgan GBI-EM Global Diversified Index (inception: 01/01/2003). Average 2- and 5-year forward returns refer to the average historical returns for each index over the 2- and 5- year periods following the points at which they have touched today’s starting yields. Yield to worst is the lowest yield that can be realized by either calling or putting on one of the available call/put dates, or holding a bond to maturity.
4. Investment-grade corporates: Higher quality but more sensitive to rates
Investment-grade corporate bonds make up the largest sector in the credit universe. It is well-diversified across issuers and industries, and includes securities with maturities across the yield curve. We specifically like how the sector can be accretive to a portfolio’s overall yield, in addition to being less volatile than high yield as a result of tighter relative spread movements.
Investment-grade corporates tend to be longer duration and lower coupon than high yield. This makes the sector more sensitive to interest rate movements. That said, because it is higher quality, spreads tend to widen much less relative to high yield when the economy slows and fundamentals weaken.
Following the March 2020 selloff, investment-grade spreads compressed toward historically tight levels, while issuance remained at record volumes. Against the backdrop of stronger value in other sectors, we saw the relative value in investment grade to be less attractive. We have found value in certain financial services, health care and media issuers. We have the flexibility to further increase exposure or decrease as the near- to medium-term outlook for the global economy remains uncertain.
The bottom line
In summary, all four sectors of the credit universe play an important role in income-seeking portfolios. The high income of the high-yield and emerging markets debt sectors are balanced by the defensiveness of the higher quality investment-grade corporates and securitized sectors. The shorter duration of high-yield and securitized credit temper the higher interest rate sensitivity of the investment-grade and EMD sectors. Overall, credit spread correlations (or the tendency for spreads on different securities within a portfolio to move in a similar fashion) are reduced by the inclusion of securitized and sovereign credit. These sectors offer fundamental drivers that can be distinct from the corporate credit drivers in high-yield and investment-grade corporates.
Given the uncertain economic environment, we believe taking a diversified, balanced approach to credit is more important than ever. We currently favour securitized credit, followed by emerging markets debt, and are taking a somewhat cautious approach with our investments in high-yield and investment-grade corporates.
Learn more about
Damien McCann is a portfolio manager on Capital Group Multi-Sector Income Fund (Canada).
The J.P. Morgan Emerging Market Bond Index (EMBI) Global Diversified is a uniquely weighted emerging market debt benchmark that tracks total returns for U.S. dollar-denominated bonds issued by emerging market sovereign and quasi-sovereign entities. This index is unmanaged, and its results include reinvested dividends and/or distributions but do not reflect the effect of account fees, expenses or U.S. federal income taxes.
J.P. Morgan Government Bond Index — Emerging Markets (GBI-EM) Global Diversified covers the universe of regularly traded, liquid fixed-rate, domestic currency emerging market government bonds to which international investors can gain exposure. This index is unmanaged, and its results include reinvested dividends and/or distributions but do not reflect the effect of account fees, expenses or U.S. federal income taxes.
Bloomberg U.S. Corporate High Yield 2% Issuer Capped Index covers the universe of fixed-rate, non-investment-grade debt. The index limits the maximum exposure of any one issuer to 2%.
Bloomberg U.S. Corporate Investment Grade Index represents the universe of investment-grade, publicly issued U.S. corporate and specified foreign debentures and secured notes that meet the specified maturity, liquidity and quality requirements.
The Bloomberg Global Investment Grade Corporate Bond Index is a rules-based, market-value-weighted index engineered to measure the investment-grade, fixed rate global corporate bond market.
The Bloomberg Global High Yield Index is a multi-currency flagship measure of the global high yield debt market. The index represents the union of the US High Yield, the Pan-European High Yield, and Emerging Markets (EM) Hard Currency High Yield Indices.
The Bloomberg CMBS ex AAA Index tracks investment-grade (Baa3/BBB- or higher, excluding Aaa/AAA) commercial mortgage-backed securities that are included in the Bloomberg U.S. Aggregate Index.
The Bloomberg Baa Corporate Index measures the Baa/BBB-rated, fixed rate, taxable corporate bond market. It includes USD denominated securities publicly issued by U.S. and non-U.S. industrial, utility and financial issuers.
This report, and any product, index or fund referred to herein, is not sponsored, endorsed or promoted in any way by J.P. Morgan or any of its affiliates who provide no warranties whatsoever, express or implied, and shall have no liability to any prospective investor, in connection with this report.
Our latest insights
-
-
Market Volatility
-
-
Currencies
-
Market Volatility
RELATED INSIGHTS
-
Global Equities
-
U.S. Equities
-
Commissions, trailing commissions, management fees and expenses all may be associated with investments in investment funds. Please read the prospectus before investing. Investment funds are not guaranteed or covered by the Canada Deposit Insurance Corporation or by any other government deposit insurer. For investment funds other than money market funds, their values change frequently. For money market funds, there can be no assurances that the fund will be able to maintain its net asset value per security at a constant amount or that the full amount of your investment in the fund will be returned to you. Past performance may not be repeated.
Unless otherwise indicated, the investment professionals featured do not manage Capital Group‘s Canadian investment funds.
References to particular companies or securities, if any, are included for informational or illustrative purposes only and should not be considered as an endorsement by Capital Group. Views expressed regarding a particular company, security, industry or market sector should not be considered an indication of trading intent of any investment funds or current holdings of any investment funds. These views should not be considered as investment advice nor should they be considered a recommendation to buy or sell.
Statements attributed to an individual represent the opinions of that individual as of the date published and do not necessarily reflect the opinions of Capital Group or its affiliates. This information is intended to highlight issues and not be comprehensive or to provide advice. For informational purposes only; not intended to provide tax, legal or financial advice. Capital Group funds are available in Canada through registered dealers. For more information, please consult your financial and tax advisors for your individual situation.
Forward-looking statements are not guarantees of future performance, and actual events and results could differ materially from those expressed or implied in any forward-looking statements made herein. We encourage you to consider these and other factors carefully before making any investment decisions and we urge you to avoid placing undue reliance on forward-looking statements.
The S&P 500 Composite Index (“Index”) is a product of S&P Dow Jones Indices LLC and/or its affiliates and has been licensed for use by Capital Group. Copyright © 2026 S&P Dow Jones Indices LLC, a division of S&P Global, and/or its affiliates. All rights reserved. Redistribution or reproduction in whole or in part are prohibited without written permission of S&P Dow Jones Indices LLC.
FTSE source: London Stock Exchange Group plc and its group undertakings (collectively, the "LSE Group"). © LSE Group 2026. FTSE Russell is a trading name of certain of the LSE Group companies. "FTSE®" is a trade mark of the relevant LSE Group companies and is used by any other LSE Group company under licence. All rights in the FTSE Russell indices or data vest in the relevant LSE Group company which owns the index or the data. Neither LSE Group nor its licensors accept any liability for any errors or omissions in the indices or data and no party may rely on any indices or data contained in this communication. No further distribution of data from the LSE Group is permitted without the relevant LSE Group company's express written consent. The LSE Group does not promote, sponsor or endorse the content of this communication. The index is unmanaged and cannot be invested in directly.
BLOOMBERG® is a trademark and service mark of Bloomberg Finance L.P. and its affiliates (collectively “Bloomberg”). Bloomberg or Bloomberg’s licensors own all proprietary rights in the Bloomberg Indices. Neither Bloomberg nor Bloomberg’s licensors approves or endorses this material, or guarantees the accuracy or completeness of any information herein, or makes any warranty, express or implied, as to the results to be obtained therefrom and, to the maximum extent allowed by law, neither shall have any liability or responsibility for injury or damages arising in connection therewith.
The MSCI information may only be used for your internal use, may not be reproduced or redisseminated in any form and may not be used as a basis for or a component of any financial instruments or products or indices. None of the MSCI information is intended to constitute investment advice or a recommendation to make (or refrain from making) any kind of investment decision and may not be relied on as such. Historical data and analysis should not be taken as an indication or guarantee of any future performance analysis, forecast or prediction. The MSCI information is provided on an “as is” basis and the user of this information assumes the entire risk of any use made of this information. MSCI, each of its affiliates and each other person involved in or related to compiling, computing or creating any MSCI information (collectively, the “MSCI Parties”) expressly disclaims all warranties (including, without limitation, any warranties of originality, accuracy, completeness, timeliness, non-infringement, merchantability and fitness for a particular purpose) with respect to this information. Without limiting any of the foregoing, in no event shall any MSCI Party have any liability for any direct, indirect, special, incidental, punitive, consequential (including, without limitation, lost profits) or any other damages. (www.msci.com)
Capital believes the software and information from FactSet to be reliable. However, Capital cannot be responsible for inaccuracies, incomplete information or updating of the information furnished by FactSet. The information provided in this report is meant to give you an approximate account of the fund/manager's characteristics for the specified date. This information is not indicative of future Capital investment decisions and is not used as part of our investment decision-making process.
Indices are unmanaged and cannot be invested in directly. Returns represent past performance, are not a guarantee of future performance, and are not indicative of any specific investment.
All Capital Group trademarks are owned by The Capital Group Companies, Inc. or an affiliated company in Canada, the U.S. and other countries. All other company names mentioned are the property of their respective companies.
Capital Group funds are offered in Canada by Capital International Asset Management (Canada), Inc., part of Capital Group, a global investment management firm originating in Los Angeles, California in 1931. Capital Group manages equity assets through three investment groups. These groups make investment and proxy voting decisions independently. Fixed income investment professionals provide fixed income research and investment management across the Capital organization; however, for securities with equity characteristics, they act solely on behalf of one of the three equity investment groups.
The Capital Group funds offered on this website are available only to Canadian residents.