Interest Rates
 Tom Reithinger
Will the Bank of Canada (BoC) succeed or fail?
That’s the question being asked by economists, analysts and investors as the BoC prepares to break from its G7 peers and embark on a real-time economic experiment to engineer a smooth exit from emergency levels of pandemic monetary stimulus.
“All eyes are on the BoC,” says Tom Reithinger, fixed income portfolio manager on Capital Group Canadian Core Plus Fixed Income FundTM (Canada).
Canada was the first G7 nation to start scaling back government weekly debt purchases — tapering — in April 2021. The BoC then announced at its October meeting that starting November 1 it will only purchase government bonds to replace maturing ones. The bank also jumped forward the timing of an interest rate increase, as it expects a full economic recovery sooner than previously expected. The bank had forecast a full recovery for the second half of 2022 and said it would keep rates at current levels until then. Now, the bank expects a full recovery and excess economic slack to be absorbed by mid-year.
“The Bank of Canada was undoubtably hawkish in their October statement,” says Reithinger, adding that he expects the bank to lift its benchmark interest rate from 0.25% in the first quarter of 2022, just ahead of hitting a full mid-year recovery. If the rate hike comes to pass in advance of another G7 country doing so, Canada would set an example for other central bankers who will have to journey down this path sooner or later.
Inflation upside risk
According to Reithinger, the bank is now worried about inflation upside risk as the Canadian Consumer Price Index (CPI) hit a near-20-year high in October. This explains their willingness to be more aggressive in this rate-hiking cycle than through years 2017 to 2018.
Consumer Price Index: Up, up and away?
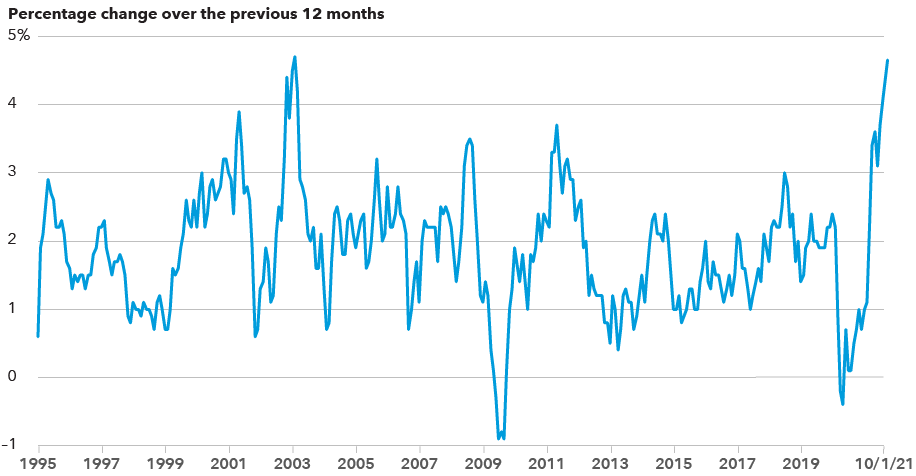
Source: Bank of Canada. The chart shows the percentage change in the Consumer Price Index (CPI) over the past 12 months from 1995 through October 2021. That’s when the CPI reached 4.7%, the highest since February 2003.
“There’s no doubt in my mind the bank will be nimble and respond to the next few months of inflation outcomes, which the Governor reinforced in the press conference,” he says.
Among the data outcomes the bank will be watching will be CPI core measures, which strip out the most volatile components in the index, and not just the headline all-in total CPI number.
Running hot: CPI-trim, CPI-median, CPI-common
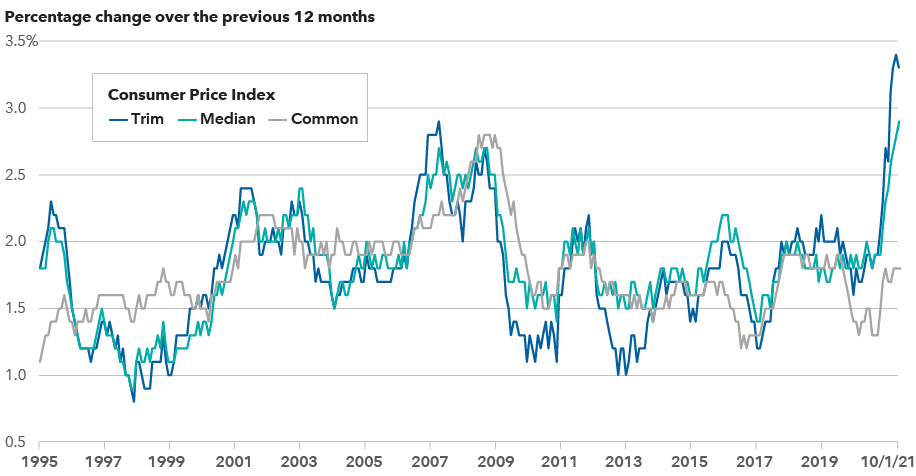
Source: Bank of Canada. The chart shows three “core” inflation measures — CPI-trim, median and common — the bank uses to look through transitory movements in total CPI inflation which better reflect underlying inflation trends. As shown, two of the three inflation measures have reached 20-plus year highs.
Core measures have spiked with CPI-trim at 3.3%, CPI-median at 2.9% and CPI-common at 1.8% year-over-year. The last time total CPI inflation rose above the bank’s 1%-3% target range — May 2011 — all three core measures were at or below 2%. Within 10 months, total CPI, or so-called headline inflation, retreated and fell below target. But unlike 10 years ago, core inflation indicators are now telegraphing inflation.
Inflationary signals
Core inflation measures aside, Reithinger is studying data points in the bank’s quarterly Business Outlook Survey, released the same day as the October monetary policy meeting. The survey polls a cross-section of business leaders across Canada, from about 100 firms.
One of the key dimensions Reithinger is watching is a gauge of investment spending plans among firms on machinery and equipment and whether companies anticipate spending more, less or about the same as they did over the last 12 months.
Open wallets
In response to this question, business leaders overwhelmingly said they plan to invest more. What’s eye-catching is the number of companies with higher spending plans —an all-time high over the past 20-plus years.
“The third-quarter BoC Business Outlook Survey showed the highest capital expenditure plans since the beginning of the survey,” says Reithinger, who continues, “Higher capital expenditure signals that businesses are confident in future growth, which tends to be inflationary.”
Long shopping lists: Plans to invest to meet demand are widespread
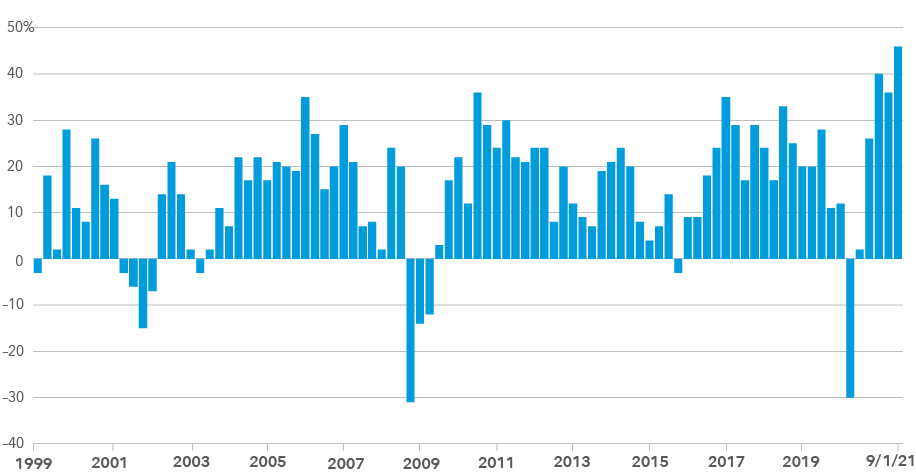
Source: Bank of Canada, Business Outlook Survey Q3, 2021, chart 8. The chart shows the percentage balance of opinion among firms expecting to spend more on machinery and equipment minus the percentage expecting to spend less compared to the prior 12 months.
Another key survey gauge for Reithinger is expectations for wage growth. Again, firms anticipate the biggest jump in wage growth since the survey began more than two decades ago.
More per hour: Expectations of faster wage growth are widespread
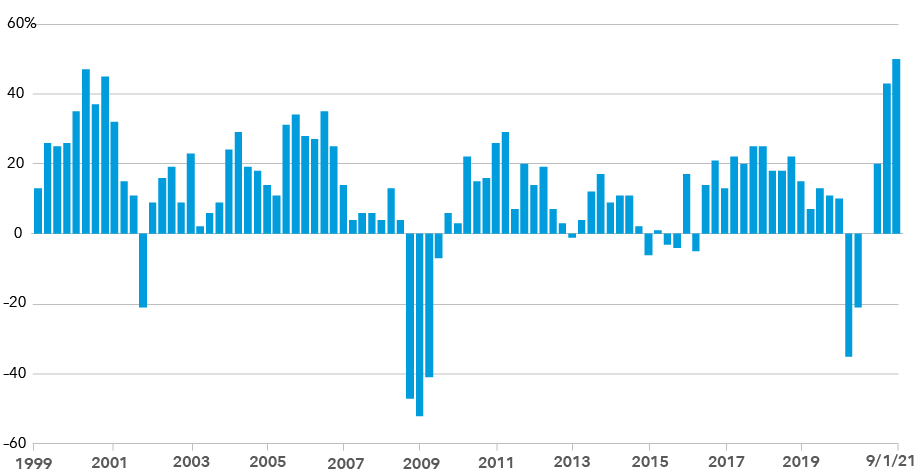
Source: Bank of Canada, Business Outlook Survey Q3, 2021, chart 10. The chart shows the percentage of firms expecting higher labour cost increases minus the percentage expecting lower labour cost increases. At an all-time high, firms reported their compensation plans are fuelled by the need to attract and retain workers amid strong labour demand.
“Faster wage growth tends to feed into overall inflation with a lag during steady periods of economic growth. Hence, I expect the wage effects to be felt in Canadian inflation during 2022 and 2023. Again, this signals that higher inflation is more persistent rather than transitory in the next few years,” he says.
Investment implications
Before making portfolio adjustments, investors should remember that sustained periods of elevated inflation are rare in Canadian history. People of a certain age will remember the ultra-high inflation of the 1970s and early 1980s. But in hindsight, it’s clear that was a unique period. In fact, deflationary pressures have often been more difficult to tame, as students of the Great Depression will attest.
More recently, in the aftermath of the 2007–2009 global financial crisis, inflation has struggled to hit 2% on a sustained basis. And that’s despite unprecedented stimulus measures engineered by a wide range of central bankers in North America, the eurozone and Japan.
Inflation extremes
Another important point: It’s mostly at the extremes — when inflation is 6% or above — that financial assets tend to struggle. Stocks have also come under pressure when inflation goes negative, as one would expect.
For investors, some inflation can be a good thing as evidenced by the performance of U.S. stocks and bonds. Even during times of higher inflation, both asset classes have generally provided solid returns as shown in the chart below.
Stocks and bonds have done well in various inflation environments
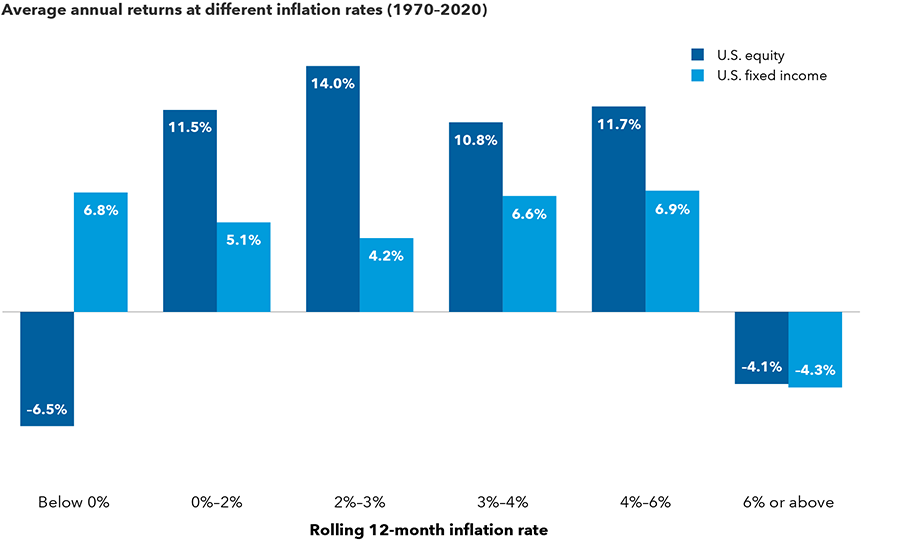
Sources: Capital Group, Bloomberg Index Services Ltd., Morningstar, Standard & Poor's. All returns are inflation-adjusted real returns. U.S. equity returns represented by the Standard & Poor’s 500 Composite Index. U.S. fixed income represented by Ibbotson Associates SBBI U.S. Intermediate-Term Government Bond Index from 1/1/1970–12/12/1975 and Bloomberg U.S. Aggregate Bond Index from 1/1/1976–12/31/2020. Inflation rates are defined by the rolling 12-month returns of the Ibbotson Associates SBBI U.S. Inflation Index. Returns are in USD.
An active approach
An active approach to fixed income investing is key, says Reithinger, as is the flexibility of the mandate to invest in a range of debt in Canada and around the world. Most recently, the Canadian Core Plus Fixed Income mandate reduced exposure to developed-market bonds while increasing exposure to emerging markets and inflation-linked debt. Portfolio duration stood at 7.5 years as of September 30, 2021 — lower than the mandate’s FTSE Canada Universe Bond Index benchmark of 8.1 years. Higher duration is typically associated with higher interest rate risk.
All of which brings us back to the question at hand: will the BoC succeed or fail to engineer a smooth exit out of pandemic emergency monetary stimulus?
“The BoC is treading a thin line between reigning in higher inflation and stopping the economic recovery, the outcome of which is still very much uncertain,” says Reithinger.
And after a potential first-half 2022 rate hike?
“My view is that the bank will be cautious over the next two years to allow the economic recovery to continue but it all depends on how successful the BoC was at engineering a smooth exit in the first place.”
© 2021 Morningstar, Inc. All rights reserved. The information contained herein: (1) is proprietary to Morningstar and/or its content providers; (2) may not be copied or distributed; and (3) is not warranted to be accurate, complete or timely. Neither Morningstar nor its content providers are responsible for any damages or losses arising from any use of this information. Past performance is no guarantee of future results.
Our latest insights
-
-
Currencies
-
Market Volatility
-
Market Volatility
-
Markets & Economy
RELATED INSIGHTS
Commissions, trailing commissions, management fees and expenses all may be associated with investments in investment funds. Please read the prospectus before investing. Investment funds are not guaranteed or covered by the Canada Deposit Insurance Corporation or by any other government deposit insurer. For investment funds other than money market funds, their values change frequently. For money market funds, there can be no assurances that the fund will be able to maintain its net asset value per security at a constant amount or that the full amount of your investment in the fund will be returned to you. Past performance may not be repeated.
Unless otherwise indicated, the investment professionals featured do not manage Capital Group‘s Canadian investment funds.
References to particular companies or securities, if any, are included for informational or illustrative purposes only and should not be considered as an endorsement by Capital Group. Views expressed regarding a particular company, security, industry or market sector should not be considered an indication of trading intent of any investment funds or current holdings of any investment funds. These views should not be considered as investment advice nor should they be considered a recommendation to buy or sell.
Statements attributed to an individual represent the opinions of that individual as of the date published and do not necessarily reflect the opinions of Capital Group or its affiliates. This information is intended to highlight issues and not be comprehensive or to provide advice. For informational purposes only; not intended to provide tax, legal or financial advice. Capital Group funds are available in Canada through registered dealers. For more information, please consult your financial and tax advisors for your individual situation.
Forward-looking statements are not guarantees of future performance, and actual events and results could differ materially from those expressed or implied in any forward-looking statements made herein. We encourage you to consider these and other factors carefully before making any investment decisions and we urge you to avoid placing undue reliance on forward-looking statements.
The S&P 500 Composite Index (“Index”) is a product of S&P Dow Jones Indices LLC and/or its affiliates and has been licensed for use by Capital Group. Copyright © 2025 S&P Dow Jones Indices LLC, a division of S&P Global, and/or its affiliates. All rights reserved. Redistribution or reproduction in whole or in part are prohibited without written permission of S&P Dow Jones Indices LLC.
FTSE source: London Stock Exchange Group plc and its group undertakings (collectively, the "LSE Group"). © LSE Group 2025. FTSE Russell is a trading name of certain of the LSE Group companies. "FTSE®" is a trade mark of the relevant LSE Group companies and is used by any other LSE Group company under licence. All rights in the FTSE Russell indices or data vest in the relevant LSE Group company which owns the index or the data. Neither LSE Group nor its licensors accept any liability for any errors or omissions in the indices or data and no party may rely on any indices or data contained in this communication. No further distribution of data from the LSE Group is permitted without the relevant LSE Group company's express written consent. The LSE Group does not promote, sponsor or endorse the content of this communication. The index is unmanaged and cannot be invested in directly.
BLOOMBERG® is a trademark and service mark of Bloomberg Finance L.P. and its affiliates (collectively “Bloomberg”). Bloomberg or Bloomberg’s licensors own all proprietary rights in the Bloomberg Indices. Neither Bloomberg nor Bloomberg’s licensors approves or endorses this material, or guarantees the accuracy or completeness of any information herein, or makes any warranty, express or implied, as to the results to be obtained therefrom and, to the maximum extent allowed by law, neither shall have any liability or responsibility for injury or damages arising in connection therewith.
MSCI does not approve, review or produce reports published on this site, makes no express or implied warranties or representations and is not liable whatsoever for any data represented. You may not redistribute MSCI data or use it as a basis for other indices or investment products.
Capital believes the software and information from FactSet to be reliable. However, Capital cannot be responsible for inaccuracies, incomplete information or updating of the information furnished by FactSet. The information provided in this report is meant to give you an approximate account of the fund/manager's characteristics for the specified date. This information is not indicative of future Capital investment decisions and is not used as part of our investment decision-making process.
Indices are unmanaged and cannot be invested in directly. Returns represent past performance, are not a guarantee of future performance, and are not indicative of any specific investment.
All Capital Group trademarks are owned by The Capital Group Companies, Inc. or an affiliated company in Canada, the U.S. and other countries. All other company names mentioned are the property of their respective companies.
Capital Group funds are offered in Canada by Capital International Asset Management (Canada), Inc., part of Capital Group, a global investment management firm originating in Los Angeles, California in 1931. Capital Group manages equity assets through three investment groups. These groups make investment and proxy voting decisions independently. Fixed income investment professionals provide fixed income research and investment management across the Capital organization; however, for securities with equity characteristics, they act solely on behalf of one of the three equity investment groups.
The Capital Group funds offered on this website are available only to Canadian residents.