Capital Group Funds (Canada)
- Summary
- Portfolio managers
- Distributions
- Literature
Monthly Fund Data (PDF)
Quarterly Holdings (XLSX)
Investment Objective
Long-term growth of capital and income through investments primarily in equity or equity-type securities with an emphasis on Canadian issuers.
Fund Description
A focus on sustainable and growing dividends
Emphasis on Canadian stocks, with flexibility to invest globally.
Emphasis on Canadian stocks, with flexibility to invest globally.
Fee update
Effective July 1, 2026, this fund’s management fee will be reduced. The MER shown does not reflect this change yet. MERs, which include management fees, will fully reflect the reduction in June 2027.
Returns
Growth of $10,000 since inception (Series A)
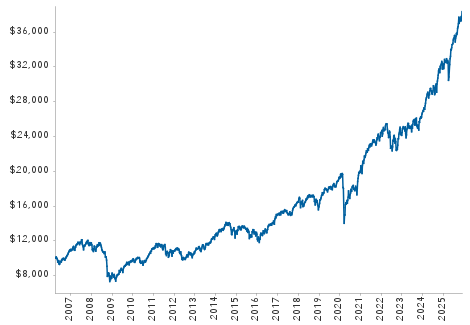
Returns include reinvestment of all distributions and do not reflect the effect of a sales charge. Past returns are not predictive of future returns.
| Returns (%) | Series A | |
| 1 month | 6.02 | |
| YTD | 15.01 | |
| 1 year* | 29.26 | |
| 3 years* | 21.62 | |
| 5 years* | 14.28 | |
| 10 years* | 12.74 | |
| 15 years* | 9.34 | |
| Lifetime* | 7.65 | |
| Lifetime (cumulative) | 342.26 | |
| 2025 | 20.14 | |
| 2024 | 19.79 | |
| 2023 | 10.74 | |
| 2022 | -1.36 | |
| 2021 | 23.06 |
*Annualized compound returns.
Portfolio information
| Fund assets ($mil) combined series | $329.2 | |
| Dividend yield1 | 2.33% | |
| Companies / issuers | 72 | |
| Income distributions paid | December | |
| Capital gains paid | December | |
| Portfolio turnover (2025) | 58% | |
| Trading expense ratio2 | 0.05% | |
| Weighted average market cap ($bil): | ||
| Portfolio | $337.9 | |
| Benchmark3 | $79.7 | |
| Top 10 holdings as a % of: | ||
| Portfolio | 35.9% | |
| Benchmark3 | 12.6% | |
Sector diversification
| Financials | 20.0% |
| Information Technology | 16.3% |
| Energy | 14.2% |
| Industrials | 12.6% |
| Materials | 11.4% |
| Consumer Discretionary | 6.5% |
| Consumer Staples | 4.7% |
| Utilities | 4.6% |
| Communication Services | 3.1% |
| Health Care | 1.1% |
| Real Estate | 0.5% |
| Cash and cash equivalents & other assets less liabilities |
4.9% |
Portfolio characteristics
| Series A | |
| FundSERV | CIF 849 |
| MER4 | 1.86% |
| Fund inception | Mar 31, 2006 |
| Minimum initial investment | $500 |
| Trade settlement | T+15 |
Portfolio managers
| Years with Capital / Years in profession | |
| Matt Hochstetler | 11 / 20 |
| Anirudh Samsi | 20 / 24 |
| Jason Smith | 19 / 29 |
Top 10 holdings
| % of Portfolio | |
| TSMC | 4.5 |
| Canadian Natural Resources | 4.3 |
| Micron Technology | 4.0 |
| Toronto-Dominion Bank | 3.9 |
| Restaurant Brands International | 3.8 |
| Power Corp. of Canada | 3.8 |
| Agnico Eagle Mines | 3.2 |
| SK hynix | 3.2 |
| Brookfield Infrastructure Partners | 2.6 |
| Philip Morris International | 2.5 |
| Total top 10 holdings | 35.8 |
Quarterly holdings (XLSX)
Geographic diversification
| Canada | 55.9% | |
| United States | 20.9% | |
| Emerging Markets | 9.5% | |
| Europe ex-UK | 4.4% | |
| United Kingdom | 3.2% | |
| Pacific Basin ex-Japan | 0.8% | |
| Japan | 0.4% |
| 1 | Income generated by portfolio securities, before expenses; does not reflect unitholder distributions. |
| 2 | As of December 31, 2025. |
| 3 | S&P/TSX Composite Index. |
| 4 |
Capital Group, at its discretion, currently waives some of its management fees or absorbs some expenses of certain Capital Group funds. Such waivers and absorptions may be terminated at any time, but can be expected to continue for certain portfolios until such time as such funds are of sufficient size to reasonably absorb all management fees and expenses incurred in their operations.
The management expense ratios for the portfolios are based on audited total expenses for the 12-month period ended December 31, 2025, and are expressed as an annualized percentage of daily average net assets during the period. Actual MERs may vary. For the 12-month period ended December 31, 2025, the total net asset values of the series were of sufficient size to reasonably absorb all management fees and expenses incurred in the operations of the funds attributable to the series, and therefore there were no waivers or absorptions during this period.
|
| 5 | Prior to May 27, 2024, the trade settlement cycle for Capital Group Funds (Canada) was trade date (T) + 2. |
| Updated on a monthly basis. | |
| Totals may not reconcile due to rounding. | |
| Commissions, trailing commissions, management fees and expenses all may be associated with investments in investment funds. Please read the prospectus before investing. The indicated rates of return are the historical annual compounded total returns including changes in unit value and reinvestment of all distributions and do not take into account sales, redemption, distribution or optional charges or income taxes payable by any unitholder that would have reduced returns. Investment funds are not guaranteed or covered by the Canada Deposit Insurance Corporation or by any other government deposit insurer. For investment funds other than money market funds, their values change frequently. For money market funds, there can be no assurances that the fund will be able to maintain its net asset value per security at a constant amount or that the full amount of your investment in the fund will be returned to you. Past performance may not be repeated. | |

Matt Hochstetler
Years at Capital: 11
Years in profession: 20
Based in San Francisco
Matt Hochstetler is an equity portfolio manager at Capital Group. Earlier in his career at Capital, as an equity investment analyst, he covered Latin America, Greece as a generalist and small-cap Canadian stocks. Prior to joining Capital, Matt cofounded the Emerging Markets Fund at Janus Capital, where he served as one of the portfolio managers on the fund. In addition, Matt co-managed the Janus Real Return Fund and was also an equity research analyst at Janus Capital. Before that, he worked at Bain & Company and Chase Capital Partners. He holds an MBA with high distinction from Harvard Business School and a bachelor’s degree Phi Beta Kappa in international finance and economics from the School of Foreign Service, Georgetown University. Matt is based in San Francisco.

Anirudh Samsi
Years at Capital: 20
Years in profession: 24
Based in San Francisco
Anirudh Samsi is an equity portfolio manager at Capital Group. Earlier in his career at Capital, he was an equity investment analyst covering U.S. money centres, investment banks and global IT services, the U.S. insurance industry, as well as asset managers. Prior to joining Capital, Anirudh was an investment analyst for Franklin Templeton Investments. He holds an MBA from the Indian Institute of Management and a bachelor's degree in commerce from the University of Mumbai. He also holds the Chartered Accountant® and Chartered Financial Analyst® designations.

Jason Smith
Years at Capital: 19
Years in profession: 29
Based in New York
Jason B. Smith is an equity portfolio manager at Capital Group. Earlier in his career at Capital, as an equity investment analyst, he covered European industrials (capital goods), airlines, aerospace and defence and Australian and New Zealand industrials companies. Prior to joining Capital, Jason was a director and senior analyst for Citigroup Investment Research. He holds a bachelor’s degree in business (finance and economics) from the University of Technology, Sydney.
| Capital Group funds and Capital International Asset Management (Canada), Inc., are part of Capital Group, a global investment management firm originating in Los Angeles, California in 1931. Capital Group manages equity assets through three investment groups. These groups make investment and proxy voting decisions independently. Fixed-income investment professionals provide fixed-income research and investment management across the Capital organization; however, for securities with equity characteristics, they act solely on behalf of one of the three equity investment groups. |
| Commissions, trailing commissions, management fees and expenses all may be associated with investments in investment funds. Please read the prospectus before investing. Investment funds are not guaranteed or covered by the Canada Deposit Insurance Corporation or by any other government deposit insurer. For investment funds other than money market funds, their values change frequently. For money market funds, there can be no assurances that the fund will be able to maintain its net asset value per security at a constant amount or that the full amount of your investment in the fund will be returned to you. Past performance may not be repeated. |
Distributions
|
Historical Prices & Distributions
Select Dates
From:
To:
| Prices for all series of Capital Group Canadian Focused Equity Fund (Canada) for the days November 20, 2007 through January 9, 2008 were restated on January 18, 2008 to correct an NAV pricing exception. |
| Commissions, trailing commissions, management fees and expenses all may be associated with investments in investment funds. Please read the prospectus before investing. Investment funds are not guaranteed or covered by the Canada Deposit Insurance Corporation or by any other government deposit insurer. For investment funds other than money market funds, their values change frequently. For money market funds, there can be no assurances that the fund will be able to maintain its net asset value per security at a constant amount or that the full amount of your investment in the fund will be returned to you. Past performance may not be repeated. |