Capital Group Funds (Canada)
- Summary
- Portfolio managers
- Distributions
- Literature
Monthly Fund Data (PDF)
Quarterly Holdings (XLSX)
Investment Objective
Steady income, capital preservation and long-term total return consistent with prudent management by investing mainly in a broad range of Canadian and global fixed-income securities.
Fund Description
A focus on capital preservation
Invests in Canadian, global and high-yield bonds, including emerging markets.
Invests in Canadian, global and high-yield bonds, including emerging markets.
Returns
Growth of $10,000 since inception (Series F)
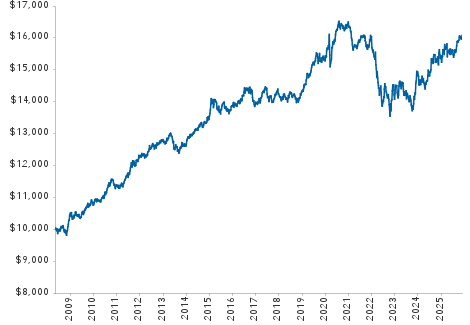
Returns include reinvestment of all distributions and do not reflect the effect of a sales charge. Past returns are not predictive of future returns.
| Returns (%) | Series F | |
| 1 month | 0.63 | |
| YTD | 2.21 | |
| 1 year* | 3.55 | |
| 3 years* | 4.22 | |
| 5 years* | 0.44 | |
| 10 years* | 1.30 | |
| 15 years* | 2.26 | |
| Lifetime* | 2.72 | |
| Lifetime (cumulative) | 62.85 | |
| 2025 | 2.90 | |
| 2024 | 3.37 | |
| 2023 | 6.07 | |
| 2022 | -12.21 | |
| 2021 | -2.63 |
*Annualized compound returns.
Portfolio information
| Fund assets ($mil) combined series | $111.4 | |
| Companies / issuers | 162 | |
| Income distributions paid | Monthly | |
| Capital gains paid | December | |
| Portfolio turnover (2025) | 48% | |
| Trading expense ratio1 | 0.02% | |
| Effective duration (years)2 | 7.6 | |
| Yield to maturity | 3.93% | |
| Yield to worst 3 | 3.84% | |
Asset breakdown4
| Developed markets (investment grade) | ||
| Government | 44.8% | |
| Corporate | 34.9% | |
| Inflation-linked | 2.6% | |
| Asset backed | 1.0% | |
| Mortgage backed | 0.3% | |
| Subtotal | 83.6% | |
| Corporate high yield | 4.4% | |
| Emerging market debt5 | 4.3% | |
| Other | — | |
| Cash and cash equivalents & other assets less liabilities |
7.7% | |
Portfolio characteristics
| Series F | |
| FundSERV | CIF 821 |
| MER6 | 0.50% |
| Fund inception | Apr 30, 2008 |
| Minimum initial investment | $500 |
| 12-month distribution rate7 | 3.3% |
| Trade settlement | T+18 |
Portfolio managers
| Years with Capital / Years in profession | |
| Tim Ng | 12 / 19 |
| Tom Reithinger | 12 / 15 |
Top 10 issuers4
| % of Portfolio | Yield % | |
| Province of Ontario | 8.3 | 4.1 |
| Canada Housing Trust No.1 | 7.6 | 3.0 |
| Canada, Government of | 5.3 | 3.7 |
| CPPIB Capital Inc | 4.2 | 3.5 |
| Quebec, Province of | 4.1 | 4.1 |
| Royal Bank of Canada | 3.7 | 3.5 |
| U.S. Treasury | 3.4 | 4.5 |
| Goldman Sachs | 2.7 | 4.2 |
| Ford Credit Canada Co Cie Credit Ford Du Canada | 2.4 | 3.4 |
| Alphabet | 2.4 | 4.3 |
Country and currency4
| Top 5 countries | |
| Canada | 60.7% |
| United States | 24.5% |
| France | 0.9% |
| Mexico | 0.6% |
| Germany | 0.5% |
| Top 5 currencies (after hedging) | |
| Canadian Dollar | 98.2% |
| Yen | 0.7% |
| Mexican Peso | 0.2% |
| Malaysian Ringgit | 0.2% |
| Indian Rupee | 0.2% |
Bond quality summary4
| % of Bonds | |
| AAA/Aaa | 15.7 |
| AA/Aa | 34.0 |
| A | 21.9 |
| BBB/Baa | 18.2 |
| BB/Ba | 7.0 |
| B | 2.2 |
| CCC/Caa & below | 0.8 |
| Unrated | 0.2 |
| Investment grade | 89.8 |
| Below investment grade | 10.0 |
| 1 | As of December 31, 2025. |
| 2 | Includes the impact of callable bonds. Duration is a measure of the approximate sensitivity of a bond portfolio's value to interest rate changes. |
| 3 | Reflects the lowest yield that can be realized by either calling or putting on one of the available call/put dates, or holding a bond to maturity. Includes the underlying holdings in Capital Group Global High Income Opportunities (LUX). |
| 4 | Includes the Fund's direct portfolio holdings as well as the holdings through Capital Group Global High Income Opportunities (LUX). |
| 5 | May include a portion of investment-grade issues. |
| 6 |
Capital Group, at its discretion, currently waives some of its management fees or absorbs some expenses of certain Capital Group funds. Such waivers and absorptions may be terminated at any time, but can be expected to continue for certain portfolios until such time as such funds are of sufficient size to reasonably absorb all management fees and expenses incurred in their operations.
The management expense ratios for the portfolios are based on audited total expenses for the 12-month period ended December 31, 2025, and are expressed as an annualized percentage of daily average net assets during the period. Actual MERs may vary. For the 12-month period ended December 31, 2025, the total net asset values of the series were of sufficient size to reasonably absorb all management fees and expenses incurred in the operations of the funds attributable to the series, and therefore there were no waivers or absorptions during this period.
|
| 7 | Reflects the sum of income distributions over the trailing 12 months, divided by the sum of the previous month's ending NAV plus any capital gains distributed over the 12-month period. |
| 8 | Prior to May 27, 2024, the trade settlement cycle for Capital Group Funds (Canada) was trade date (T) + 2. |
| Not available to U.S. residents. | |
| Updated on a monthly basis. | |
| Totals may not reconcile due to rounding. | |
| Commissions, trailing commissions, management fees and expenses all may be associated with investments in investment funds. Please read the prospectus before investing. The indicated rates of return are the historical annual compounded total returns including changes in unit value and reinvestment of all distributions and do not take into account sales, redemption, distribution or optional charges or income taxes payable by any unitholder that would have reduced returns. Investment funds are not guaranteed or covered by the Canada Deposit Insurance Corporation or by any other government deposit insurer. For investment funds other than money market funds, their values change frequently. For money market funds, there can be no assurances that the fund will be able to maintain its net asset value per security at a constant amount or that the full amount of your investment in the fund will be returned to you. Past performance may not be repeated. | |

Tim Ng
Years at Capital: 12
Years in profession: 19
Based in Los Angeles
Timothy Ng is a fixed income portfolio manager at Capital Group. As a fixed income investment analyst, he covers U.S. Treasuries, TIPS, and interest rate swaps. Prior to joining Capital, Tim was an analyst for a global macro hedge fund at WCG Management L.P., a director in U.S. dollar rates trading at UBS Investment Bank and an assistant vice president in fixed income trading at Barclays Capital. He holds a bachelor’s degree with honours in computer science from the University of Waterloo, Ontario.

Tom Reithinger
Years at Capital: 12
Years in profession: 15
Based in London
Tom Reithinger is a fixed income portfolio manager at Capital Group. Earlier in his career at Capital, as a fixed income investment analyst, he covered sovereign debt. Prior to joining Capital, Thomas worked as an analyst at Monashee Investment Management and as a research associate at Dix Hills Partners. He holds an MBA from Harvard Business School and double bachelor's degrees in business & management and computer engineering from Rensselaer Polytechnic Institute graduating summa cum laude.
| Capital Group funds and Capital International Asset Management (Canada), Inc., are part of Capital Group, a global investment management firm originating in Los Angeles, California in 1931. Capital Group manages equity assets through three investment groups. These groups make investment and proxy voting decisions independently. Fixed-income investment professionals provide fixed-income research and investment management across the Capital organization; however, for securities with equity characteristics, they act solely on behalf of one of the three equity investment groups. |
| Commissions, trailing commissions, management fees and expenses all may be associated with investments in investment funds. Please read the prospectus before investing. Investment funds are not guaranteed or covered by the Canada Deposit Insurance Corporation or by any other government deposit insurer. For investment funds other than money market funds, their values change frequently. For money market funds, there can be no assurances that the fund will be able to maintain its net asset value per security at a constant amount or that the full amount of your investment in the fund will be returned to you. Past performance may not be repeated. |
Distributions
|
Historical Prices & Distributions
Select Dates
From:
To:
| Commissions, trailing commissions, management fees and expenses all may be associated with investments in investment funds. Please read the prospectus before investing. Investment funds are not guaranteed or covered by the Canada Deposit Insurance Corporation or by any other government deposit insurer. For investment funds other than money market funds, their values change frequently. For money market funds, there can be no assurances that the fund will be able to maintain its net asset value per security at a constant amount or that the full amount of your investment in the fund will be returned to you. Past performance may not be repeated. |