Market Volatility
Categories
Currencies
Will the U.S. dollar continue to weaken?
 Andrew Cormack
 Philip Chitty
 Tom Reithinger
 Harry Phinney
April 10, 2023
Is the U.S. dollar at a turning point? A sharp decline late last year has left many wondering if the greenback’s decade-long bull run is coming to an end.
A continuing downward trend would be welcome news for investors in international bonds and equities, whose total returns have been eroded by currency translation effects. And, in many ways, a correction is overdue. From its trough in 2011 to the recent peak in late 2022, the U.S. dollar rose 45% against J.P. Morgan‘s inflation-adjusted broad-based basket of developed and emerging market currencies. This has left it overvalued against most major and emerging markets (EM) currencies on a purchasing power parity (PPP) basis.
But these metrics suggest the dollar has been overvalued for quite some time, and valuation alone has not been enough to bring it back down. For a longer term decline to set in, there must be one or more catalysts. These are a few we are watching that could influence the direction of the dollar.
1. Interest rate differential between the U.S. and Europe is narrowing
In the pre-COVID era, interest rates were low in all the major economies. Nevertheless, rates in the U.S. were higher than those in Europe, Japan and other developed markets. That was the primary factor propelling the U.S. dollar higher against most currencies. Investors around the world could earn higher interest rates while enjoying safe haven status. High forward interest rates also meant investors could buy bonds denominated in the euro and the yen, hedge them into U.S. dollars and earn a higher interest rate (carry).
The U.S. dollar is significantly above long-term average
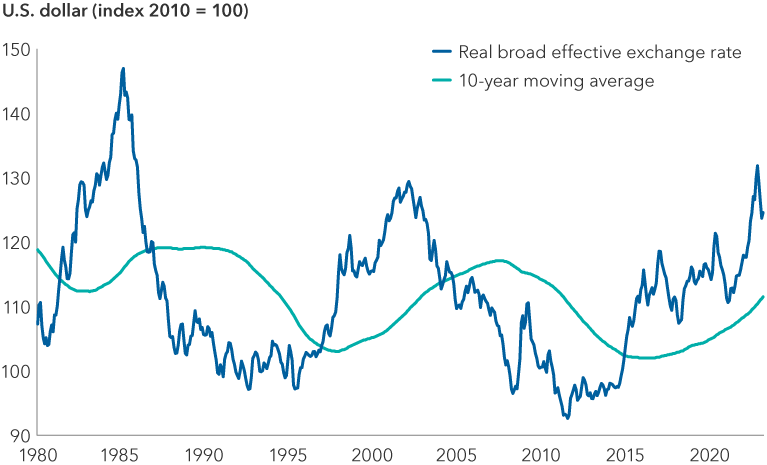
Sources: Capital Group, J.P. Morgan. Data as of March 31, 2023. The real broad effective exchange rate measures the value of the U.S. dollar against a group of developed and emerging market currencies and adjusts for inflation using the U.S. Consumer Price Index (CPI). CPI is a commonly used measure of inflation that measures the average change over time in the prices paid by consumers for a basket of goods and services.
Several factors supported comparatively higher U.S. nominal and real interest rates: a hawkish Federal Reserve more determined to raise interest rates than the European Central Bank (ECB), the Bank of England (BOE) or the Bank of Japan (BOJ), plus a strong and productive U.S. economy and higher inflation.
Now this picture is changing, especially relative to the euro. The swift collapse of three U.S. regional banks — Silicon Valley Bank, Signature Bank and Silvergate Bank — has led bond markets to lower expectations for both the terminal federal funds rate and U.S. Treasuries across the yield curve. Meanwhile, European bond yields could still move higher as the ECB stays on its rate-hiking path should inflation pressures persist.
It’s also been interesting to see that in the most recent episode of market volatility attributable to the banking sector, the dollar has hovered in a range of 92 to 94 cents to the euro. Swift action by the Federal Reserve to provide dollar liquidity via swap lines with other central banks provided support to the U.S. currency. (Swap lines are agreements between two central banks to exchange currencies. They allow a central bank to obtain foreign currency from the central bank that issues it and distribute it to commercial banks in their country.)
Overall we expect the differential between U.S. interest rates and those in Europe to narrow. This could remove some support for the dollar, which was trading around 92 cents to the euro as of March 31.
One reason for a potential narrowing: The ECB started hiking later than the Fed. After raising rates by 250 basis points (bps) last year, the ECB probably has further to go if it wants to bring inflation closer to its 2% target. Meanwhile, the Fed may be closer to pausing, or potentially cutting rates, than it had anticipated before the U.S. bank failures. Markets expect the rate gap to decrease by about 90 bps (from around 1.8% to 0.9%) by the end of the year.
Meanwhile, the BOE increased its policy rate by nearly 425 bps, putting U.K. nominal and real interest rates closer to the U.S. than either the ECB or the BOJ. Its actions helped lift the pound 15% against the U.S. dollar after U.K. government turmoil forced it to an all-time low in September 2022. What happens next to the pound sterling will likely depend more on potential further rate hikes than any other variable. At this point, the BOE seems less aggressive than the ECB or the Fed.
The dollar follows real rates
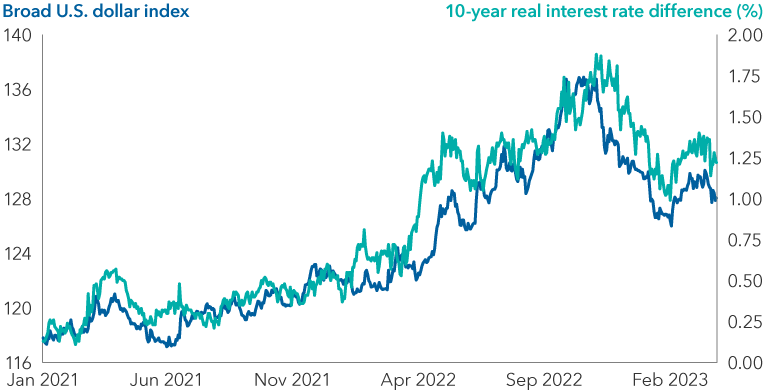
Sources: Capital Group, Macrobond, J.P. Morgan. Data as of March 29, 2023. The 10-year real rate differential measures the difference in inflation-adjusted interest rates between the U.S. and a developed market group consisting of Germany, Japan and the U.K. The broad U.S. dollar index is an effective exchange rate that measures the value of the U.S. dollar against a group of developed and emerging market currencies.
2. Economic outlook across various markets and countries is improving
Growth prospects for China, Europe, Japan and emerging markets are looking brighter. Just a few months ago, China’s economy was hampered by the government’s zero-COVID policy, Europe was facing a potential winter energy crisis, Japan’s economy unexpectedly contracted in the third quarter and the risk of a global recession loomed over emerging markets.
China’s sooner-than-expected economic reopening improves 2023 growth prospects for the country as well as the rest of the global economy. After years of being trapped at home, many Chinese consumers have the savings and demand to fuel spending. Measures of consumer activity and manufacturing already show signs of improvement. China’s government has been providing billions of dollars to shore up its ailing property market and also appears closer to wrapping up reforms for private sector technology companies.
2023 global growth outlook improves
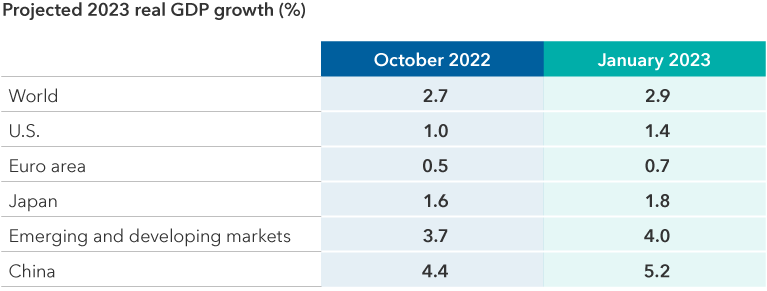
Source: International Monetary Fund. Data as of January 2023.
European economic data show reduced risks of a deep recession, as forward-looking manufacturing and service sector Purchasing Managers’ Index (PMI) data point to better conditions. The sharp reversal in energy prices due to a warm winter is helping manufacturers and consumers.
Japan’s economy is also proving to be resilient. Consumer demand is holding up despite higher inflation. The service sector shows signs of improving, the labour market remains tight and manufacturing should get support from China’s recovery. Corporate investment may also be improving.
3. Portfolio flows may begin to support the euro
In recent years the ECB’s negative interest rate policy and quantitative easing measures kept foreign investors away, but those policies look set to change. If policy rates between the ECB and the Fed narrow as expected, another driver of euro weakness and dollar support is likely to dissipate.
Europeans have been buying far more foreign bonds than international investors have been buying into Europe. As a result, the five-year moving average for net bond flows in Europe has been negative since 2014. While it’s hard to pinpoint, a majority of outflows likely went to the U.S., given the market’s liquidity and size.
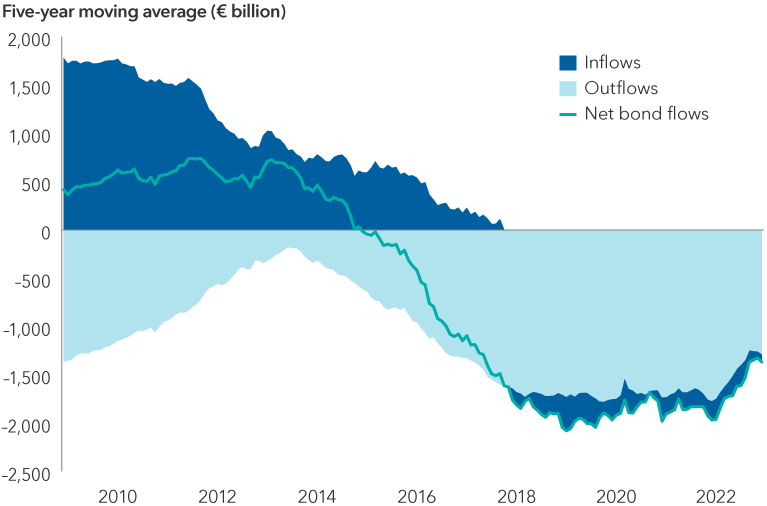
Sources: Capital Group, Haver Analytics. Data as of December 31, 2022. Outflows = eurozone bond purchases abroad. Inflows = foreign purchases of eurozone bonds. Data start date is December 2008.
Meanwhile, the carry advantage between the U.S. and the eurozone is becoming less compelling. When the Fed aggressively hiked rates before the ECB, an attractive carry opportunity arose. Even after the cost of hedging currency risk, using euro-denominated assets to buy dollar assets was attractive. However, that hedged trade is becoming less profitable, which should reduce euro selling and flows into the dollar.
4. A rising Japanese yen: possible but fragile
The Bank of Japan’s extreme monetary policies have long kept the yen from appreciating against the dollar. The BOJ has implemented yield curve control (YCC) — pegging 10-year government bond yields near zero rate — as well as negative interest rates and massive quantitative easing to pump inflation closer to its 2% target.
Signs of stronger inflation may finally be here. Japan’s core consumer price index, which excludes fresh food, rose 4.2% year over year in January. And some companies appear to be complying with BOJ Governor Haruhiko Kuroda’s call for wage increases above the rate of inflation.
If the BOJ believes inflation can stay around 2%, it will have cover to gradually unwind some of its policies. In a surprise move last December, the central bank loosened its YCC policy slightly, and we expect it to make a similar announcement this year.
Allowing 10-year yields to rise should support the yen. Trading around ¥133 to the dollar, it is among the most undervalued currencies, according to our currency analyst Jens Søndergaard’s valuation model. Even slightly higher domestic rates would incrementally reduce Japanese dollar demand.
In addition, an increase in Japanese interest rates and potential volatility from BOJ policy uncertainty could make carry trades more expensive. However, the interest rate differential between the yen and the dollar also depends on Fed action. If stubborn inflation pressures force the Fed to raise rates beyond current expectations, the yen could remain depressed.
5. Emerging markets are further along the curve on monetary policy
When inflation picked up in 2021, emerging market (EM) central banks responded quickly and aggressively. Latin American central banks led the charge. Brazil’s central bank started hiking rates in March 2021 and took its policy rate from 2.00% to the current 13.75%. Eastern European central banks picked up their pace after Russia’s invasion of Ukraine. And the spike in energy prices last year led some Asian central banks to increase rates.
EM central banks raised rates aggressively
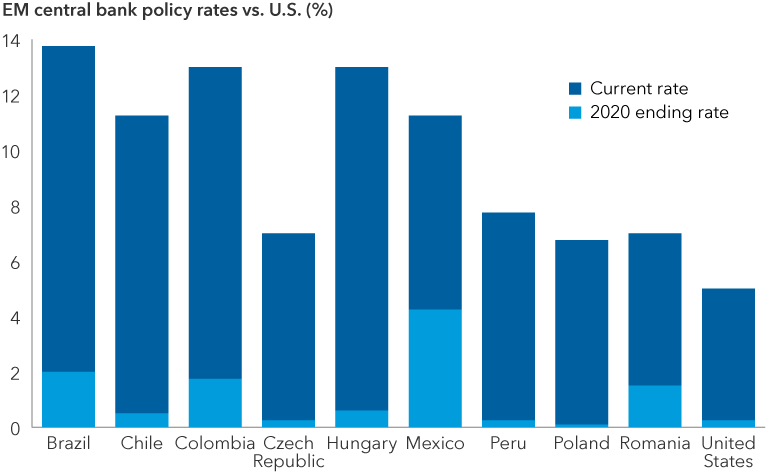
Source: Bloomberg. Data as of March 31, 2023.
High interest rates in nominal and real terms have been supportive of EM currencies, which have attracted investors looking for income. The Brazilian real and Mexican peso were among the few currencies that strengthened against the U.S. dollar last year. In addition to attractive nominal and real yields, macroeconomic conditions have improved. The tilt toward more positive fundamentals is likely to continue overriding political risk concerns in those countries for now.
In many Asian economies, a combination of attractive interest rates, improving growth prospects and strong macroeconomic fundamentals are supportive of currencies.
China’s economic reopening should broadly boost Asian growth. In Southeast Asia, we believe the Thai baht is becoming more compelling as increased tourism drives up economic growth rates and foreign flows. A rebound in commodity exports from Indonesia to China may benefit the Indonesian rupiah.
The Korean won also appears to be undervalued. Exports to China will likely rebound, and Korea’s financial position could get stronger. As a large energy importer, Korea faced a severe headwind from last year’s jump in prices — hurting businesses and consumers — but the drag should lessen significantly this year.
Further support to EM currencies could come when the Fed stops raising rates. In that case, EM central banks may find it easier to lower their policy rates, especially if inflation keeps easing or growth softens. That said, the rate differential between many emerging markets and the U.S. will likely remain attractive, providing a potential tailwind to EM currencies.
What are the risks to this view?
If the global economy weakens more than expected as the full impact of monetary tightening makes its way through the system, the U.S. dollar could find support given its status as a safe haven currency. This would likely delay a repricing of the dollar to its fair value.
A long-term U.S. dollar decline also requires Europe, Japan, China and other emerging markets to show substantial improvement in economic fundamentals, including gains in productivity and economic reforms favoring free enterprise and capital investments. Over the past decade, the U.S. economy has gained its edge from technology and health care innovations as well as an economic incentive system that supports entrepreneurship.
While it is early, we do see modest signs of change. In Europe, Italy has laid out a post-pandemic recovery and resilience plan. If properly executed, it would be meaningful, as Italy has been a European growth headwind for many years. Germany is breaking from its long-held stance of fiscal conservatism and is willing to provide a boost to consumers and industries even if it means running larger deficits along with other EU members. And while increased fiscal spending in Europe should stimulate growth, it’s unclear how it will affect inflation and the ECB’s efforts.
Other conditions in Europe are also looking more favourable. Fears of a peripheral debt crisis or a eurozone breakup have decreased. The eurozone’s responses to Brexit, the pandemic and Russia’s invasion of Ukraine appear to have helped reassure investors that the region is a safer place to invest than it was a decade ago.
Japan is starting on a slow path of normalizing its monetary policy while providing some support to the economy. Meanwhile, many of the large emerging markets have shown monetary discipline by keeping rates high in the face of inflation and tempering fiscal stimulus. But a structural and sustained uplift in financial assets, including currencies, will depend on economic reforms varying from labour and land acquisition laws to intellectual property protection and joint venture policies.
Learn more about
Phillip Chitty is a portfolio manager for Capital Group Monthly Income Portfolio™ (Canada) and Capital Group World Bond Fund™ (Canada). Andrew Cormack is a portfolio manager for Capital Group Global Balanced Fund™ (Canada) and Capital Group World Bond Fund™ (Canada). Thomas Reithinger is a portfolio manager for Capital Group Canadian Core Plus Fixed Income Fund™ (Canada) and Capital Group World Bond Fund™ (Canada).
Eurozone Purchasing Managers’ Index (PMI) is a measure of business activity compared to the previous month, based on a survey of around 5,000 companies based in the euro area manufacturing and service sectors.
This report, and any product, index or fund referred to herein, is not sponsored, endorsed or promoted in any way by J.P. Morgan or any of its affiliates who provide no warranties whatsoever, express or implied, and shall have no liability to any prospective investor, in connection with this report.
Our latest insights
-
-
Market Volatility
-
-
Currencies
-
Market Volatility
RELATED INSIGHTS
-
Asset Allocation
-
Market Volatility
-
Market Volatility
Commissions, trailing commissions, management fees and expenses all may be associated with investments in investment funds. Please read the prospectus before investing. Investment funds are not guaranteed or covered by the Canada Deposit Insurance Corporation or by any other government deposit insurer. For investment funds other than money market funds, their values change frequently. For money market funds, there can be no assurances that the fund will be able to maintain its net asset value per security at a constant amount or that the full amount of your investment in the fund will be returned to you. Past performance may not be repeated.
Unless otherwise indicated, the investment professionals featured do not manage Capital Group‘s Canadian investment funds.
References to particular companies or securities, if any, are included for informational or illustrative purposes only and should not be considered as an endorsement by Capital Group. Views expressed regarding a particular company, security, industry or market sector should not be considered an indication of trading intent of any investment funds or current holdings of any investment funds. These views should not be considered as investment advice nor should they be considered a recommendation to buy or sell.
Statements attributed to an individual represent the opinions of that individual as of the date published and do not necessarily reflect the opinions of Capital Group or its affiliates. This information is intended to highlight issues and not be comprehensive or to provide advice. For informational purposes only; not intended to provide tax, legal or financial advice. Capital Group funds are available in Canada through registered dealers. For more information, please consult your financial and tax advisors for your individual situation.
Forward-looking statements are not guarantees of future performance, and actual events and results could differ materially from those expressed or implied in any forward-looking statements made herein. We encourage you to consider these and other factors carefully before making any investment decisions and we urge you to avoid placing undue reliance on forward-looking statements.
The S&P 500 Composite Index (“Index”) is a product of S&P Dow Jones Indices LLC and/or its affiliates and has been licensed for use by Capital Group. Copyright © 2026 S&P Dow Jones Indices LLC, a division of S&P Global, and/or its affiliates. All rights reserved. Redistribution or reproduction in whole or in part are prohibited without written permission of S&P Dow Jones Indices LLC.
FTSE source: London Stock Exchange Group plc and its group undertakings (collectively, the "LSE Group"). © LSE Group 2026. FTSE Russell is a trading name of certain of the LSE Group companies. "FTSE®" is a trade mark of the relevant LSE Group companies and is used by any other LSE Group company under licence. All rights in the FTSE Russell indices or data vest in the relevant LSE Group company which owns the index or the data. Neither LSE Group nor its licensors accept any liability for any errors or omissions in the indices or data and no party may rely on any indices or data contained in this communication. No further distribution of data from the LSE Group is permitted without the relevant LSE Group company's express written consent. The LSE Group does not promote, sponsor or endorse the content of this communication. The index is unmanaged and cannot be invested in directly.
BLOOMBERG® is a trademark and service mark of Bloomberg Finance L.P. and its affiliates (collectively “Bloomberg”). Bloomberg or Bloomberg’s licensors own all proprietary rights in the Bloomberg Indices. Neither Bloomberg nor Bloomberg’s licensors approves or endorses this material, or guarantees the accuracy or completeness of any information herein, or makes any warranty, express or implied, as to the results to be obtained therefrom and, to the maximum extent allowed by law, neither shall have any liability or responsibility for injury or damages arising in connection therewith.
The MSCI information may only be used for your internal use, may not be reproduced or redisseminated in any form and may not be used as a basis for or a component of any financial instruments or products or indices. None of the MSCI information is intended to constitute investment advice or a recommendation to make (or refrain from making) any kind of investment decision and may not be relied on as such. Historical data and analysis should not be taken as an indication or guarantee of any future performance analysis, forecast or prediction. The MSCI information is provided on an “as is” basis and the user of this information assumes the entire risk of any use made of this information. MSCI, each of its affiliates and each other person involved in or related to compiling, computing or creating any MSCI information (collectively, the “MSCI Parties”) expressly disclaims all warranties (including, without limitation, any warranties of originality, accuracy, completeness, timeliness, non-infringement, merchantability and fitness for a particular purpose) with respect to this information. Without limiting any of the foregoing, in no event shall any MSCI Party have any liability for any direct, indirect, special, incidental, punitive, consequential (including, without limitation, lost profits) or any other damages. (www.msci.com)
Capital believes the software and information from FactSet to be reliable. However, Capital cannot be responsible for inaccuracies, incomplete information or updating of the information furnished by FactSet. The information provided in this report is meant to give you an approximate account of the fund/manager's characteristics for the specified date. This information is not indicative of future Capital investment decisions and is not used as part of our investment decision-making process.
Indices are unmanaged and cannot be invested in directly. Returns represent past performance, are not a guarantee of future performance, and are not indicative of any specific investment.
All Capital Group trademarks are owned by The Capital Group Companies, Inc. or an affiliated company in Canada, the U.S. and other countries. All other company names mentioned are the property of their respective companies.
Capital Group funds are offered in Canada by Capital International Asset Management (Canada), Inc., part of Capital Group, a global investment management firm originating in Los Angeles, California in 1931. Capital Group manages equity assets through three investment groups. These groups make investment and proxy voting decisions independently. Fixed income investment professionals provide fixed income research and investment management across the Capital organization; however, for securities with equity characteristics, they act solely on behalf of one of the three equity investment groups.
The Capital Group funds offered on this website are available only to Canadian residents.