Market Volatility
Categories
Demographics & Culture
How population decline could upend the global economy
 Jared Franz
March 14, 2024
China recently joined the long list of countries that had more deaths than births in 2023, underscoring a declining population trend that could upend the global economy. Demographic changes have major implications.
The United Nations predicts the world will reach peak population around 2086, but I think that figure may be optimistic. One reason is because the pandemic-era baby bust in some countries may have worsened the decline, and the problem appears to be long-lasting. Even in certain African and Latin American countries, where birthrates are historically high, the number of newborns has dropped closer to the replacement rate of 2.1 children per woman. Given these trends, humanity’s population could peak around 2050.
Humanity’s population growth may peak earlier than projected

Sources: Capital Group, United Nations (UN) Population Division. Figures reflect UN population estimates for 2023, as of July 2022. Low population forecast reflects a fertility rate that is 0.5 births per woman lower than the median projections.
Crossing a demographics point of no return
But what does a planet with fewer people mean for society? It’s a position the modern world hasn’t been in, so we would be crossing a demographics Rubicon.
Demographics influence what people buy and a company’s revenue potential. From an economist’s perspective, it helps determine monetary policy and, ultimately, the well-being of each successive generation.
I prefer to look at countries individually because there are many idiosyncrasies, whether cultural or policy related. In the United States, demographic trends are favourable for growth compared to developed economies even though birthrates have dropped rapidly since the 1960s to the current level of 1.7%. That figure may be low, but it is higher than Europe, Japan and other developed economies. I think the U.S. population decline will be less severe, in part because immigration policies are more liberal. Data shows that immigrants tend to have more children.
Japan is likely the most studied example of a shrinking society. The country has seen its population fall off for several decades, and its experience shows how quickly that can snowball. Japan reported 20,000 fewer people in 2008, and that figure has since ballooned to 831,872 fewer people in 2023. Prime Minister Fumio Kishida called the trend “the gravest crisis our country faces.”
Most people live in countries with fertility rates below replacement level
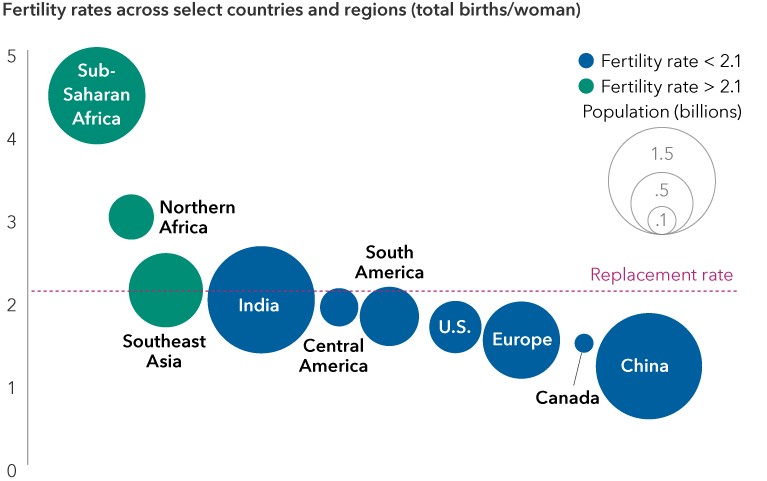
Sources: Capital Group, United Nations (U.N.) Population Division. Fertility rates reflect latest estimates for 2023, published July 2022.
China’s population decline has just begun, but I suspect it will face challenges not unlike Japan. How the Chinese government responds, in terms of economic stimulus and productivity expectations, will be important. In some ways, China may be more vulnerable since its economic development is much lower than when Japan’s population started to shrink. China ended its one-child policy in 2016 and has since introduced financial incentives for couples to have multiple children, but so far it hasn’t helped.
I won’t say it’s impossible to reverse population trends, but many Nordic countries have tried and failed to stem the lowering tide of demographics. They’ve offered everything from financial incentives to child care programs, but these plans have barely moved the needle, if at all.
As a result of China’s population decline, countries that rely on it for trade, such as Australia and Southeast Asian countries, could experience slower economic growth. But there are opportunities as well, since several of these emerging markets have better demographics and could offer incentives to bring supply chains home.
Declining population is negative for growth
Economists care about demographics for a reason. Put simply, the long-run economic growth rate of a country depends heavily on population growth, with the other piece of the puzzle being productivity, which measures worker efficiency. That is, if you have population growing at 2% and productivity at about 1%, a country’s gross domestic product is about 3%.
Sustained growth flows through to eventually increase income per person — an important indicator of the overall health of an economy. Over past generations, income has been growing for much of the world, alongside quality of life.
The obvious takeaway from population decline is fewer workers as more people retire. This can lead to an imbalance as government revenues from taxes fall and spending on retirees increases. When this happens, young people tend to leave that country or society, further exacerbating the problem.
Innovation can lead to productivity gains
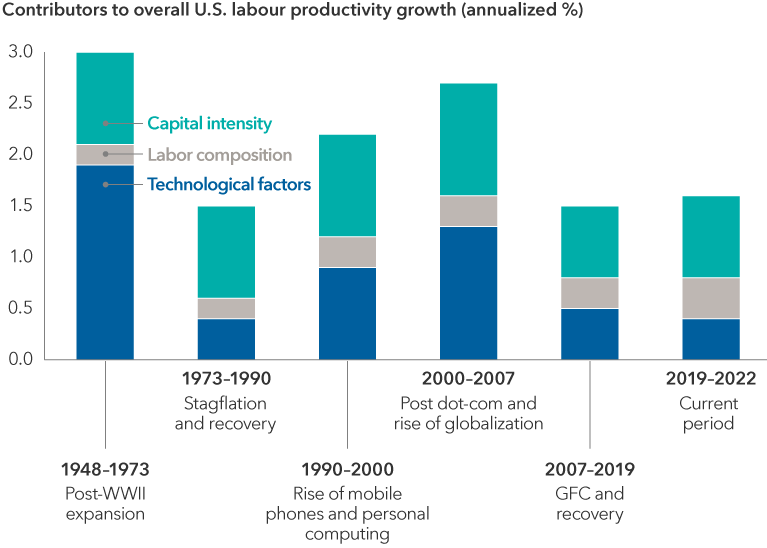
Sources: Capital Group, Bureau of Labor and Statistics. Data last updated as of 11/21/2023.
There are also far-reaching consequences for industries ranging from consumer goods to health care and housing. In the case of the latter, supply scarcity could worsen as labour shortages and older people choosing to age in place rather than sell have kept home prices high. It will be essential for companies to continue to adapt. For example, as U.S. mortgage rates surged from around 3% to 8% when the U.S. Federal Reserve began raising rates in March 2022, homebuilding company Lennar offered large rate buydowns to customers, which helped boost affordability.
Investors have rightfully focused on health care as an area ripe for innovation to deal with declining birth rates, longer life expectancy and rising labour costs. For example, U.S. pharmacy company CVS Health has responded to these demographic trends via services such as walk-in clinics and programs that offer lower drug prices. The company has also sought to reduce costs by integrating its supply chain, including acquisitions of insurance companies and drug price negotiators.
Price distortions
It might seem ridiculous to write about deflation given the yearslong battle central banks worldwide are waging against rapid price increases. However, Japan presents a compelling case study of why deflation, or falling prices, may be the result of demographic shifts.
The scenario is straightforward: Every day in Japan there are fewer people and less demand for goods and services, which exerts a downward pressure on prices. When this happens, economic slumps or recessions are more likely, and typical central bank toolkits to combat downturns — such as lowering rates — aren’t as effective. The Bank of Japan implemented a negative interest rate policy in 2016 to spur economic growth, but that policy is largely viewed as a failure as GDP has generally been weak since the early 1990s.
Deflation is a problem no central bank wants to wrestle with. Falling prices are associated with stagnant growth, weak spending and low overall confidence in the future. It’s basically kryptonite for the economy.
Japan is just one example. There are some influential economists who think declining demographics could lead to structurally higher inflation as a dwindling labour force pushes wages and production costs higher.
Robots to the rescue?
There’s an unintentional collision of two forces happening right now: demographics and artificial intelligence (AI). These two disruptive megatrends will change the future of work across health care, manufacturing, commerce and more.
Some might look at current demographic trends and think the world will be negatively impacted. Others note fewer people could mean less stress on the environment. There is a strong relationship between population growth and carbon dioxide emissions: When economic activity increases, so do CO2 emissions.
AI could herald a new era of increases in productivity, so perhaps we don’t need as many people as we did in the past for growth.
It’s still very early, but I hope AI can fill the gaps left by demographic trends so that some of the worst-case scenarios projected won’t happen. Instead, we’ll be looking at a society that’s not just resilient, but very adaptable to potential shocks.
Learn more about
Our latest insights
-
-
Market Volatility
-
-
Currencies
-
Market Volatility
RELATED INSIGHTS
-
Active Management
-
-
Trade
Commissions, trailing commissions, management fees and expenses all may be associated with investments in investment funds. Please read the prospectus before investing. Investment funds are not guaranteed or covered by the Canada Deposit Insurance Corporation or by any other government deposit insurer. For investment funds other than money market funds, their values change frequently. For money market funds, there can be no assurances that the fund will be able to maintain its net asset value per security at a constant amount or that the full amount of your investment in the fund will be returned to you. Past performance may not be repeated.
Unless otherwise indicated, the investment professionals featured do not manage Capital Group‘s Canadian investment funds.
References to particular companies or securities, if any, are included for informational or illustrative purposes only and should not be considered as an endorsement by Capital Group. Views expressed regarding a particular company, security, industry or market sector should not be considered an indication of trading intent of any investment funds or current holdings of any investment funds. These views should not be considered as investment advice nor should they be considered a recommendation to buy or sell.
Statements attributed to an individual represent the opinions of that individual as of the date published and do not necessarily reflect the opinions of Capital Group or its affiliates. This information is intended to highlight issues and not be comprehensive or to provide advice. For informational purposes only; not intended to provide tax, legal or financial advice. Capital Group funds are available in Canada through registered dealers. For more information, please consult your financial and tax advisors for your individual situation.
Forward-looking statements are not guarantees of future performance, and actual events and results could differ materially from those expressed or implied in any forward-looking statements made herein. We encourage you to consider these and other factors carefully before making any investment decisions and we urge you to avoid placing undue reliance on forward-looking statements.
The S&P 500 Composite Index (“Index”) is a product of S&P Dow Jones Indices LLC and/or its affiliates and has been licensed for use by Capital Group. Copyright © 2026 S&P Dow Jones Indices LLC, a division of S&P Global, and/or its affiliates. All rights reserved. Redistribution or reproduction in whole or in part are prohibited without written permission of S&P Dow Jones Indices LLC.
FTSE source: London Stock Exchange Group plc and its group undertakings (collectively, the "LSE Group"). © LSE Group 2026. FTSE Russell is a trading name of certain of the LSE Group companies. "FTSE®" is a trade mark of the relevant LSE Group companies and is used by any other LSE Group company under licence. All rights in the FTSE Russell indices or data vest in the relevant LSE Group company which owns the index or the data. Neither LSE Group nor its licensors accept any liability for any errors or omissions in the indices or data and no party may rely on any indices or data contained in this communication. No further distribution of data from the LSE Group is permitted without the relevant LSE Group company's express written consent. The LSE Group does not promote, sponsor or endorse the content of this communication. The index is unmanaged and cannot be invested in directly.
BLOOMBERG® is a trademark and service mark of Bloomberg Finance L.P. and its affiliates (collectively “Bloomberg”). Bloomberg or Bloomberg’s licensors own all proprietary rights in the Bloomberg Indices. Neither Bloomberg nor Bloomberg’s licensors approves or endorses this material, or guarantees the accuracy or completeness of any information herein, or makes any warranty, express or implied, as to the results to be obtained therefrom and, to the maximum extent allowed by law, neither shall have any liability or responsibility for injury or damages arising in connection therewith.
The MSCI information may only be used for your internal use, may not be reproduced or redisseminated in any form and may not be used as a basis for or a component of any financial instruments or products or indices. None of the MSCI information is intended to constitute investment advice or a recommendation to make (or refrain from making) any kind of investment decision and may not be relied on as such. Historical data and analysis should not be taken as an indication or guarantee of any future performance analysis, forecast or prediction. The MSCI information is provided on an “as is” basis and the user of this information assumes the entire risk of any use made of this information. MSCI, each of its affiliates and each other person involved in or related to compiling, computing or creating any MSCI information (collectively, the “MSCI Parties”) expressly disclaims all warranties (including, without limitation, any warranties of originality, accuracy, completeness, timeliness, non-infringement, merchantability and fitness for a particular purpose) with respect to this information. Without limiting any of the foregoing, in no event shall any MSCI Party have any liability for any direct, indirect, special, incidental, punitive, consequential (including, without limitation, lost profits) or any other damages. (www.msci.com)
Capital believes the software and information from FactSet to be reliable. However, Capital cannot be responsible for inaccuracies, incomplete information or updating of the information furnished by FactSet. The information provided in this report is meant to give you an approximate account of the fund/manager's characteristics for the specified date. This information is not indicative of future Capital investment decisions and is not used as part of our investment decision-making process.
Indices are unmanaged and cannot be invested in directly. Returns represent past performance, are not a guarantee of future performance, and are not indicative of any specific investment.
All Capital Group trademarks are owned by The Capital Group Companies, Inc. or an affiliated company in Canada, the U.S. and other countries. All other company names mentioned are the property of their respective companies.
Capital Group funds are offered in Canada by Capital International Asset Management (Canada), Inc., part of Capital Group, a global investment management firm originating in Los Angeles, California in 1931. Capital Group manages equity assets through three investment groups. These groups make investment and proxy voting decisions independently. Fixed income investment professionals provide fixed income research and investment management across the Capital organization; however, for securities with equity characteristics, they act solely on behalf of one of the three equity investment groups.
The Capital Group funds offered on this website are available only to Canadian residents.